library(tidyverse) Load the required libraries and data
Read the data
ctr_africa <- readRDS("~/Documents/R/R_general_resources/EDA_and_maps/30DayMapChallenge/2024/day6_raster/data/ctr_africa.rds")
kriging_df<- readRDS("~/Documents/R/R_general_resources/EDA_and_maps/30DayMapChallenge/2024/day6_raster/data/kriging_df.rds")
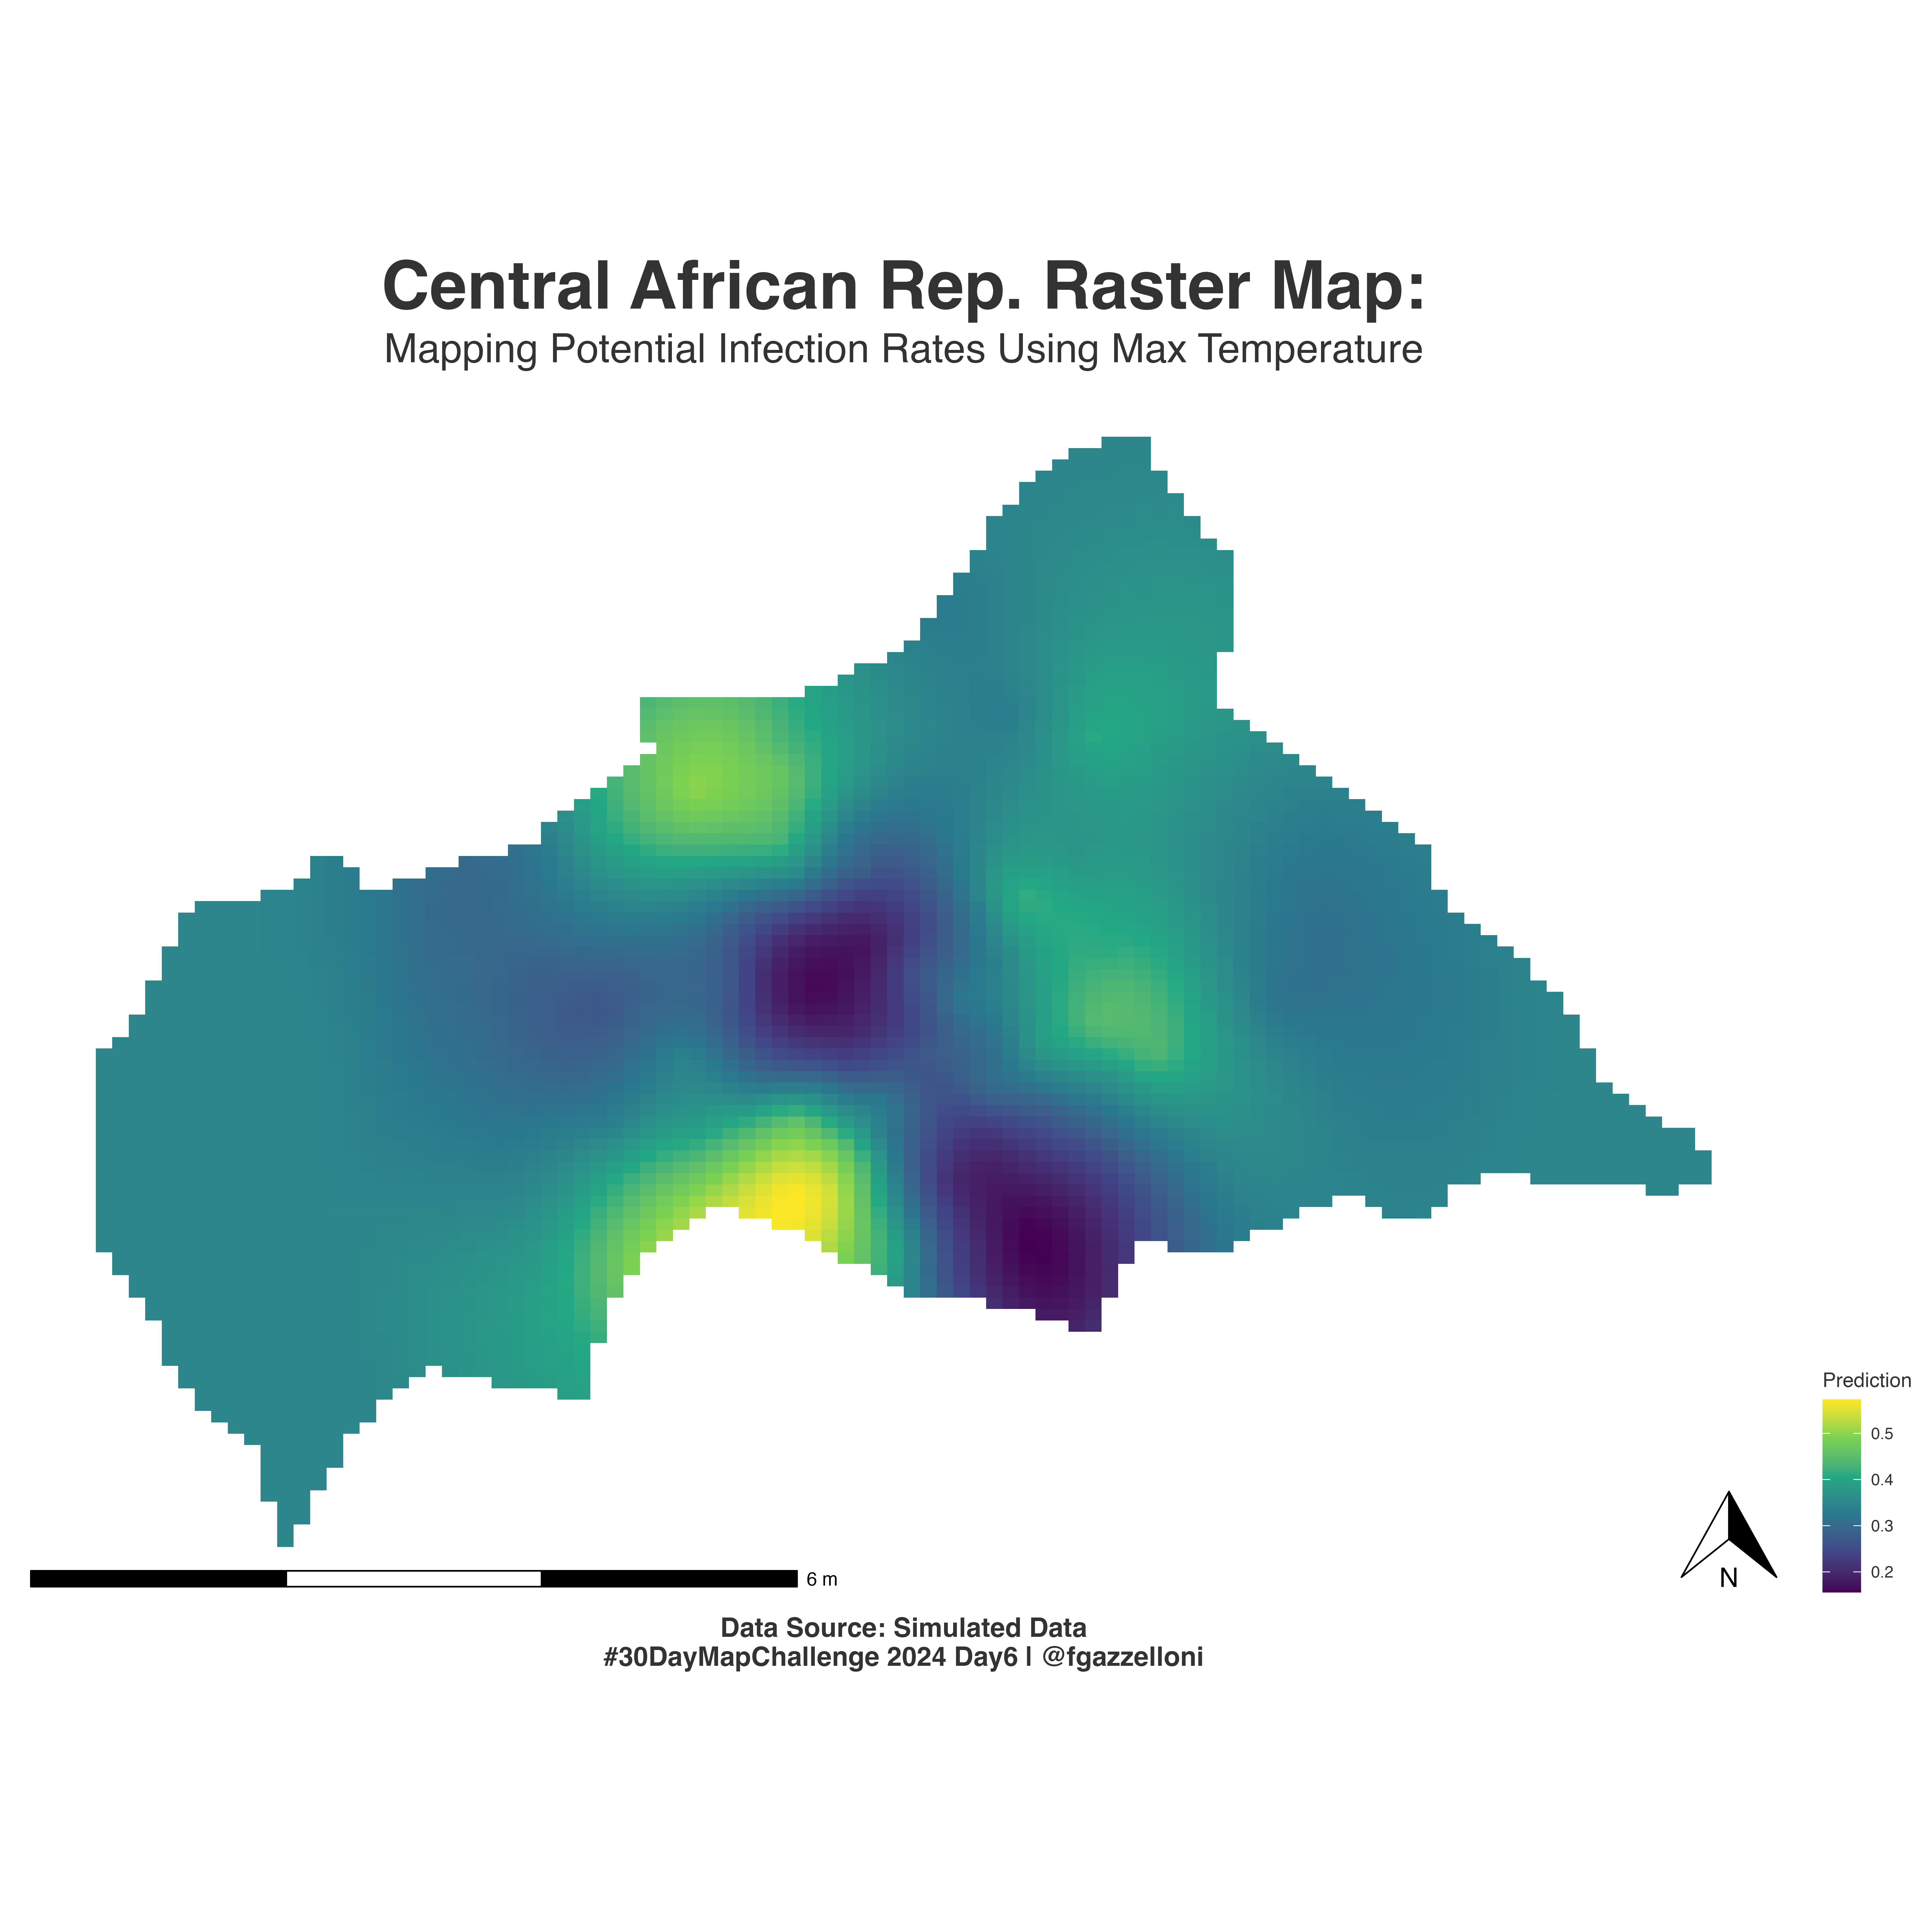
Plot the raster map
ggplot() +
  geom_raster(data =  kriging_df,
              aes(x = longitude, y = latitude,
                  fill = var1.pred)) +
  # rename the legend
  scale_fill_viridis_c(name = "Prediction") +
  coord_sf(clip = "off") +
  labs(title = "Central African Rep. Raster Map:",
         subtitle = "Mapping Potential Infection Rates Using Max Temperature",
         caption = "Data Source: Simulated Data\n#30DayMapChallenge 2024 Day6 | @fgazzelloni") +
  ggthemes::theme_map() +
  theme(text = element_text(family = "sans", color = "grey20"),
        legend.position = "right",
        plot.title = element_text(face = "bold",
                                  hjust = 0.5,
                                  size = 30),
        plot.subtitle = element_text(size = 18,hjust = 0.5),
        plot.caption = element_text(size = 12,
                                    face = "bold",
                                    hjust = 0.5)) +
  # add a north arrow and a scale bar
  ggspatial::annotation_north_arrow(location = "br") +
  ggspatial::annotation_scale(location = "bl", width_hint = 0.5)
Save the plot as png
ggsave("day6_raster/day6_raster.png",
       bg = "white",
       width = 12, height = 12,
       units = "in", dpi = 600)