# Install and load required packages
if (!requireNamespace("sf", quietly = TRUE)) install.packages("sf")
if (!requireNamespace("ggplot2", quietly = TRUE)) install.packages("ggplot2")
if (!requireNamespace("rnaturalearth", quietly = TRUE)) install.packages("rnaturalearth")
library(sf)
library(ggplot2)
library(rnaturalearth)
# Load the world map data
world <- ne_countries(scale = "medium", returnclass = "sf")
# Create a data frame with the city coordinates
cities <- data.frame(
city = c("Rome", "Madrid", "London", "Paris", "Rome"),
lon = c(12.4964, -3.7038, -0.1276, 2.3522, 12.4964),
lat = c(41.9028, 40.4168, 51.5074, 48.8566, 41.9028))
# Create an sf object from the cities data frame
cities_sf <- st_as_sf(cities, coords = c("lon", "lat"),
crs = 4326,
agr = "constant")# Plot the map with the travel route
map <- ggplot(data = world) +
geom_sf(fill = "lightgray", color = "white") +
geom_sf(data = cities_sf, color = "red", size = 3) +
geom_path(data = cities, aes(x = lon, y = lat, group = 1),
color = "darkgreen", size = 1) +
geom_text(data = cities, aes(x = lon, y = lat, label = city),
nudge_y = 0.5,
fontface = "bold",
size = 4) +
coord_sf(xlim = c(-10, 20), ylim = c(35, 55),clip = "off") +
labs(title = "Travel Journey Map:",
subtitle = "Rome -> Madrid -> London -> Paris -> Rome",
caption = "Data source: Natural Earth\n#30DayMapChallenge 2024 Day5 | @fgazzelloni") +
ggthemes::theme_map() +
theme(text = element_text(family = "mono", color = "darkgreen"),
legend.position = "right",
plot.title = element_text(hjust = 0.5,
face = "bold",
color = "darkgreen",
size = 25),
plot.subtitle = element_text(hjust = 0.5,
color = "darkgreen",
face = "bold",
size = 12),
plot.caption = element_text(hjust = 0.5,
color = "darkgreen",
face = "bold",
size = 10)) +
# add a north arrow and a scale bar
ggspatial::annotation_north_arrow(location = "br") +
ggspatial::annotation_scale(location = "bl", width_hint = 0.5)
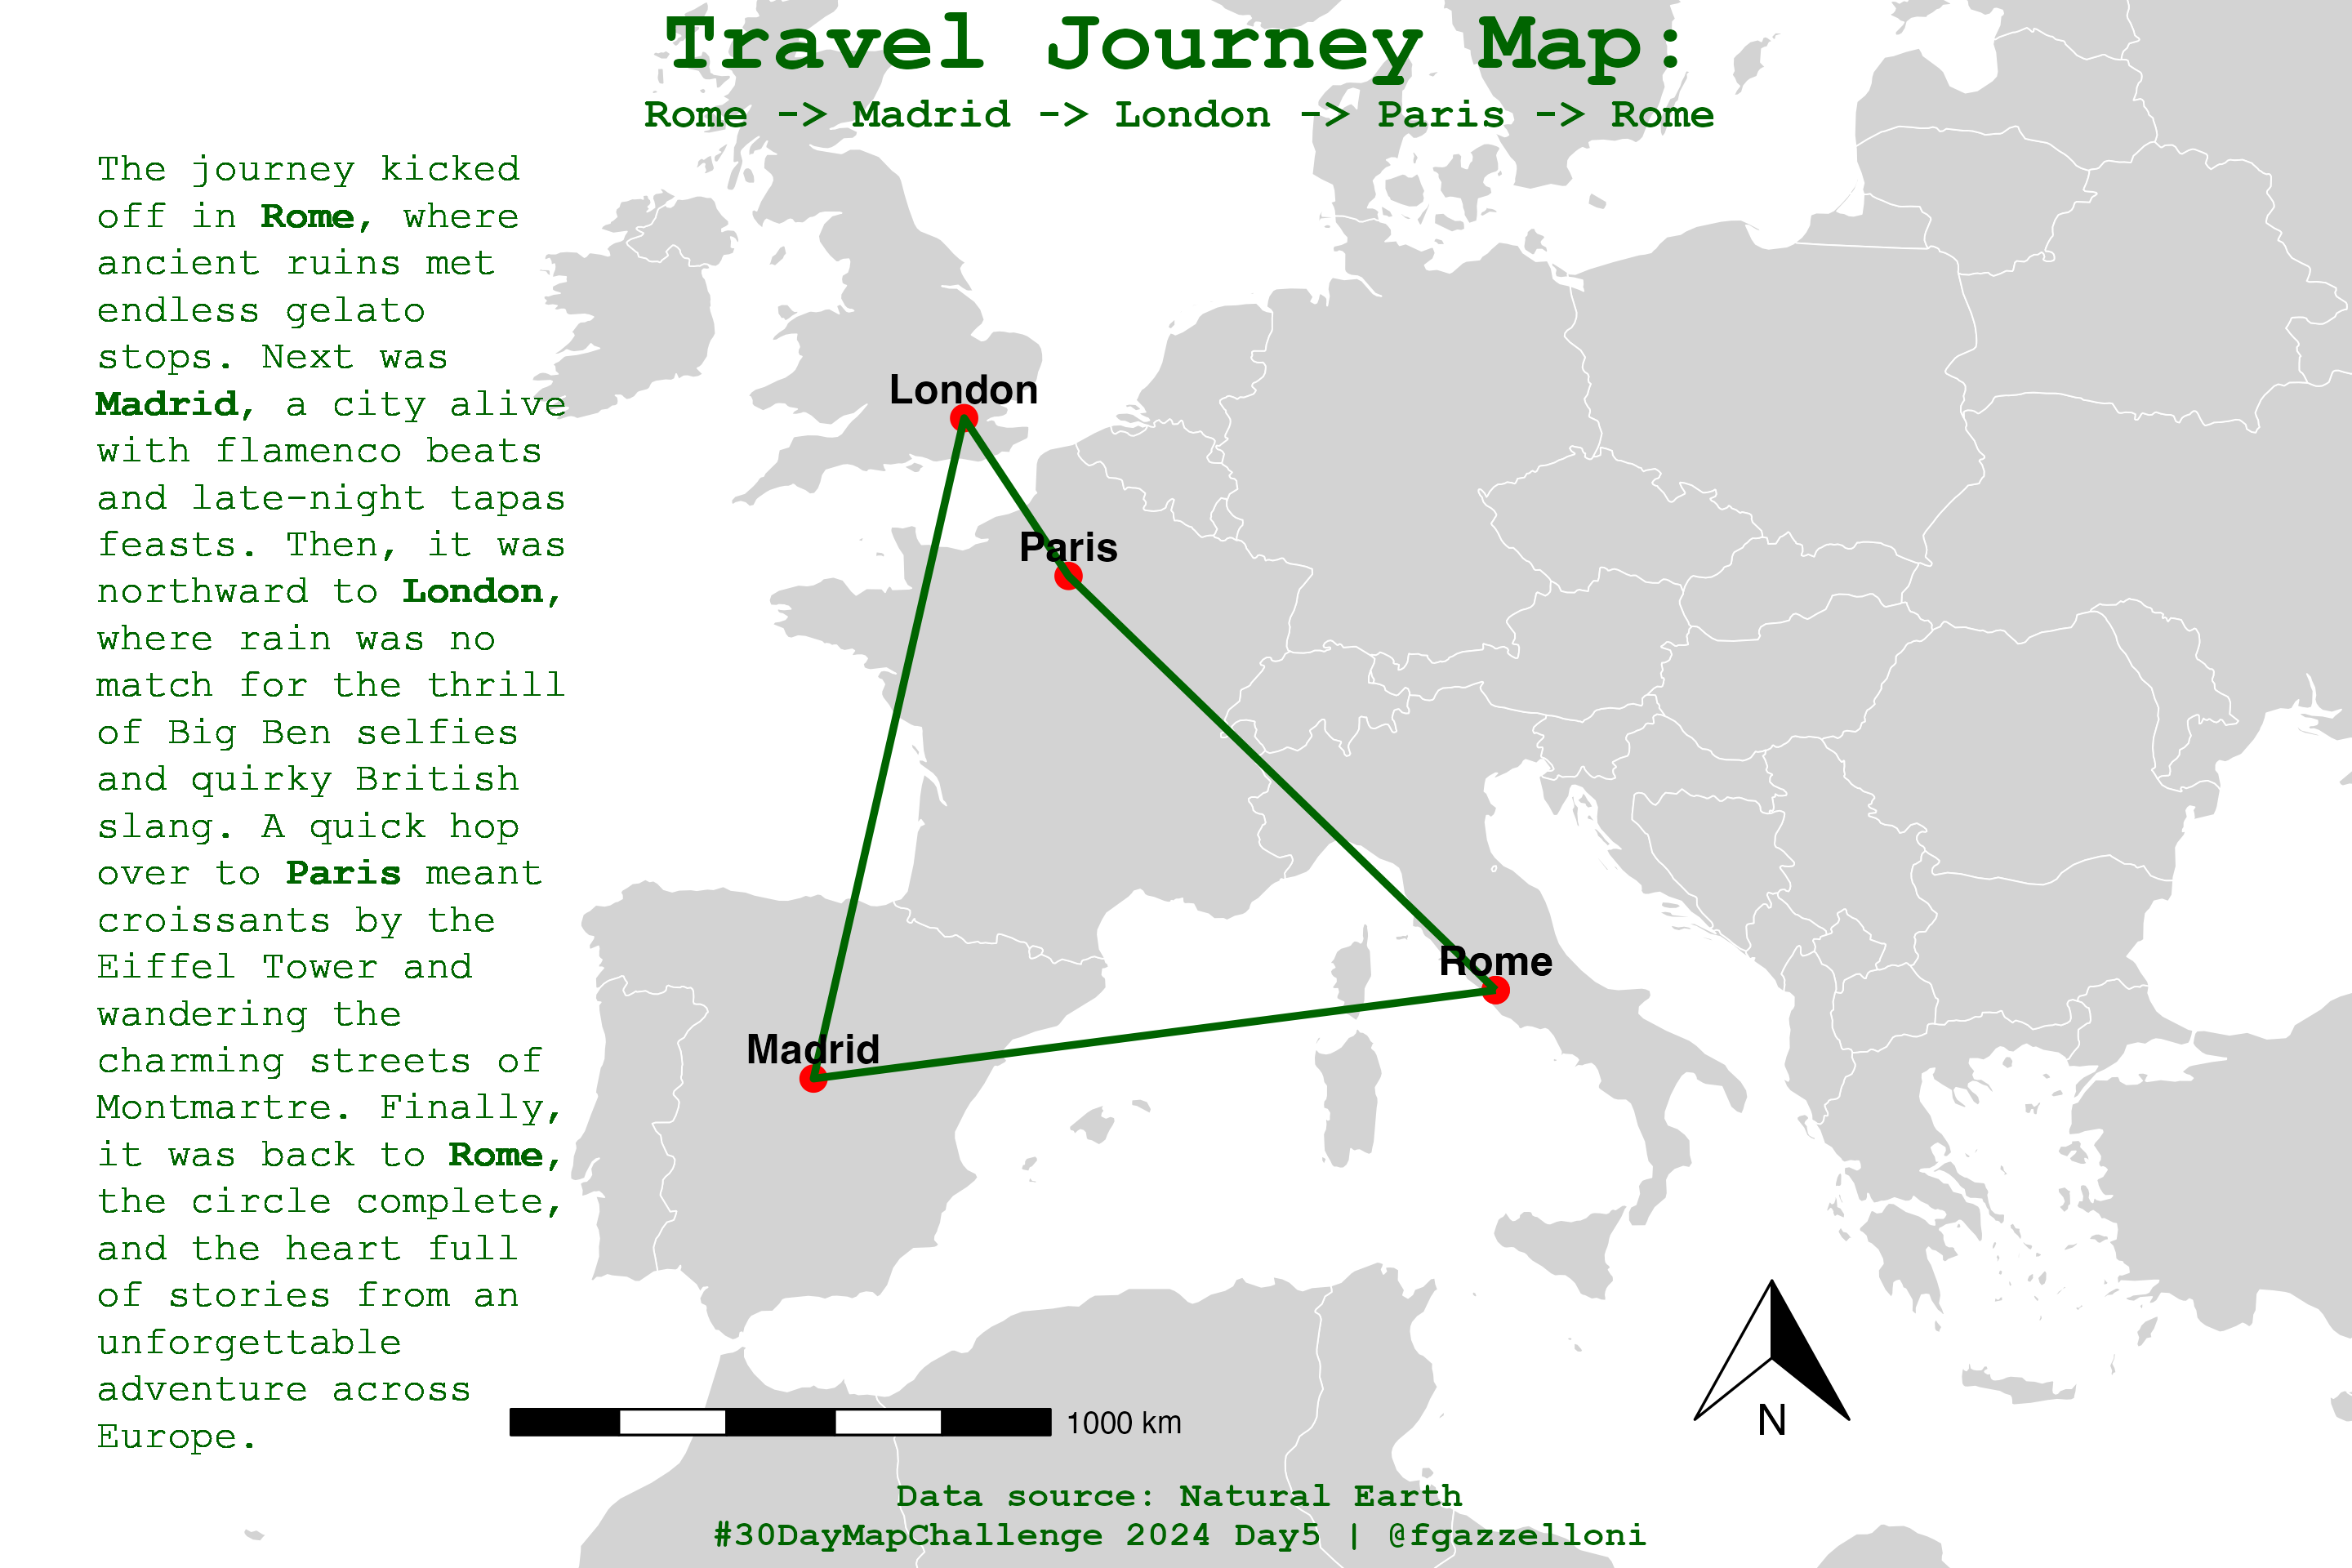
mapstory <- c("The journey kicked off in <b>Rome</b>, where ancient ruins met endless gelato stops. Next was <b>Madrid</b>, a city alive with flamenco beats and late-night tapas feasts. Then, it was northward to <b>London</b>, where rain was no match for the thrill of Big Ben selfies and quirky British slang. A quick hop over to <b>Paris</b> meant croissants by the Eiffel Tower and wandering the charming streets of Montmartre. Finally, it was back to <b>Rome</b>, the circle complete, and the heart full of stories from an unforgettable adventure across Europe.")map +
ggtext::geom_textbox(
x = -15, y = 45,
label = story,
size = 3.8,
family = "mono",
color = "darkgreen",
fill = "transparent",
box.color = "transparent"
) Save as png
ggsave("day5_a-journey.png",
       bg = "white",
       width = 9,
       height = 6,
       dpi = 320)