library(ggplot2)
library(rnaturalearth)
library(tidyterra)
library(ggthemes)
library(ggspatial)

# Load polygon data (e.g., Europe shapefile)
europe <- ne_countries(continent = "Europe", returnclass = "sf")

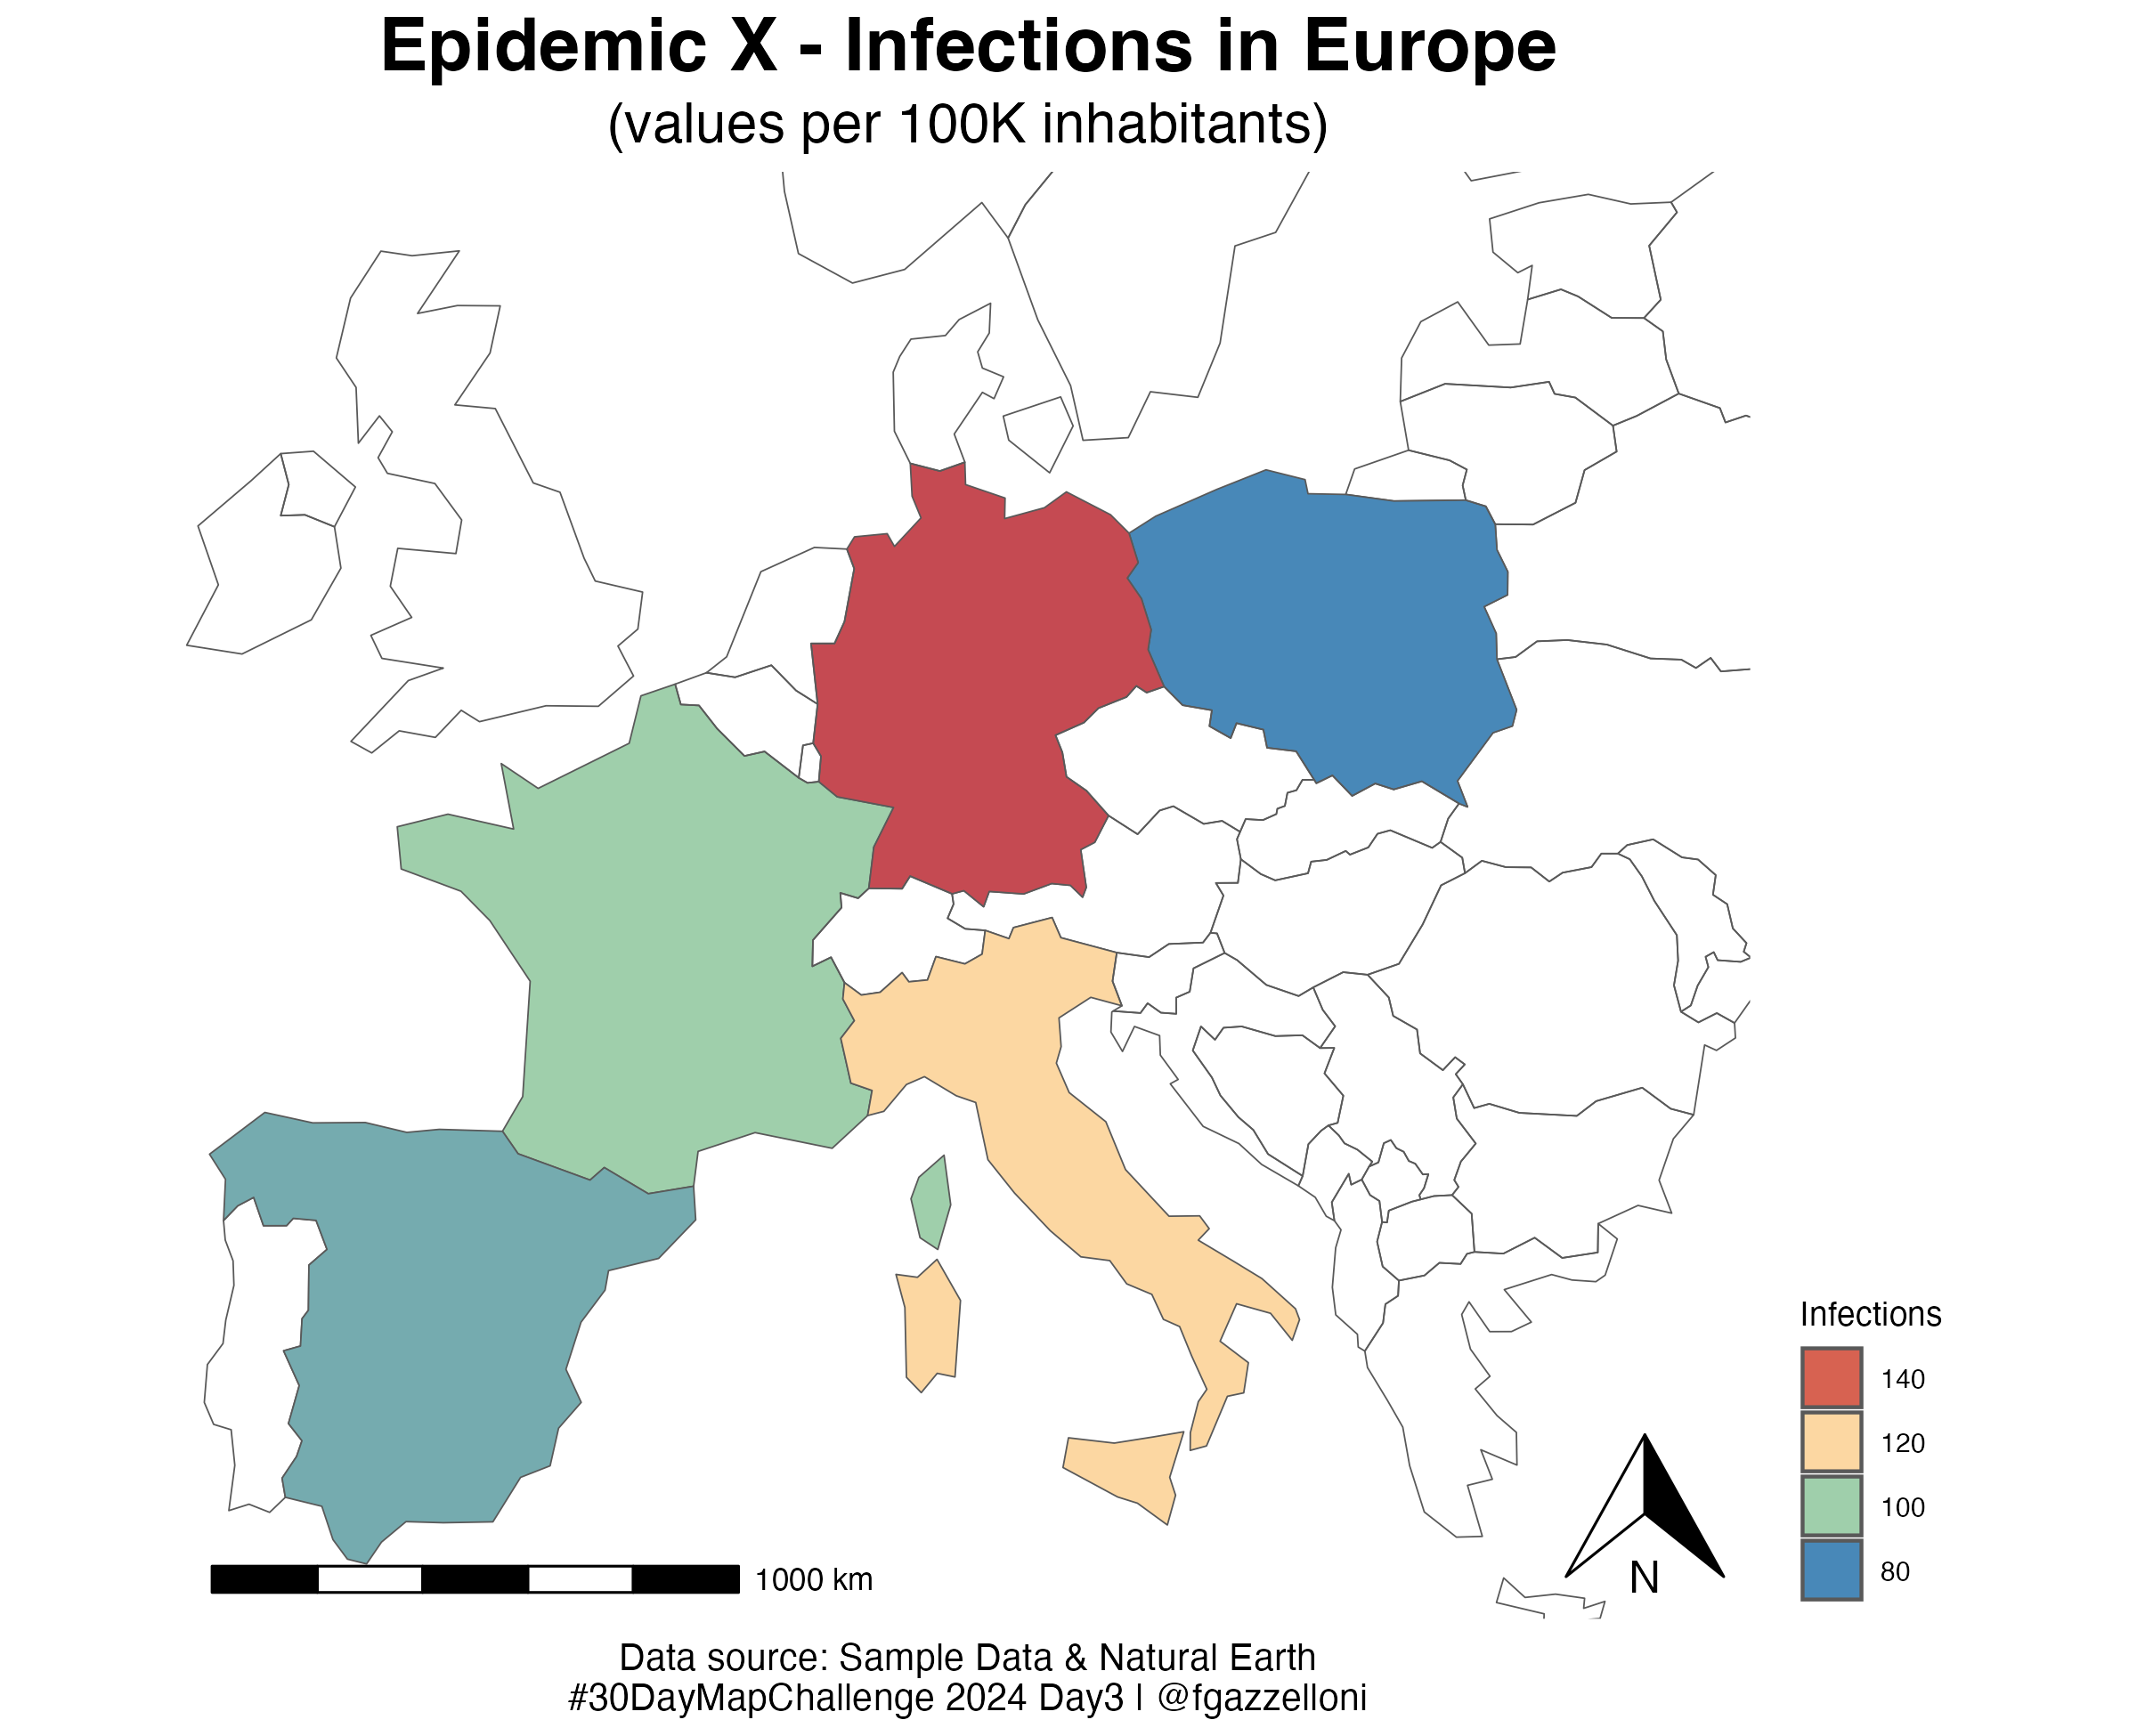
infection_data <- data.frame(
  name = c("France", "Germany", "Italy", "Spain", "Poland"),
  infections = c(100000, 150000, 120000, 90000, 80000),
  infections_per_100k = c(100, 150, 120, 90, 80)
)

# Merge polygon data with infection data
europe_infections <- europe %>%
  left_join(infection_data, by = "name")

# Plot the map
ggplot(data = europe_infections) +
  geom_sf(aes(fill = infections_per_100k)) +
    scale_fill_whitebox_c(
    palette = "muted",
    n.breaks = 5,
    guide = guide_legend(reverse = TRUE)
  ) +
  # Set coordinate reference system
  coord_sf(xlim = c(-10, 30), ylim = c(35, 60), expand = FALSE) +
  labs(title = "Epidemic X - Infections in Europe",
       subtitle = "(values per 100K inhabitants)",
       caption = "Data source: Sample Data & Natural Earth\n#30DayMapChallenge 2024 Day3 | @fgazzelloni",
       fill = "Infections")+
  ggthemes::theme_map() +
  theme(legend.position = "right",
        plot.title = element_text(hjust = 0.5,
                                  face = "bold",
                                  size = 20),
        plot.subtitle = element_text(hjust = 0.5, size = 15),
        plot.caption = element_text(hjust = 0.5, size = 10)) +
  # add a north arrow and a scale bar
  ggspatial::annotation_north_arrow(location = "br") +
  ggspatial::annotation_scale(location = "bl", width_hint = 0.5)
