library(sf)
library(tidyverse)
library(rnaturalearth)
library(gganimate)  # For animation
?datasets::WorldPhones
WorldPhonesLoad spatial information for these areas: N.Amer, Europe, Asia, S.Amer, Oceania, Africa, Mid.Amer:
N.Amer <- ne_countries(continent = "North America",
                       returnclass = "sf")%>%
  select(geometry)%>%
  mutate(continent="N.Amer")
Europe <- ne_countries(continent = "Europe",
                       returnclass = "sf") %>%
  select(geometry)%>%
  mutate(continent="Europe")
Asia <- ne_countries(continent = "Asia",
                     returnclass = "sf") %>%
  select(geometry)%>%
  mutate(continent="Asia")
S.Amer <- ne_countries(continent = "South America",
                       returnclass = "sf") %>%
  select(geometry)%>%
  mutate(continent="S.Amer")
Oceania <- ne_countries(continent = "Oceania",
                        returnclass = "sf") %>%
  select(geometry)%>%
  mutate(continent="Oceania")
Africa <- ne_countries(continent = "Africa",
                       returnclass = "sf") %>%
  select(geometry)%>%
mutate(continent="Africa")ggplot() +
geom_sf(data = Africa, fill = "lightblue") +
geom_sf(data = europe, fill = "lightgreen") +
geom_sf(data = Asia, fill = "lightyellow") +
geom_sf(data = N.Amer, fill = "lightpink") +
geom_sf(data = S.Amer, fill = "lightcoral") +
geom_sf(data = Oceania, fill = "lightgrey") +
theme_void()data <- as.data.frame(WorldPhones) %>%
rownames_to_column(var = "year")
datadata %>%
pivot_longer(-year,
names_to = "region",
values_to = "phones") %>%
ggplot(aes(fill = region, y = phones, x = year)) +
geom_bar(stat = "identity") +
theme_minimal() +
theme(legend.position = "bottom") +
labs(title = "World Phones by Region",
x = "Year",
y = "Phones",
fill = "Region") +
transition_states(states = year,
transition_length = 2,
state_length = 1) +
enter_fade() +
exit_fade()library(viridis) # For distinct color scales
# Ensure your year column is a factor
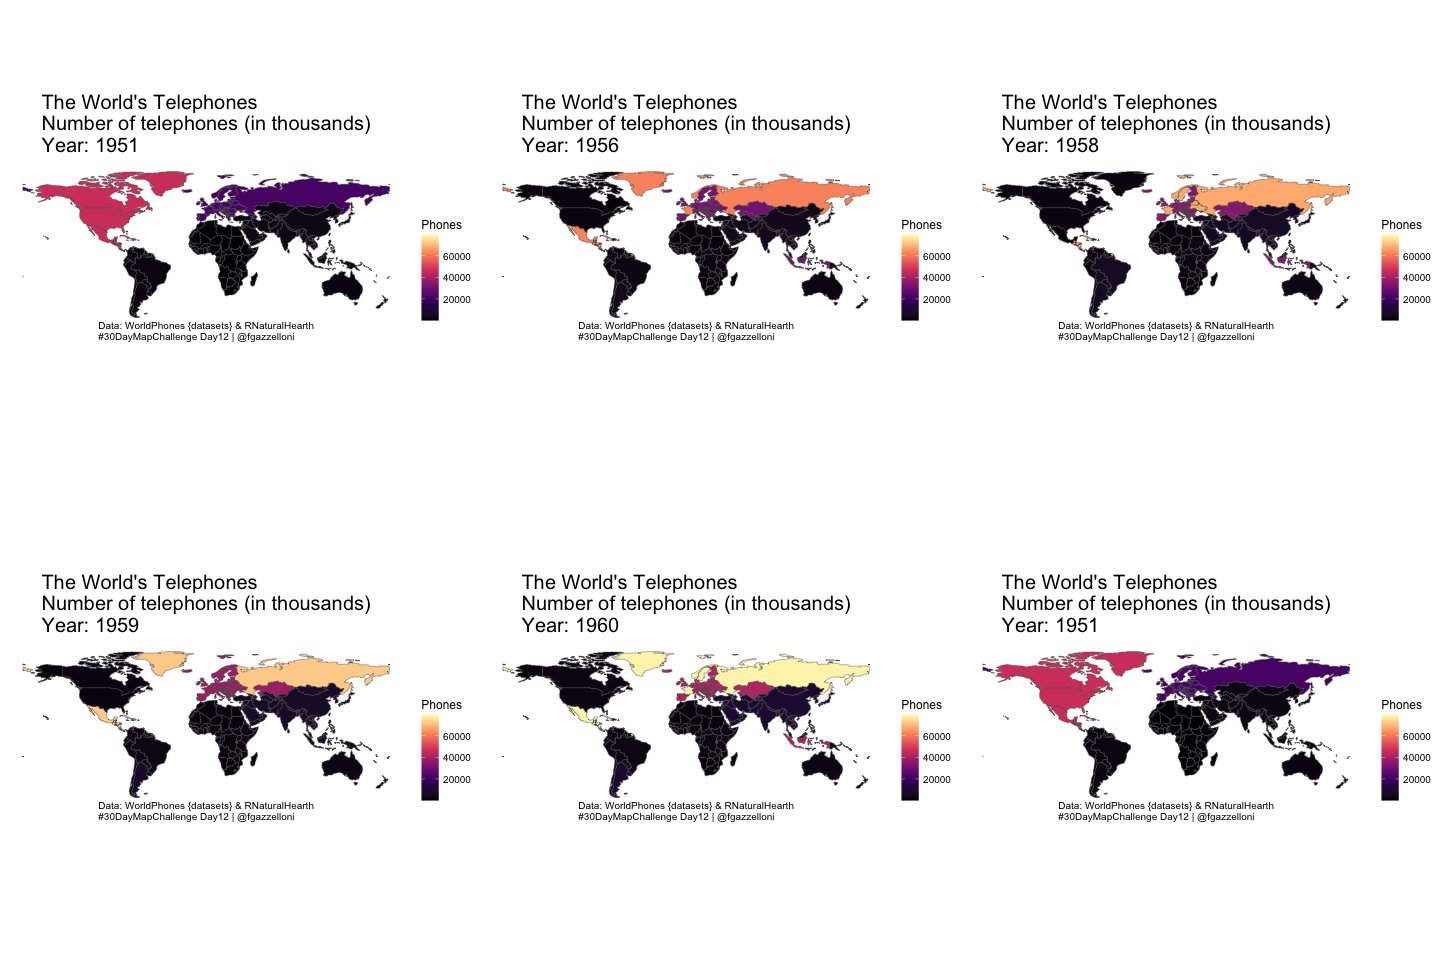
data_coords %>%
mutate(year = as.factor(year)) %>%
ggplot() +
geom_sf(aes(fill = phones)) +
scale_fill_viridis_c(name = "Phones",
option = "magma") +
labs(title = "The World's Telephones\nNumber of telephones (in thousands)\nYear: {closest_state}",
caption = "Data: WorldPhones {datasets} & RNaturalHearth\n#30DayMapChallenge Day12 | @fgazzelloni") +
ggthemes::theme_map() +
theme(plot.title = element_text(size = 20,
face = "bold",
hjust = 0.5),
plot.subtitle = element_text(size = 14,
hjust = 0.5),
plot.caption = element_text(size = 10,
hjust = 0.5),
legend.position = "right",
legend.title = element_text(size = 12),
legend.text = element_text(size = 10)
) +
transition_states(year,
transition_length = 1,
state_length = 1) +
ease_aes('linear')Save the Gif
anim_save("day12_space&time.gif",
          title = "The World's Telephones",
          description = "The number of telephones in various regions of the world (in thousands)",
          tags = "#30DayMapChallenge",
          category = "Space and Time",
          gif = animate_options(renderer = gifski_renderer()))