# Install and load required packages
if (!requireNamespace("sdmpredictors", quietly = TRUE)) install.packages("sdmpredictors")
Load the required libraries and data
library(sdmpredictors)
library(ggplot2)
library(rnaturalearth)
library(raster)
library(sf)
library(stars)
## Load sea ice thickness raster data
iceMapMin <- load_layers("BO21_icethickltmin_ss")
iceMapMax <- load_layers("BO21_icethickltmax_ss")# Convert RasterBrick to data frame
raster_iceMapMin <- as.data.frame(rasterToPoints(iceMapMin),
xy = TRUE)
raster_iceMapMax <- as.data.frame(rasterToPoints(iceMapMax),
xy = TRUE)ggplot()+
geom_raster(data = raster_iceMapMin,
aes(x = x, y = y, fill = BO21_icethickltmin_ss))+
geom_raster(data = raster_iceMapMax,
aes(x = x, y = y, fill = BO21_icethickltmax_ss))+
scale_fill_viridis_c(option = "D", direction = -1)## Load a polygon defining landmasses
worldMap <- ne_countries(scale = 10, returnclass = "sf")ggplot()+
geom_sf(data = worldMap)+
geom_raster(data = raster_iceMapMin,
aes(x = x, y = y, fill = BO21_icethickltmin_ss))+
geom_raster(data = raster_iceMapMax,
aes(x = x, y = y, fill = BO21_icethickltmax_ss))+
scale_fill_viridis_c(option = "D", direction = -1) +
coord_sf()Use other data
Source: https://www.cpom.ucl.ac.uk/csopr/seaice.php?show_thk_map_download_pane=1&show_basin_thickness=0&basin_selected=0&big_thickness_image=0&thk_period=28&year=2011&imonth=12&season=Autumn&ts_area_or_point=all accessed Noember 11, 2024
library(R.utils)
library(data.table)
Code
# read this file
url <- "https://www.cpom.ucl.ac.uk/csopr/sidata/thk_28.map.07012024_03022024.txt.gz"
downloaded_file <- "thk_28.map.07012024_03022024.txt.gz"
decompressed_file <- "thk_28.map.07012024_03022024.txt"
# Step 1: Download the compressed file
download.file(url, downloaded_file, mode = "wb")
# Step 2: Decompress the file
gunzip(downloaded_file,
destname = decompressed_file,
overwrite = TRUE)data <- data.table::fread(decompressed_file,
sep = " ",
header = TRUE)
head(data)
str(data)names(data) <- c("lat", "lon", "thickness", "uncertainty", "quality", "distance")head(data)artic_sf <- data %>%
st_as_sf(coords = c("lon", "lat"), crs = 4326)
artic_sfggplot()+
geom_sf(data = artic_sf, shape=".")ggplot()+
geom_sf(data = worldMap) +
geom_sf(data = artic_sf, shape=".")ggplot()+
geom_sf(data = worldMap) +
geom_sf(data = artic_sf, shape=".") +
coord_sf(crs = "+proj=ortho +lat_0=90 +lon_0=0")ggplot()+
geom_sf(data = worldMap) +
geom_sf(data = artic_sf,
aes(color = thickness),
shape=".") +
coord_sf(crs = "+proj=ortho +lat_0=90 +lon_0=0")ggplot()+
geom_sf(data = worldMap) +
geom_sf(data = artic_sf,
aes(color = thickness),
shape=".") +
geom_sf(data = artic_sf,
aes(color = uncertainty),
shape=".") +
coord_sf(crs = "+proj=ortho +lat_0=90 +lon_0=0")ggplot()+
geom_sf(data = worldMap) +
geom_sf(data = artic_sf,
aes(color = thickness),
shape=".") +
coord_sf(crs = "+proj=ortho +lat_0=90 +lon_0=0") +
labs(title = "Artic Sea Ice Thickness",
subtitle = "Orthographic Projection Centered on the North Pole -January 2024",
caption = "Source: CPOM | #30DayMapChallenge Day11 | @fgazzelloni",
color = "Thickness") +
theme_minimal() +
theme(
plot.background = element_rect(fill = "aliceblue", color = NA),
plot.title = element_text(size = 20, face = "bold", hjust = 0.5),
plot.subtitle = element_text(size = 10, hjust = 0.5),
plot.caption = element_text(size = 10, hjust = 0.5)
)ggplot() +
geom_sf(data = artic_sf,
aes(color = thickness), fill = NA) +
geom_sf(data = worldMap,
fill = NA, color = "grey20", size = 0.2) +
coord_sf(crs = "+proj=ortho +lat_0=90 +lon_0=0", clip = "off") +
scale_fill_gradientn(colors = c("#d9f0ff", "#76a9f7", "#1f78b4", "#08306b"),
limits = c(0, 5),
guide = guide_colorbar(barwidth = 10,
barheight = 0.5,
title.position = "top",
title.hjust = 0.5) )+
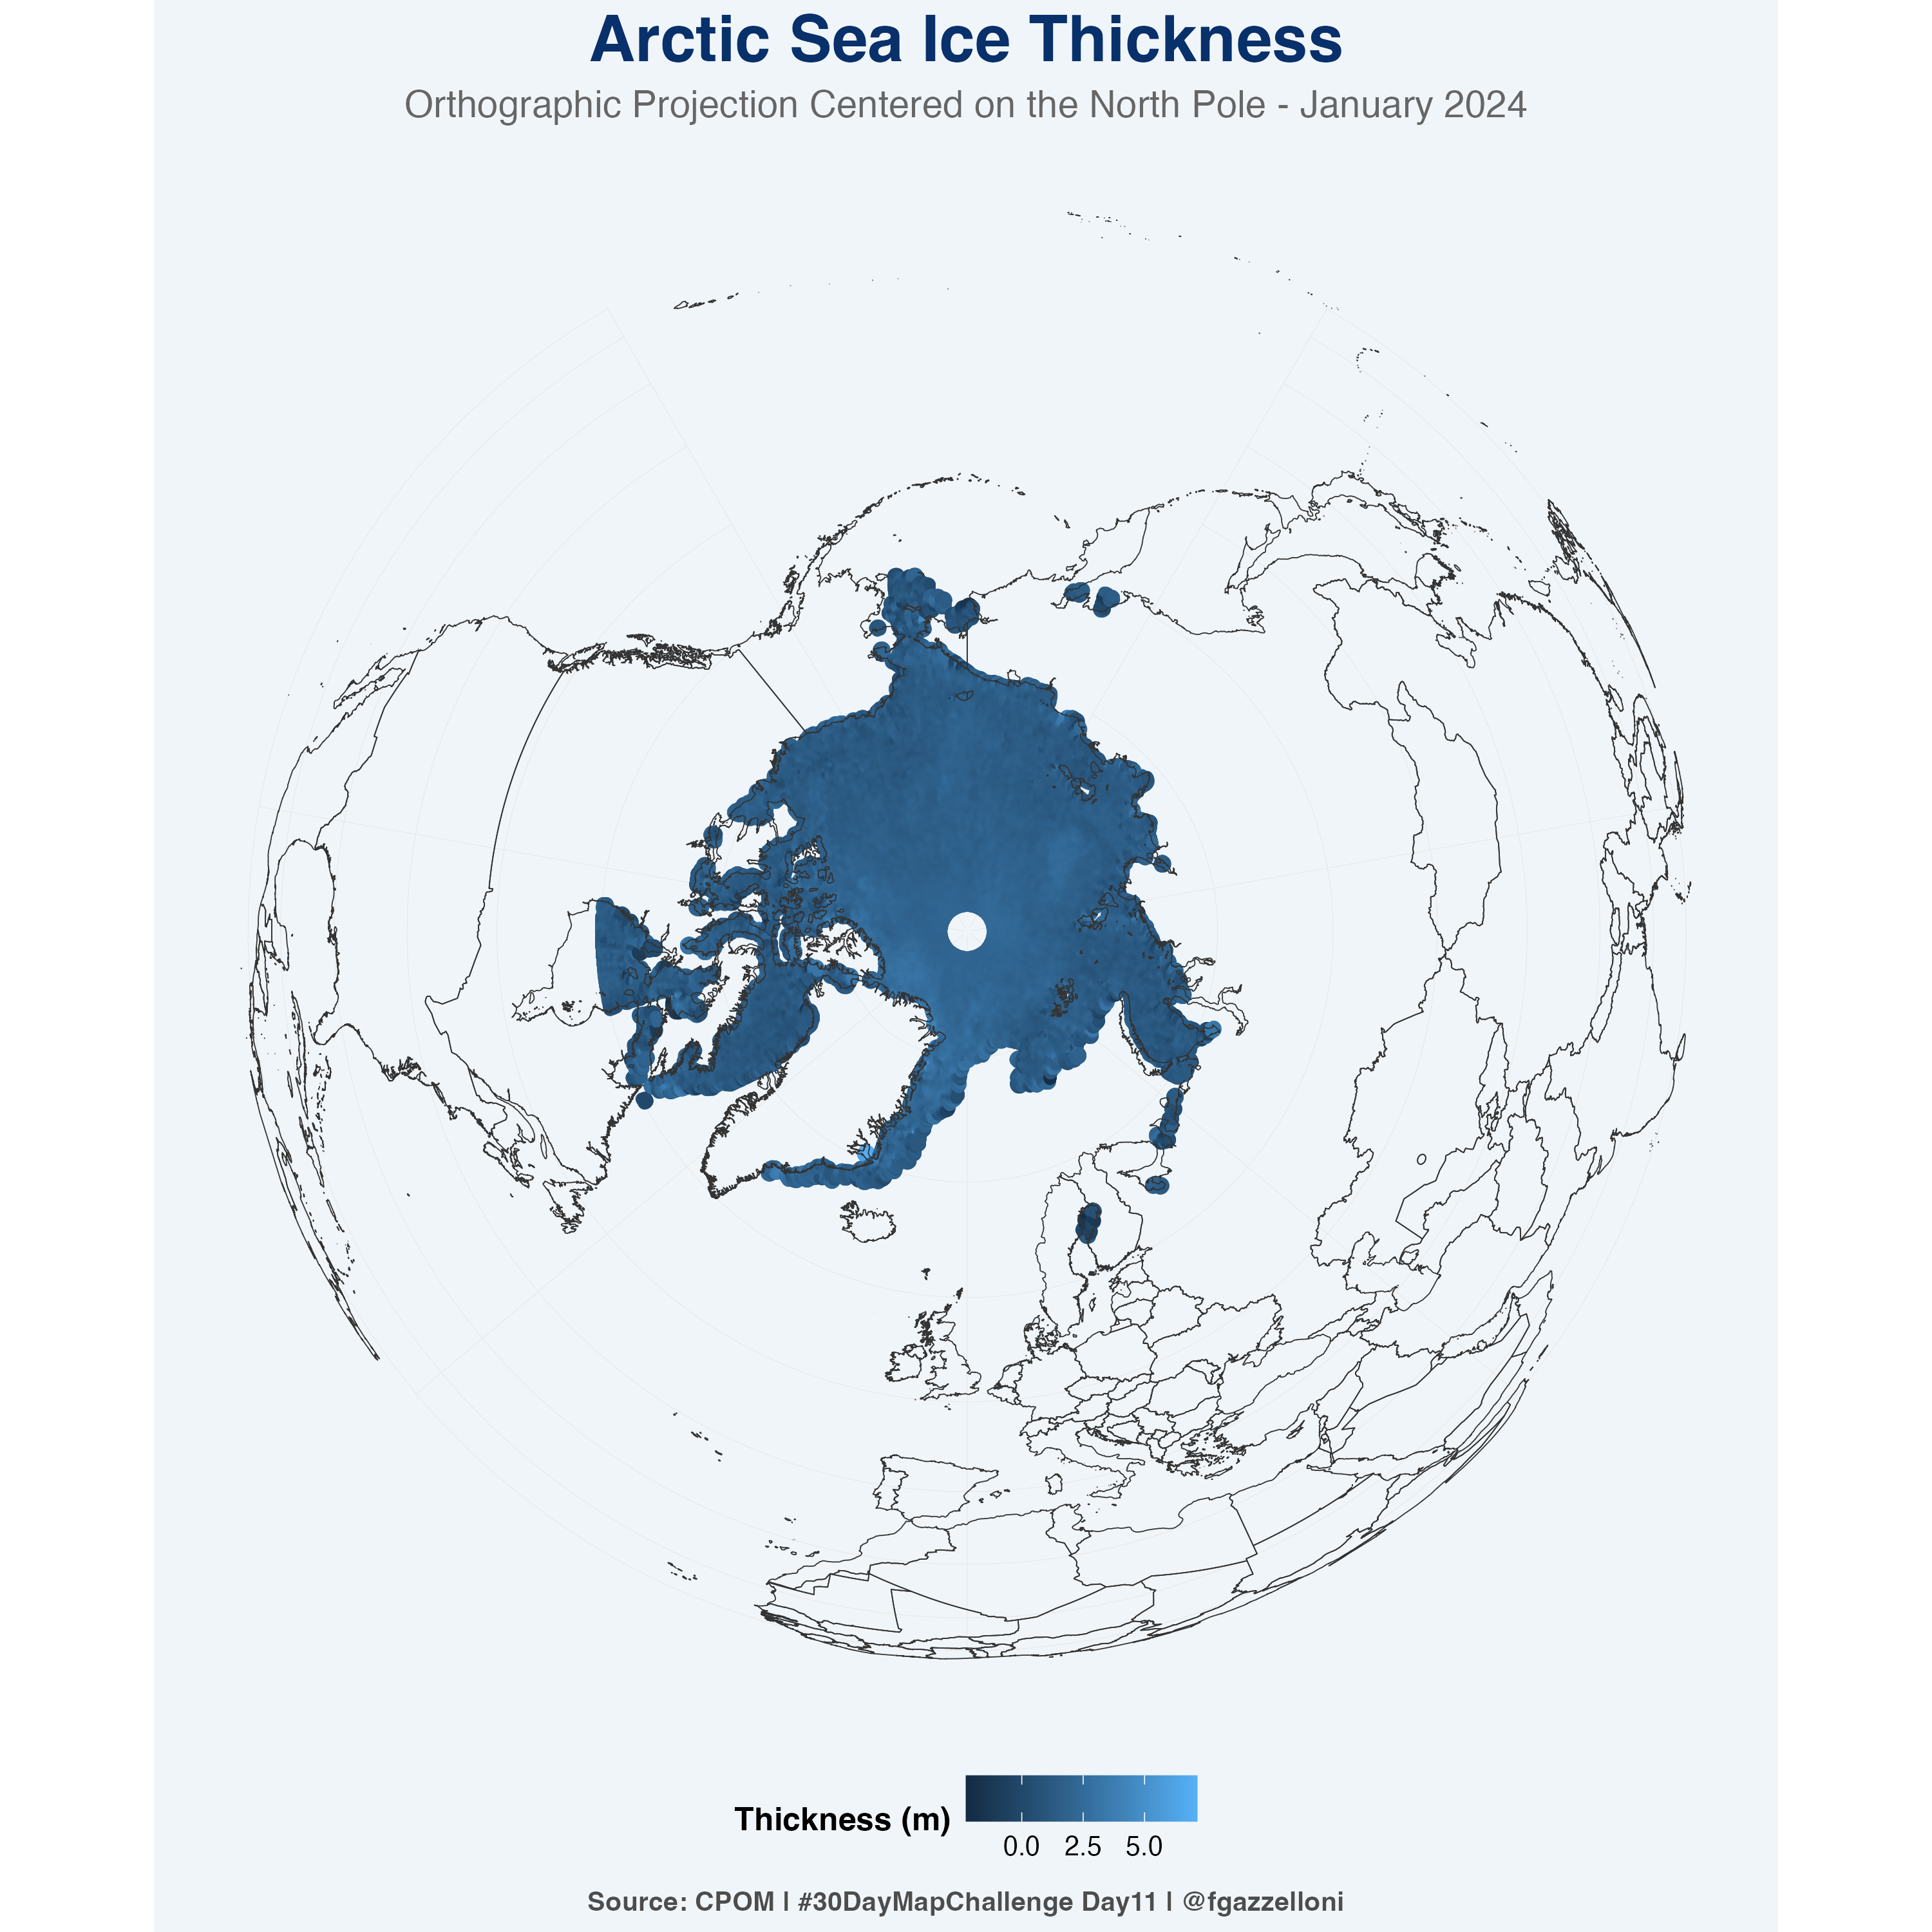
labs(title = "Arctic Sea Ice Thickness",
subtitle = "Orthographic Projection Centered on the North Pole - January 2024",
caption = "Source: CPOM | #30DayMapChallenge Day11 | @fgazzelloni",
color = "Thickness (m)") +
theme_minimal() +
theme(plot.background = element_rect(fill = "#f0f5f9", color = NA),
text = element_text(family = "Helvetica"),
plot.title = element_text(size = 24,
face = "bold",
color = "#08306b",
hjust = 0.5),
plot.subtitle = element_text(size = 14,
color = "gray40",
hjust = 0.5),
plot.caption = element_text(size = 10,
color = "gray40",
hjust = 0.5),
legend.position = "bottom",
legend.title = element_text(size = 12, face = "bold"),
legend.text = element_text(size = 10),
panel.grid.major = element_line(color = "gray90", size = 0.1),
panel.grid.minor = element_line(color = "gray90", size = 0.1))Save the map as png
ggsave("day11_artic.png",
       bg = "white",
       width = 10, height = 10,
       units = "in",
       dpi = 300)