library("sf")
library("tidyverse")
library("rnaturalearth")
library("covid19italy")Overview
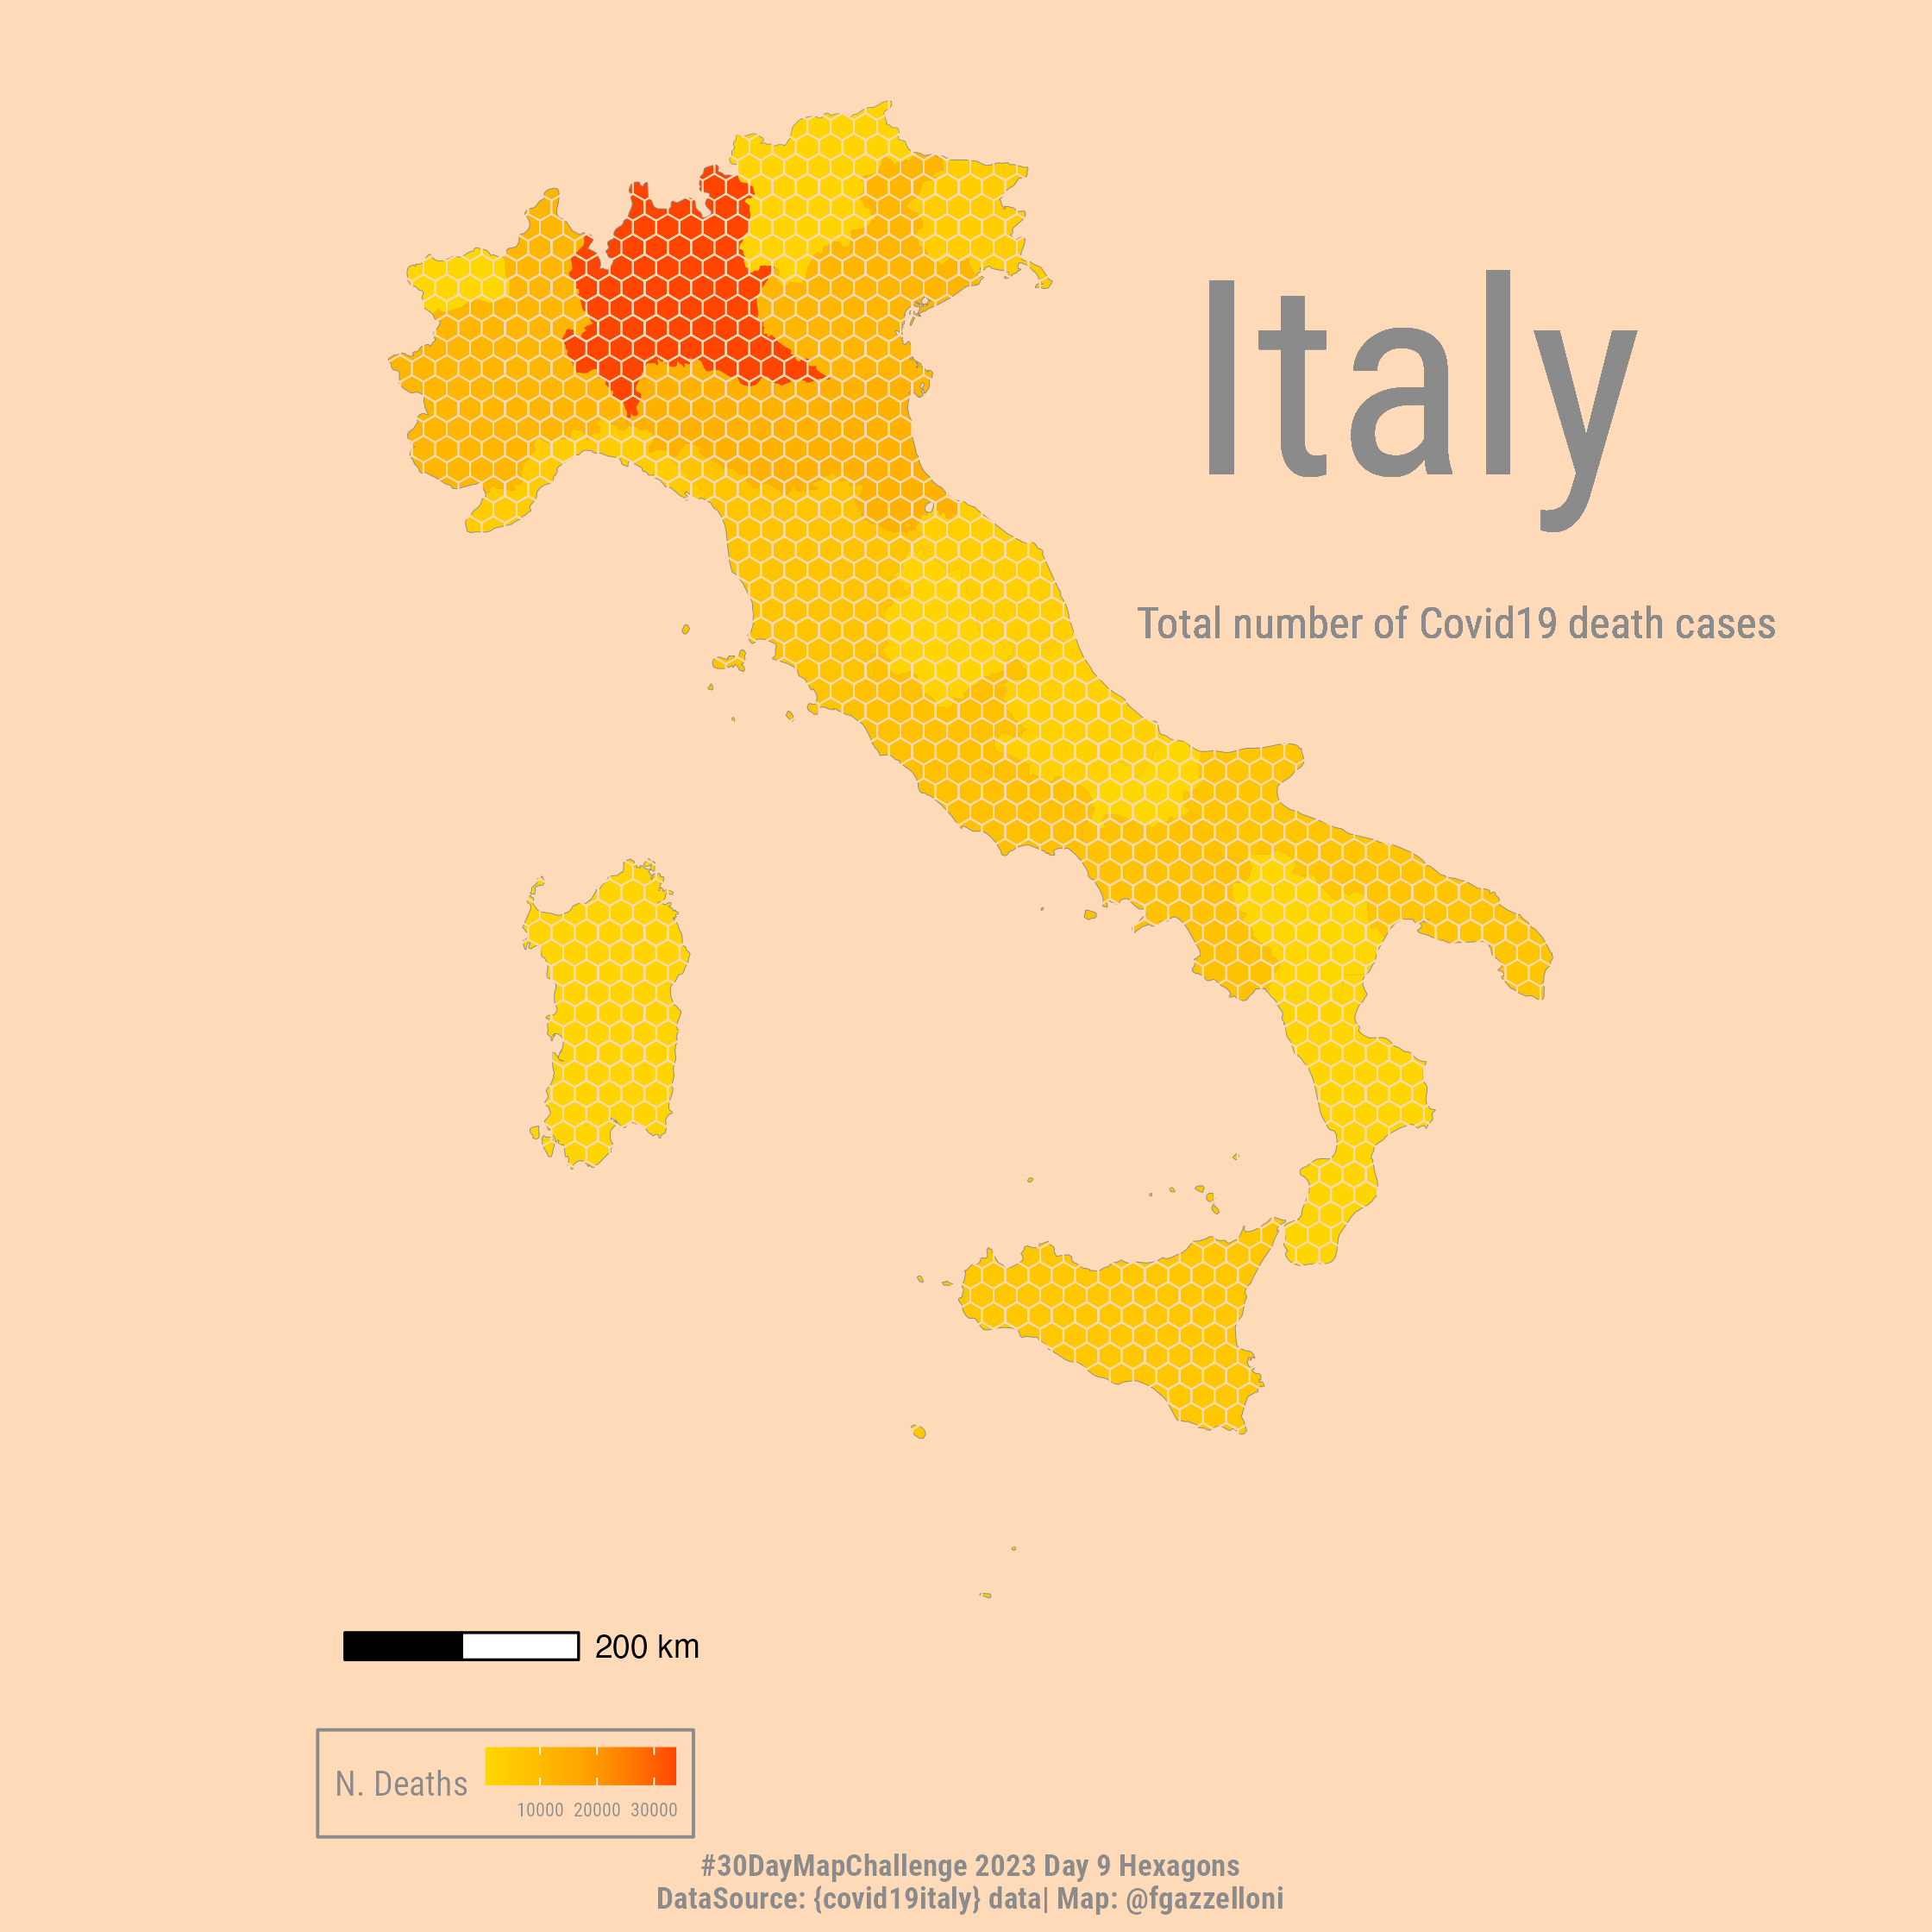
Hexagons map of Covid19 data in Italy. For this challenge I will be using the {covid19italy} package for mapping Covid19 cases in Italy.
italy_geo <- ne_states(#scale = "large",
                   country = "Italy",
                   returnclass = "sf") |>
  st_geometry() |> ##
  st_transform(3003)
italy_map <- ne_states(#scale = "large",
country = "Italy",
returnclass = "sf")
italy_map%>%namesitaly_map_region <- italy_map%>%count(region)italy_geo |>
ggplot() +
geom_sf(fill = "white", color = "pink") +
geom_sf(data=italy_map,
mapping=aes(fill=region),
color="pink",
inherit.aes = F)+
labs(fill="")+
ggthemes::theme_map()+
theme(legend.position = "bottom",
legend.key.size = unit(5,units="pt"),
legend.text = element_text(size=5))Italy Hexagons
hexgrid <- st_make_grid(italy_geo,
                        cellsize = 1e4,
                        what = 'polygons',
                        square = FALSE ## !
                        ) %>%
  st_as_sf()
hexgrid_italy <- hexgrid[c(unlist(st_contains(italy_geo, hexgrid)),
unlist(st_overlaps(italy_geo, hexgrid))) ,] italy_geo |>
ggplot() +
geom_sf(fill = "#8c8b8b", color = "#7cb3b8") +
geom_sf(data = hexgrid_italy,
color = "#43605b") +
labs(title = "Italy",
caption = "#30DayMapChallenge | Day 9: Hexagons | Map: @fgazzelloni")+
ggthemes::theme_map()Hexagons by region
italy_geo |>
  ggplot() +
  geom_sf(color = "pink") +
  geom_sf(data=italy_map,
          mapping=aes(fill=region),
          alpha=0.5,
          color=NA,
          inherit.aes = F)+
  geom_sf(data = hexgrid_italy_reg,
          fill=NA,
        color = "#43605b") +
    labs(title = "Italy",
       caption = "#30DayMapChallenge | Day 9: Hexagons | Map: @fgazzelloni")+
  labs(fill="")+
  ggthemes::theme_map()+
  theme(legend.position = "bottom",
        legend.key.size = unit(5,units="pt"),
        legend.text = element_text(size=5))
italy_map_region_covid <- italy_map_region %>%
left_join(covid19italy::italy_region %>%
filter(date == max(date)),
by = c("region" = "region_spatial"))
italy_map_region_covid%>%namesitaly_geo |>
ggplot() +
geom_sf(color = "#8c8b8b") +
geom_sf(data=italy_map_region_covid,
mapping=aes(fill=death),
color=NA,
inherit.aes = F)+
geom_sf(data = hexgrid_italy_reg,
fill=NA,
color = "#FFDAB9") +
scale_fill_gradientn(colors=rev(c("#FF4500","#FFA500","#FFD700")))+
ggtext::geom_richtext(x=2401390 ,y=4837570,
hjust = 1,
vjust=0,
label="Italy",
fill = NA,
color="#8c8b8b",
label.color = NA,
size=25,
family = "Roboto Condensed")+
ggtext::geom_richtext(x=2401390 ,y=4737570,
hjust = 0.8,
vjust=0,
color="#8c8b8b",
label="Total number of Covid19 death cases",
fill = NA,
label.color = NA,
size=4,
family = "Roboto Condensed")+
labs(caption = "#30DayMapChallenge 2023 Day 9 Hexagons\nDataSource: {covid19italy} data| Map: @fgazzelloni",
fill="N. Deaths")+
ggthemes::theme_map()+
coord_sf(clip = "off")+
theme(text=element_text(color="#8c8b8b",family="Roboto Condensed"),
plot.caption = element_text(hjust = 0.5,size=8,face = "bold"),
legend.position = "bottom",
legend.background = element_rect(color="#8c8b8b",fill="#FFDAB9"),
legend.key.size = unit(10,units="pt"),
legend.text = element_text(size=5))+
ggspatial::annotation_scale()ggsave("day9_hexagons.png",
dpi = 320, bg="#FFDAB9")Source of inspiration: https://github.com/umemasiddiqi/30DayMapChallenge/blob/main/2023/11092023/Pak-Hexagon.R
Covid-19 Italy
Source of data: https://covid19r.github.io/covid19italy/articles/geospatial_visualization.html