library(sf)
library(ggplot2)Overview
A place that has undergone significant changes over time is the city of Berlin, Germany. Berlin has a rich and complex history, and its geography and political boundaries have been dramatically transformed, especially during the 20th century.
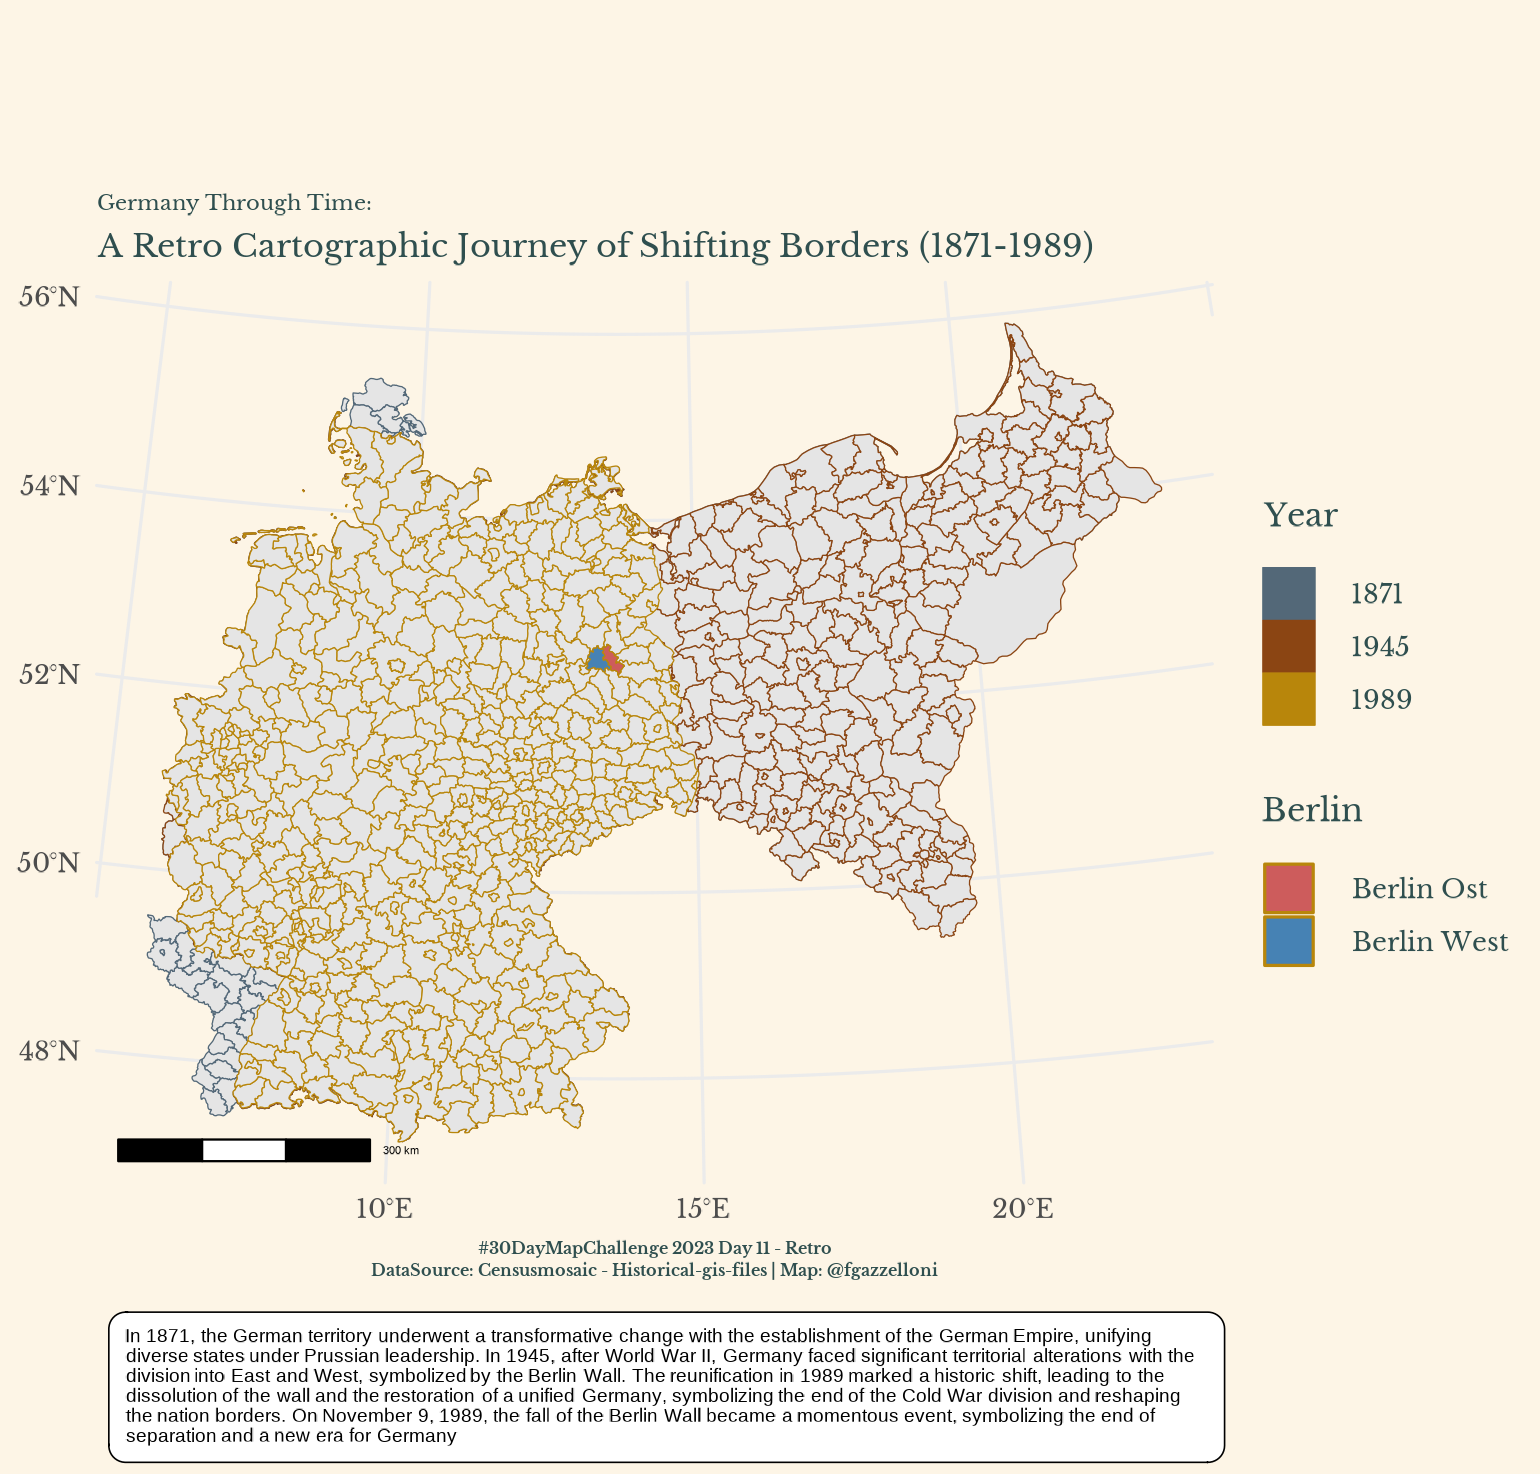
For this challenge I decided to use four layers representing the German Empire in 1871 and 1945, coupled with additional layers for Germany in 1989, specifically focusing on Berlin East and West, to craft a retro map that chronicles the profound historical shifts in Germany’s territorial landscape.
And capture the evolution of Germany from its imperial unification in 1871 through the post-World War II division into East and West, culminating in the transformative reunification of 1989.
The inclusion of specific layers for Berlin East and West, accentuated by the fall of the Berlin Wall, emphasizes the city’s symbolic role and adds a poignant narrative layer to the map.
Data is from the Max Planck Institute for Demographic Research via https://censusmosaic.demog.berkeley.edu/data/historical-gis-files
Load necessary libraries
German Empire 1871 layer
german_empire_1871 <- read_sf("data/german_empire_1871")german_empire_1871%>%classgerman_empire_1871%>%namesggplot(german_empire_1871)+
geom_sf(aes(fill=NAME),show.legend = F)German Empire 1945 layer
german_empire_1945<- read_sf("data/german_empire_1945")ggplot()+
geom_sf(data=german_empire_1871,color="red")+
geom_sf(data=german_empire_1945,color="blue")Germany 1989 layer
germany_1989 <- read_sf("data/germany_1989")ggplot()+
geom_sf(data=german_empire_1871,aes(color="1871"))+
geom_sf(data=german_empire_1945,aes(color="1945"))+
geom_sf(data=germany_1989,aes(color="1989"))+
coord_sf(crs = 'EPSG:3068',clip = "off") +
scale_color_manual(name = "Year",
values = c("#536878", "#8B4513","#B8860B"),
labels = c("1" = "1871", "2" = "1945","3"="1989")) +
labs(caption = "#30DayMapChallenge 2023 Day 11 - Retro\nDataSource: censusmosaic - historical-gis-files | Map: @fgazzelloni") +
theme(text=element_text(color="#2F4F4F"),
plot.background = element_rect(color="#FDF5E6",fill="#FDF5E6"),
panel.background = element_rect(color="#FDF5E6",fill="#FDF5E6"))+
ggspatial::annotation_scale()Berlin Ost and Berlin West layer
germany_89_berlin<- germany_1989%>%
  dplyr::filter(GEN%in%c("Berlin Ost","Berlin West"))
germany_89_berlin
Historical information
text <- dplyr::tibble(text=c("In 1871, the German territory underwent a transformative change with the establishment of the German Empire, unifying diverse states under Prussian leadership. In 1945, after World War II, Germany faced significant territorial alterations with the division into East and West, symbolized by the Berlin Wall. The reunification in 1989 marked a historic shift, leading to the dissolution of the wall and the restoration of a unified Germany, symbolizing the end of the Cold War division and reshaping the nation borders. On November 9, 1989, the fall of the Berlin Wall became a momentous event, symbolizing the end of separation and a new era for Germany"))Set the fonts
library(showtext)
showtext::showtext_auto()
library(sysfonts)
sysfonts::font_add_google("Libre Baskerville","Libre Baskerville")
theme_set(theme_minimal(base_family = "Libre Baskerville"))
Make the Map
ggplot()+
  geom_sf(data=german_empire_1871,aes(color="1871"),key_glyph = draw_key_rect)+
  geom_sf(data=german_empire_1945,aes(color="1945"),key_glyph = draw_key_rect)+
  geom_sf(data=germany_1989,aes(color="1989"),key_glyph = draw_key_rect)+
  geom_sf(data=germany_89_berlin,aes(fill=GEN),color="#B8860B")+
  ggtext::geom_textbox(data=text,inherit.aes = F,
                       x=100000,y=-850000,
                       aes(label=text),
                       width = unit(1, "npc"),
                       lineheight=0.45,
                       size=5.1)+
  coord_sf(crs = 'EPSG:3068',clip = "off") +
  scale_color_manual(name = "Year",
                    values = c("#536878", "#8B4513","#B8860B")) +
  scale_fill_manual(name = "Berlin",
                  values = c("#CD5C5C","#4682B4")) +
  labs(title="Germany Through Time:",
  subtitle="A Retro Cartographic Journey of Shifting Borders (1871-1989)",
       caption = "#30DayMapChallenge 2023 Day 11 - Retro\nDataSource: Censusmosaic - Historical-gis-files | Map: @fgazzelloni") +
  theme(text=element_text(color="#2F4F4F",size=24),
        plot.title = element_text(size=16),
        plot.caption = element_text(hjust = 0.5,vjust = 1,
                                    face="bold",
                                    size=12,
                                    lineheight = 0.5),
        plot.background = element_rect(color="#FDF5E6",fill="#FDF5E6"),
        panel.background = element_rect(color="#FDF5E6",fill="#FDF5E6"))+
  ggspatial::annotation_scale()
showtext_end()ggsave("~/Documents/R/R_general_resources/EDA_and_maps/30DayMapChallenge/2023/day11_retro/day11_retro.png",
dpi = 220,
width = 7,
height = 6.7)