Unlocking the Power of Data Visualization with R
  • TidyTuesday
  • ChartChallenges
  • MapChallenges
  • DuBoisChallenge
  • About
    • Who I am
    • How to contribute
    • Contacts
Categories
All (30)

30DayMapChallenge 2022

Remix
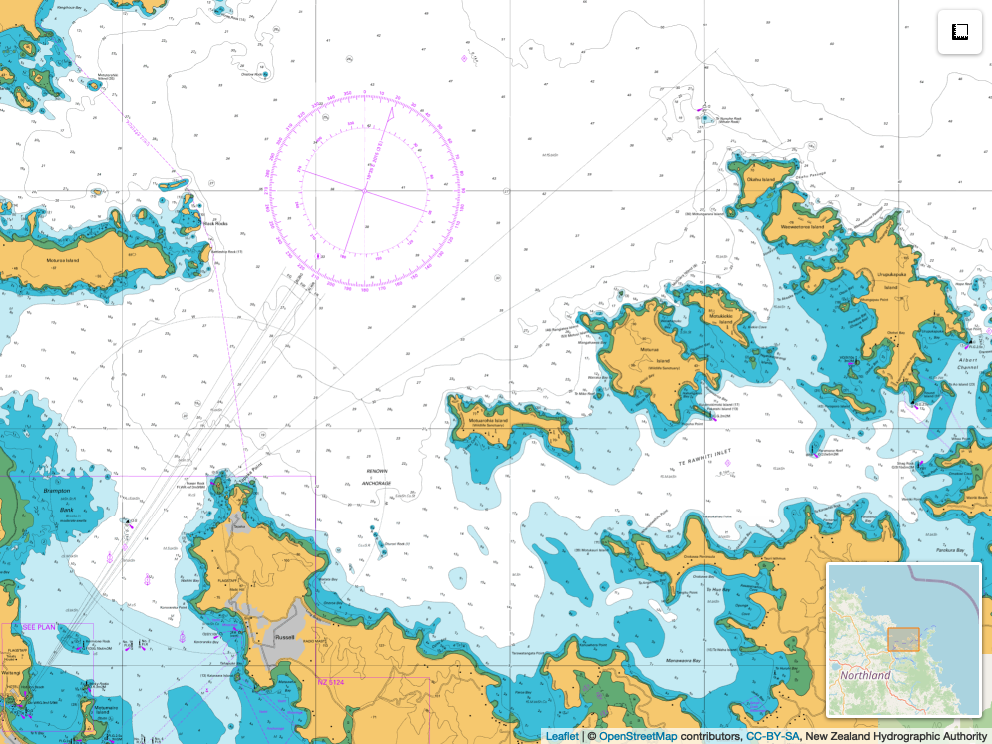
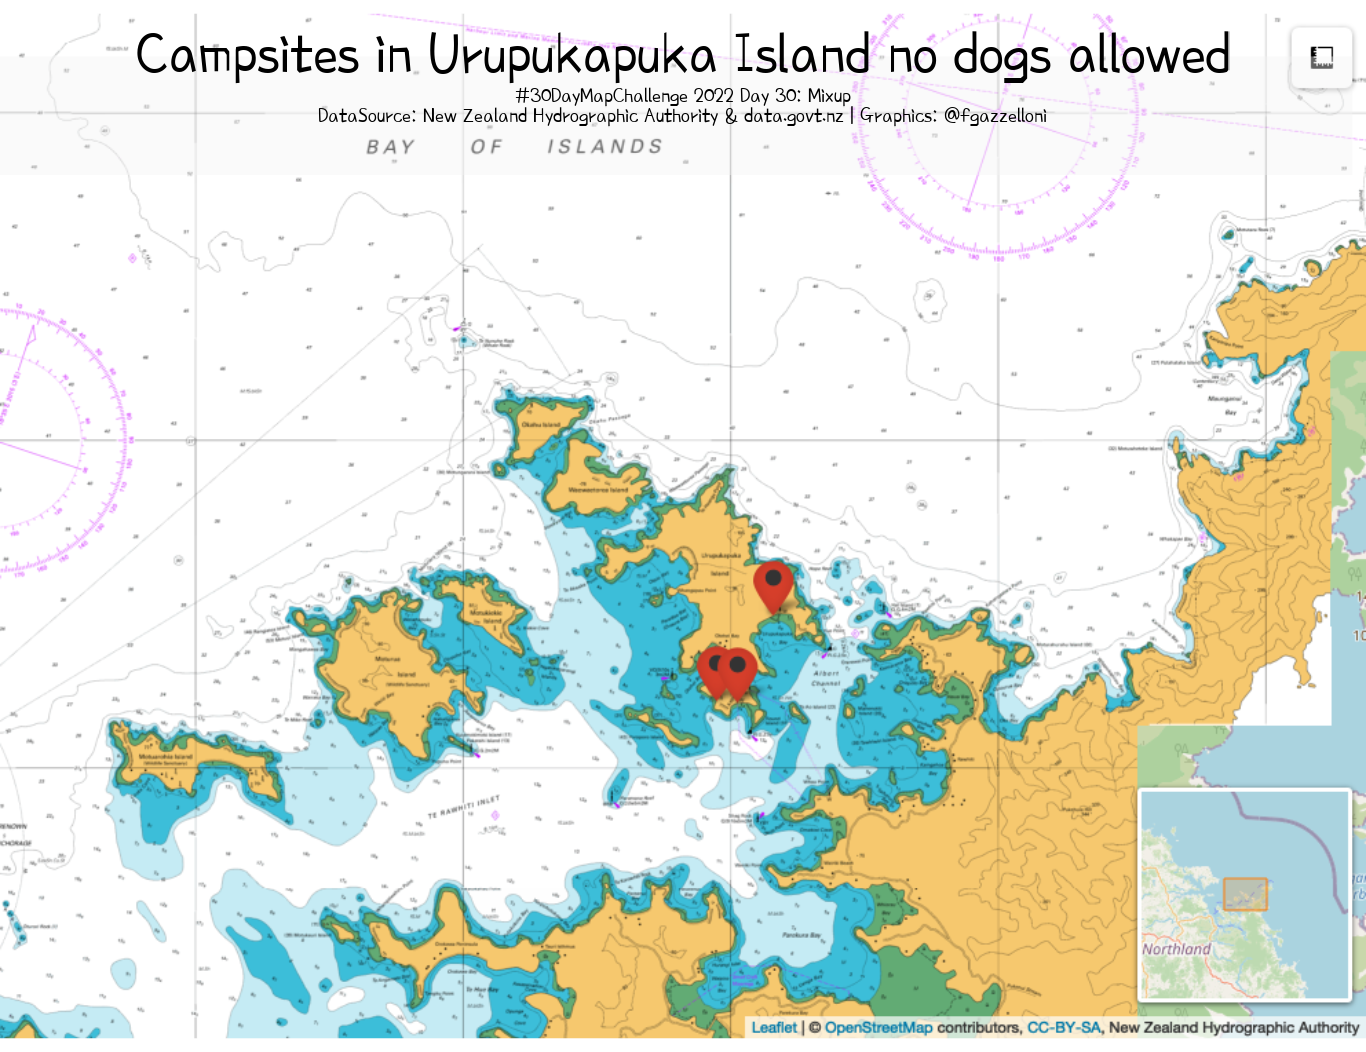
Improving map Islands (day 26) with Campsites in Urupukapuka Island no dogs allowed. Data is from the New Zealand Hydrographic Authority & data.govt.nz.
Nov 30, 2022

Out of my comfort zone
Foursquare Map Month Competition Winner: United States Permanent amount of precipitations on Global Railways.
Nov 29, 2022

3d
Map of Oregon Population Density. Data is from Kontur population US and the {tigris} package.
Nov 28, 2022

Music
US Map of Artists by states distribution. Data is from TidyTuesday 2022 week 39 US Artists.
Nov 27, 2022

Islands
A static leaflet map of Islands, data is from the New Zealand Hydrographic Authority.
Nov 26, 2022

Colour Friday: 2 Colors
This map of Alaska housing is made with FourSquare Studio.
Nov 25, 2022

Fantasy
Astonishing World Map projection: projection_bonne. Data is from the {rnaturalearth} package.
Nov 24, 2022

Movement
Map of the Movements to Europe through the Mediterranean and Western Balkans migration routes, 2017 flows: Italy overview. DataSource: @humdata.
Nov 23, 2022

Null
This is the Happy Planet Index - World Map, data is from the {tmap} package.
Nov 22, 2022

Data: Kontur Population Dataset
This is a map of Costa Rica Population density, data is from Kontur Population dataset - @KonturInc.
Nov 21, 2022

My favourite
This is my favorite Dubois data portraits. Data is from TidyTuesday 2022 week 6, Tuskegee Airmen: Aerial Victories Air Force Historical Research Agency Graduation 1942 - 1948.
Nov 20, 2022

Globe
{rnaturalearth} for making this Globe Map.
Nov 19, 2022

Colour Friday: Blue
This a map of Milan, Italy with religious locations. Data is from the {osmdata} package.
Nov 18, 2022

A Map Without Computer
This is a self standing Ocean World Globe.
Nov 17, 2022

Minimal
Hexagon map of Boston housing, data is from spData::boston.c. It shows the median values of owner-occupied housing in USD 1000.
Nov 16, 2022

Food / Drink
Map of European Countries Foodborne Campylobacter Outbreaks, data is from www.efsa.europa.eu
Nov 15, 2022

Hexagons
Hexagons to style a US map of Covid19 cases, data is from the CDC and the {tidycensus} package.
Nov 14, 2022

5 Minute Map
A World map made with data from the {ggplot2} package.
Nov 13, 2022
No matching items
  • 1
  • 2
30DayMapChallenge 2021
30DayMapChallenge 2023

Copyright © 2024 Federica Gazzelloni

  • Edit this page
  • Report an issue
Cookie Preferences

Terms & Conditions