
Chapter 2 Academic Programs, Courses, and Pathways
2.0.0.0.1 The ATE program supports the creation and improvement of academic programs that lead to “an appropriate associate degree or specific occupational competency or certification” (National Science Foundation (NSF), 2018, p. 5). Examples of funded activities include creating new degree or certificate programs or courses; modifying the content, instructional strategies, or delivery modes of existing programs and courses; enhancing programs through the acquisition of instruments or equipment for use in instruction; and developing educational pathways (including articulation agreements) that facilitate students’ movement across education levels.
2.1 Academic Program Development
2.1.0.1 Twenty-two percent of ATE projects created or substantially modified an academic program.
The Committee on Science, Technology, Engineering, and Math Education’s 2013 strategic plan called for graduating “one million additional students with degrees in STEM fields over the next 10 years” (p. 10) and increasing the number of two-year colleges with “effective STEM programs” (p. 30) (Committee on STEM Education, National Science and Technology Council, 2013). One of the ways that ATE responds to this call is through the development of new STEM academic programs. ATE PIs were asked to identify the degree or certificate programs that their projects created or improved with ATE funding, and characteristics of students served by those programs.
A total of 130 academic degree programs were developed or substantially modified by 70 ATE projects in 2020. Most of these programs awarded certificates (50%) or associate degrees (41%). Four programs awarded bachelor’s degrees, and 7 programs provided other types of credentials. Over 10,470 students attended at least one course in these academic programs, with a total of 900 completing a program in 2020; 400 students completed an associate degree program, while 370 students completed a certificate program. Programs with students completing certifications or degrees in 2020 graduated an average of 20 students.

The Committee on STEM Education’s 2018 report noted the persistence of labor shortages in STEM fields and underscored the importance of increasing diversity, equity, and inclusion in STEM (Committee on STEM Education, National Science and Technology Council, 2018). NSF (2019) has determined that women, persons with disabilities, and three racial and ethnic groups—Blacks, Hispanics, and American Indians or Alaskan Natives—are underrepresented in science and engineering (National Science Foundation (NSF), 2019).
2.1.0.1.1 Fifty-five ATE projects out of the 70 that developed academic degree programs emphasized recruitment of at least one of the following types of students.
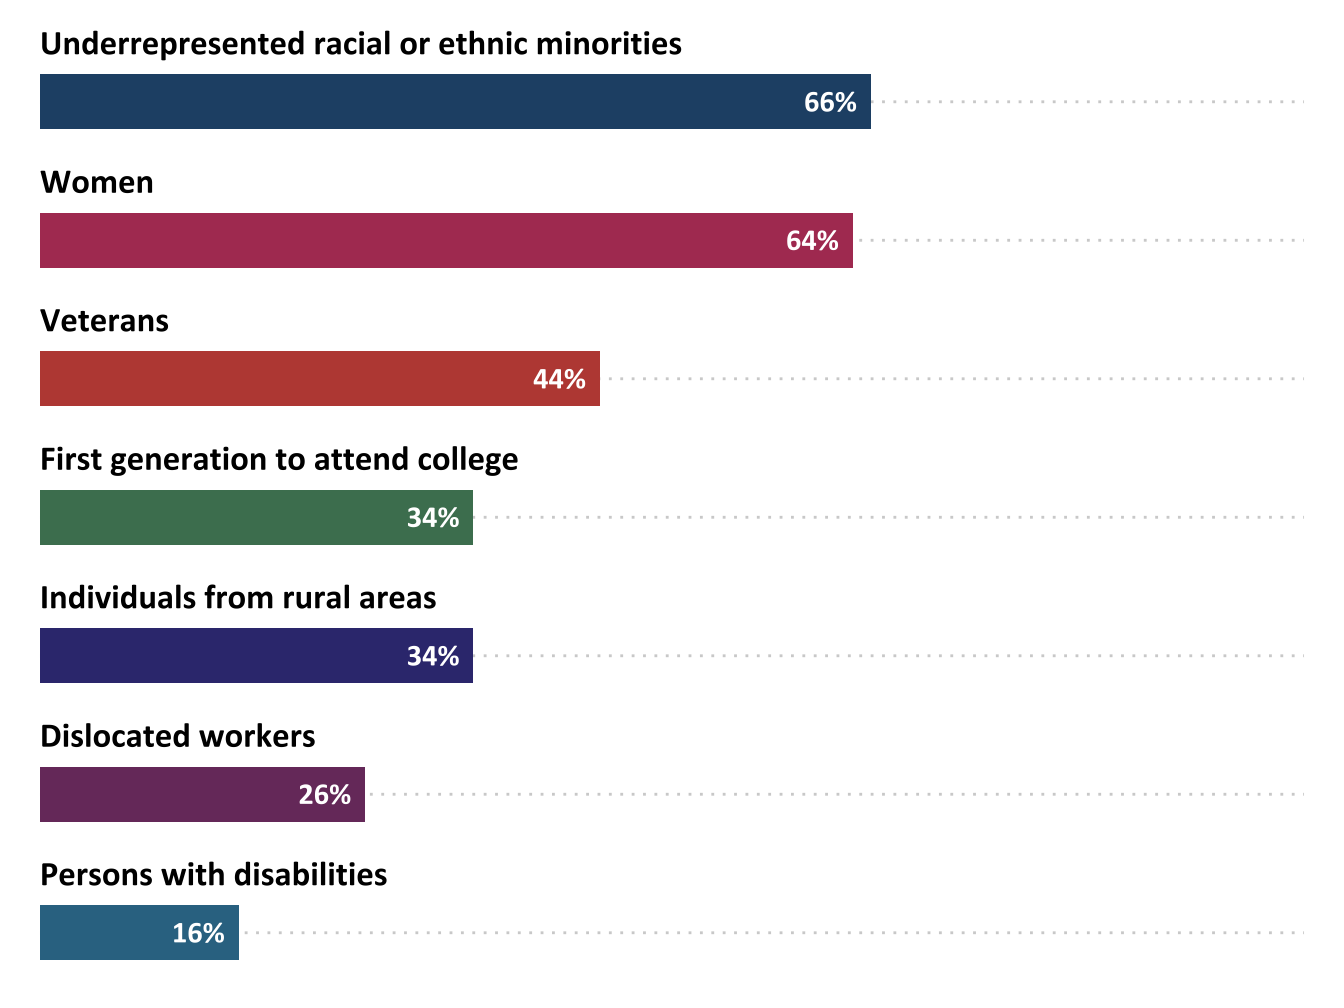
Figure 2.1: Percentage of projects that emphasized recruitment of students from specific demographic groups (n=70)
2.2 Students Served by ATE Academic Programs
2.2.0.1 Students from groups that have been historically underrepresented in STEM have similar rates of participation in the ATE program.
Of the 130 academic programs that were developed or modified by ATE projects in 2020, 80 programs (63%) reported student characteristics. Due to this low response rate, the numbers reported here do not represent the entire ATE program, nor all 70 ATE projects that created or substantially modified academic programs in 2020.i
The gender breakdown in ATE-supported programs is similar to what is observed in STEM programs nationally. Overall, 26% of ATE students are women, although the proportion of women varies by education level and discipline. According to the U.S. Department of Education, 21% of students in technical programs at two-year colleges in the U.S. are women.ii
2.2.0.1.1 Like other STEM programs, ATE projects still face a challenge in attracting women to the field.
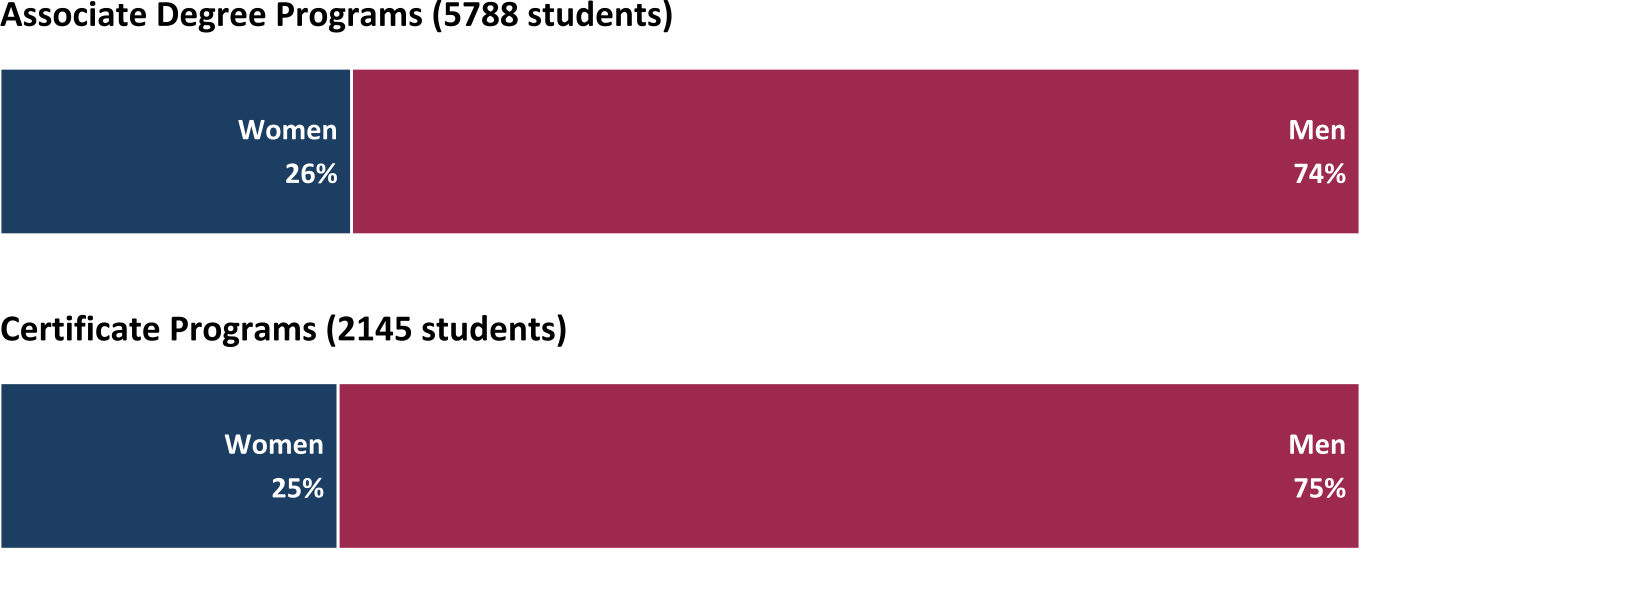
Figure 2.2: Percentage of women and men in ATE-supported academic programs by degree level (n=70)
Students who identify as Black / African American or Hispanic / Latino or Latina have slightly higher representation in ATE- supported programs than they do in the general population of students across educational degrees. (See the technical notes for a full explanation of comparison sources for national data.iii)
2.2.0.1.2 The percentage of students who identify as Black / African American and Hispanic / Latino or Latina or Latina in the ATE program mimics national trends.
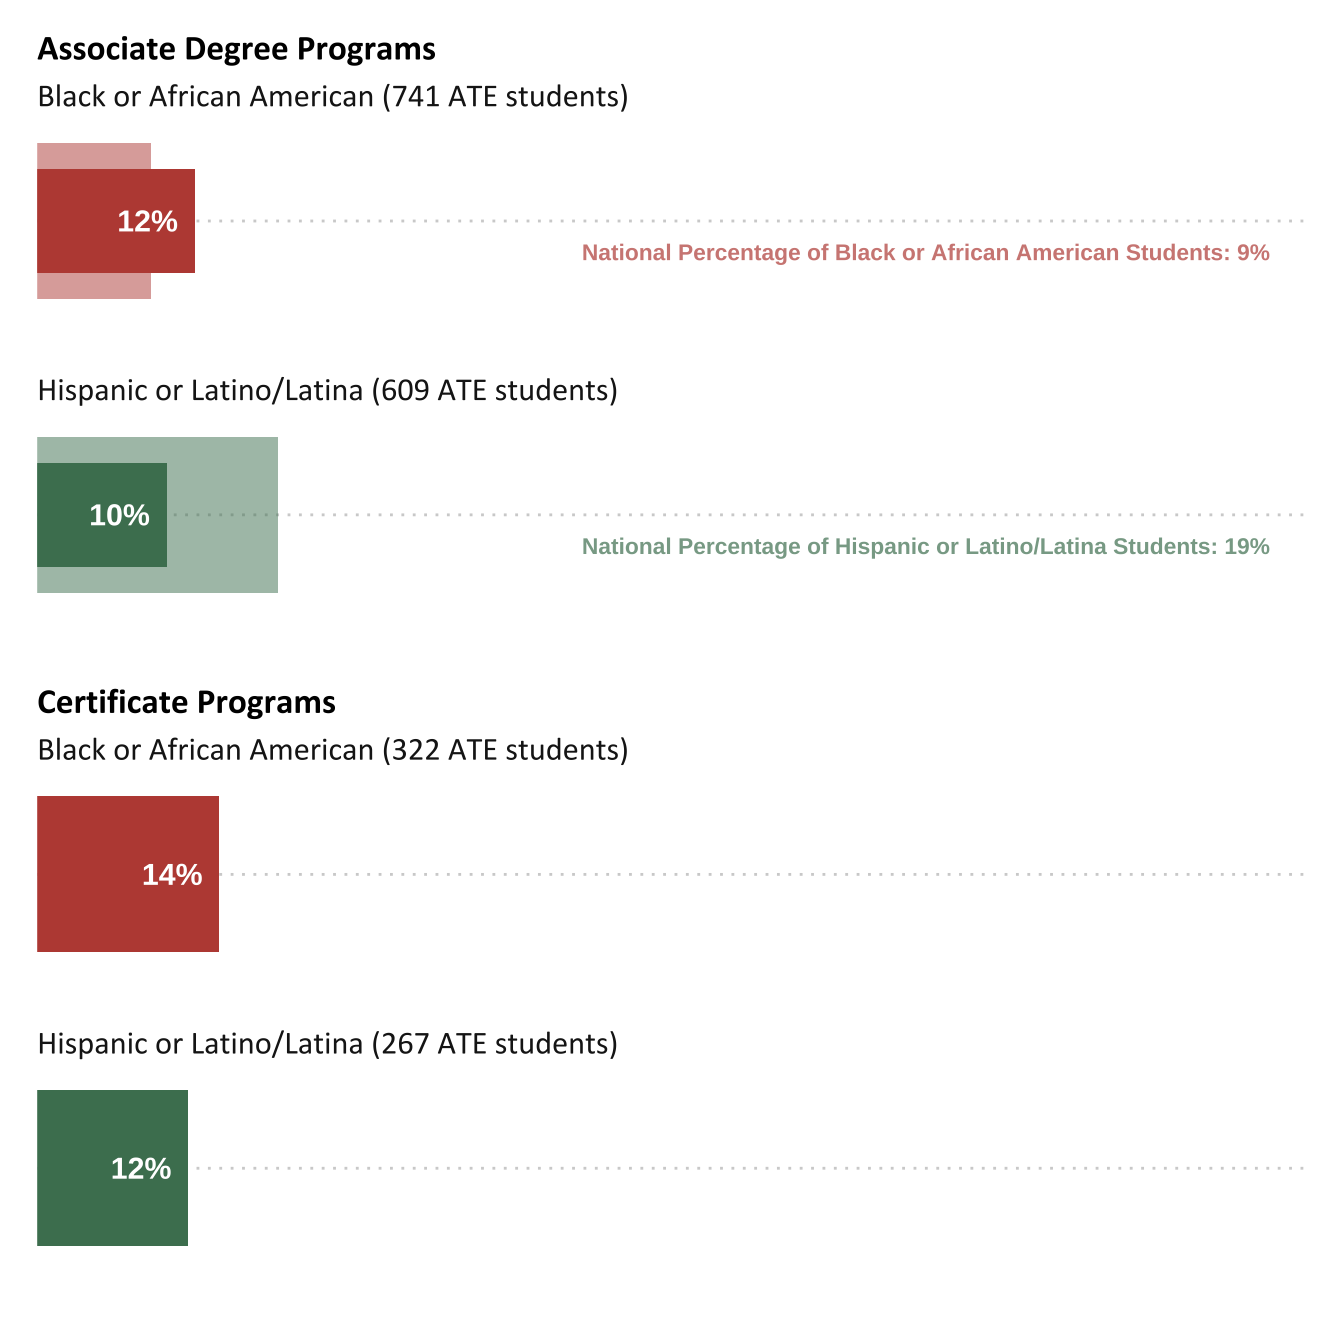
Figure 2.3: Percentage of students from underrepresented racial and ethnic minority groups in ATE-supported academic programs, compared with national rates (n=70)
2.3 Course Development
2.3.0.1 Twenty-seven percent of ATE projects created or modified at least one academic course.
ATE PIs whose projects engaged in creating or substantially modifying academic courses were asked to identify the number and types of courses they created or modified, the academic levels of these courses, their primary delivery modes, and how many students enrolled in the courses. Some ATE projects engaged in course development as part of a larger initiative to develop or modify an entire degree or certificate program; others did so as a stand-alone effort.
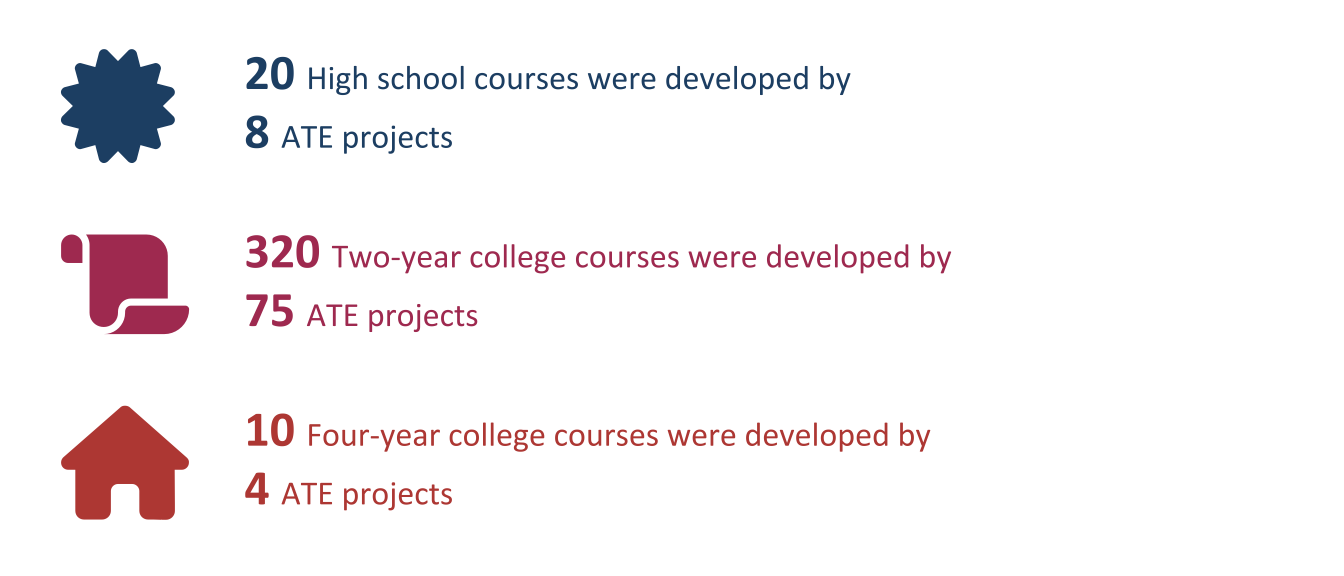
2.3.0.1.1 A total of 360 courses were developed by 85 projects in 2020. The majority of these courses (88%) were for two-year college students.
2.3.0.1.2 Sixty-nine percent of these 360 courses were offered in 2020.

ATE PIs were asked about the primary delivery modes for each of the courses they developed or modified. Compared to 2019, more ATE courses are being developed for a hybrid format.
2.3.0.1.3 Most ATE courses were designed for a hybrid of online and face-to-face delivery, as compared with exclusively online or face-to-face.
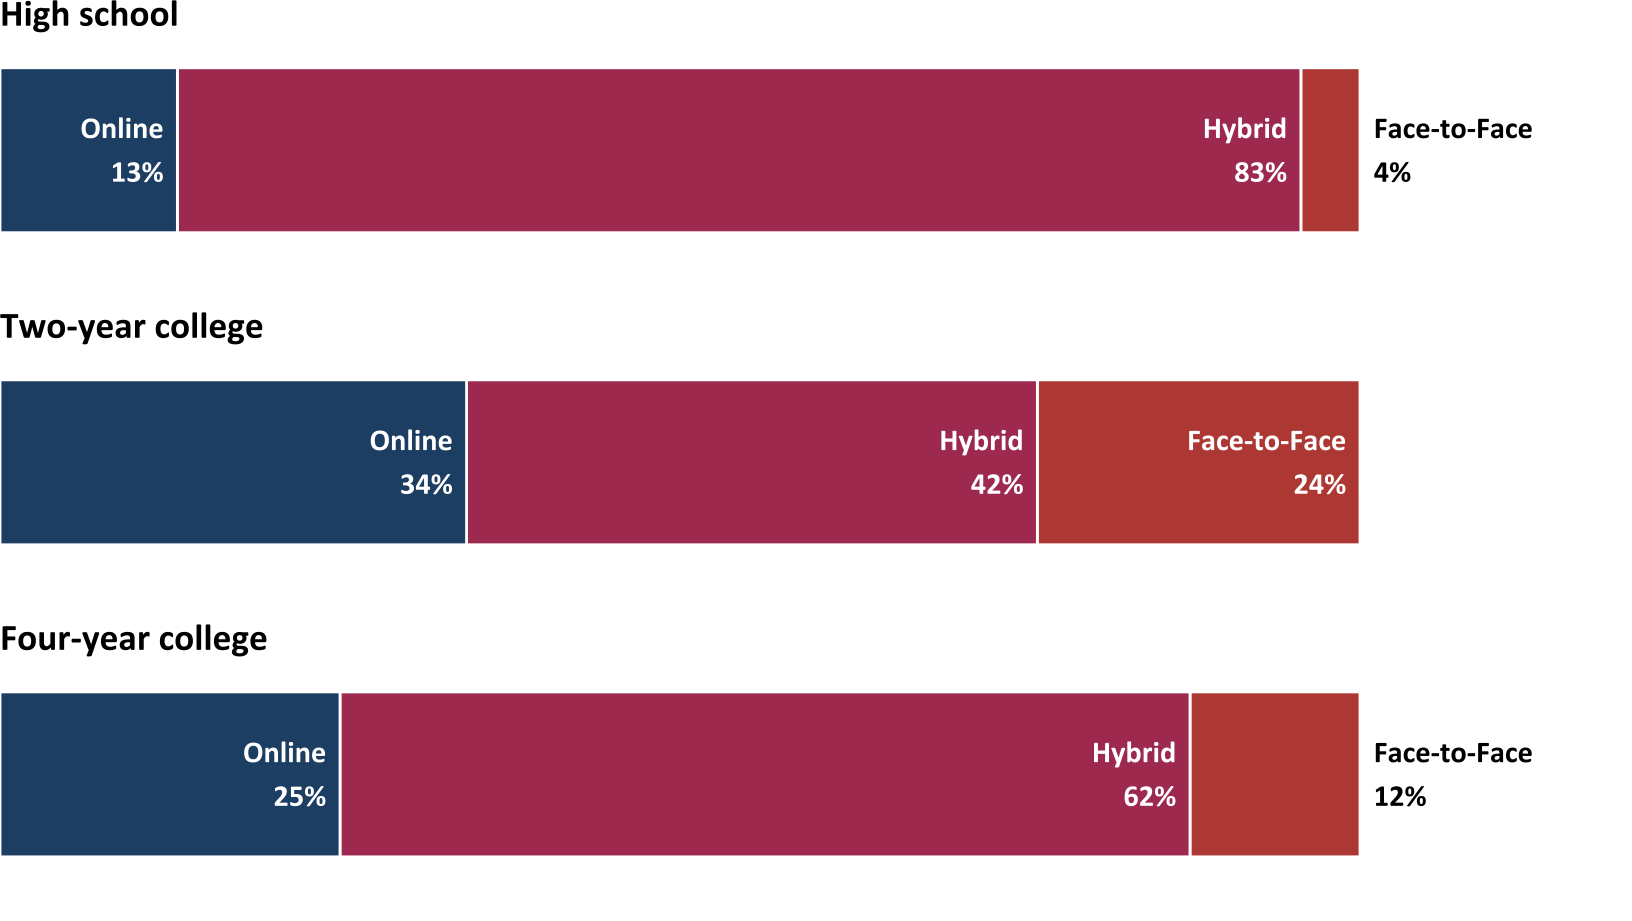
Figure 2.4: Percent of courses designed by differing delivery mode, by education level
2.4 Instrument Acquisition
2.4.0.1 Twenty-seven percent of ATE projects acquired instruments or equipment to prepare students for work in business and industry.
Using state-of-the-art equipment contributes to the development of technical skills students will need for employment. Hands-on experience with such equipment has also been shown to contribute to students’ self-efficacy and positively impact their longer-term career and educational goals (Amelink et al., 2015). The ATE program includes a funding stream to help grantees obtain instruments or equipment that can be used in instruction to prepare students for employment in business and industry.
Eighty-six ATE projects acquired instrumentation or equipment in 2020. Examples of instruments purchased and utilized by projects include 3D printers, computers, drones, virtual reality viewers, laser engravers, and laboratory equipment. Seventy-six projects reported the amounts they spent on instrumentation or equipment. Projects spent between $115 and $330,770 on instrument acquisition in 2020.
2.4.0.1.1 A majority of projects spent less than 25% of their grant funds on instrumentation in 2020.
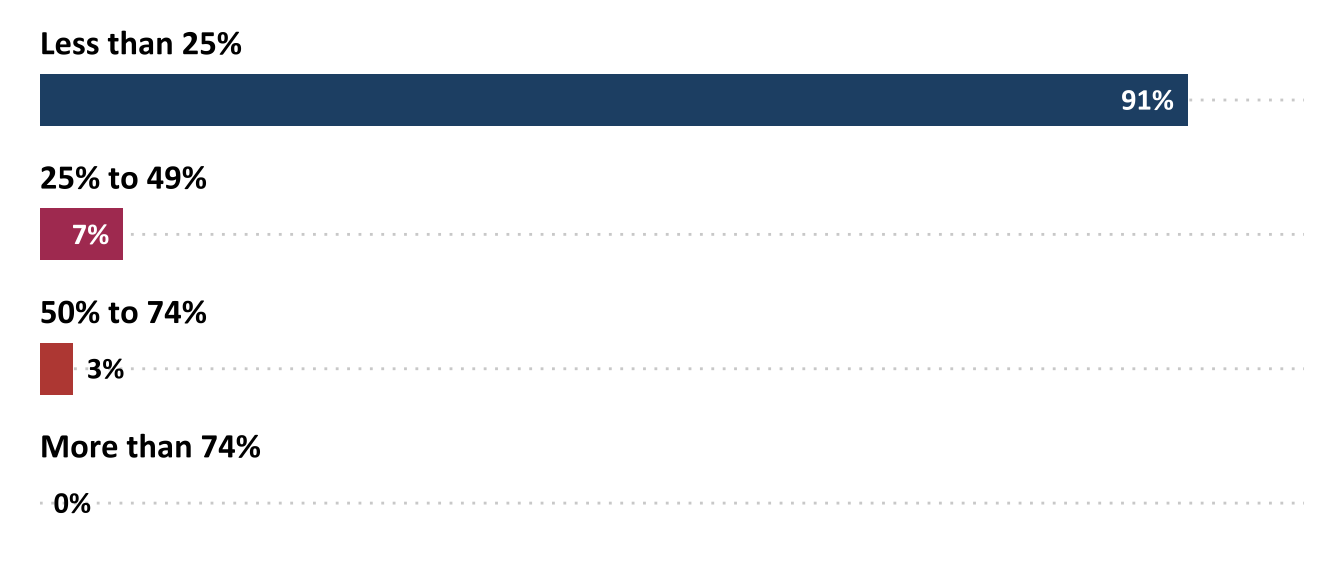
Figure 2.5: Percentage of total grant amount spent on instrumentation or equipment in 2020 (n=76)
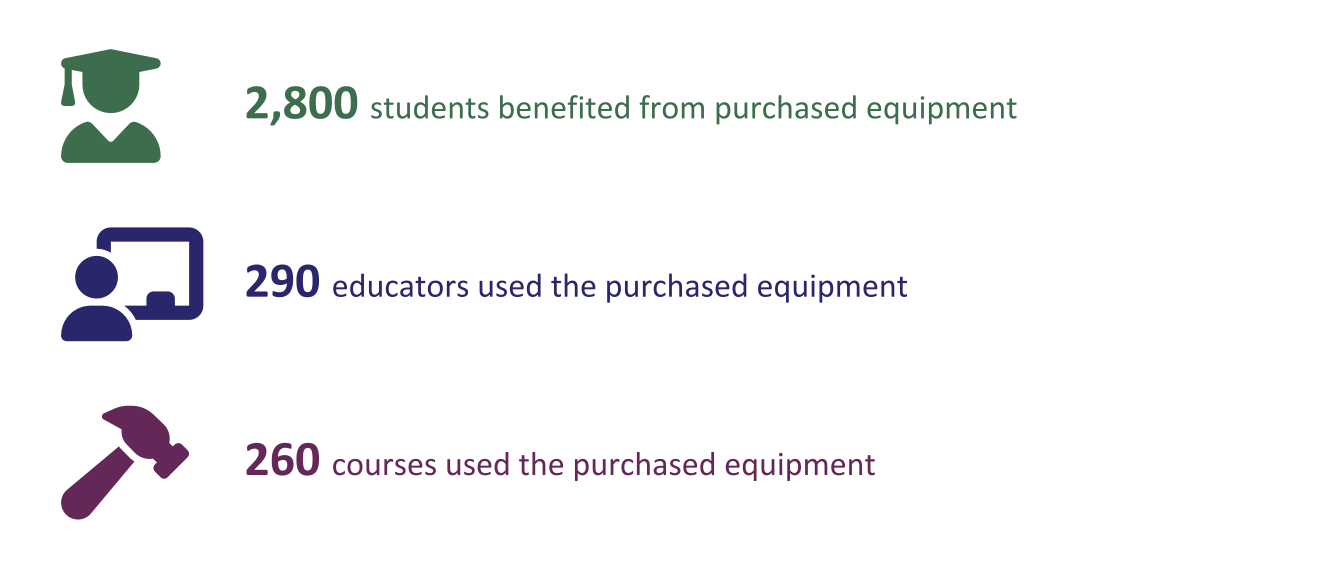
Projects that use ATE funding to purchase instruments or equipment are expected to revise their academic programming to maximize the value of the items for student learning. In 2020, 2,800 students used instruments and equipment.
2.4.0.1.2 A median of 13 students used the equipment or instrumentation acquired by each ATE project.
Seventy-three projects reported acquiring instrumentation, equipment, or tools to give students hands-on experience with instruments used in the field. Seven projects reported acquiring instruments to allow students to perform technical tasks in a simulated environment, and 6 projects noted other reasons, such as enabling students with disabilities to perform certain technical tasks and allowing remote students to participate in a virtual summer camp or mobile lab.
2.5 Articulation Agreements
2.5.0.1 Sixteen percent of ATE projects created or maintained articulation agreements.
Articulation agreements are formal agreements between educational institutions that provide students from secondary schools with pathways and education access to two-year colleges and four-year colleges. These agreements contribute to increasing the number and diversity of scientists, engineers, and technicians (National Academy of Engineering and National Research Council, 2012).
In 1992, Congress saw the importance of these agreements and required their use in NSF’s ATE program. The current ATE solicitation calls for “developing life-long career and educational pathways for technicians to support the changing workplace” (National Science Foundation (NSF), 2018, p. 5).
Fifty projects developed or maintained articulation agreements in 2020. Note that one project was responsible for a 95-percent drop in the number of articulation agreements in place between 2019 (11,532) and 2020 (517).
2.5.0.1.1 Most articulation agreements created in 2020 were between high schools and two-year colleges, but more students matriculated between two-year and four-year colleges.
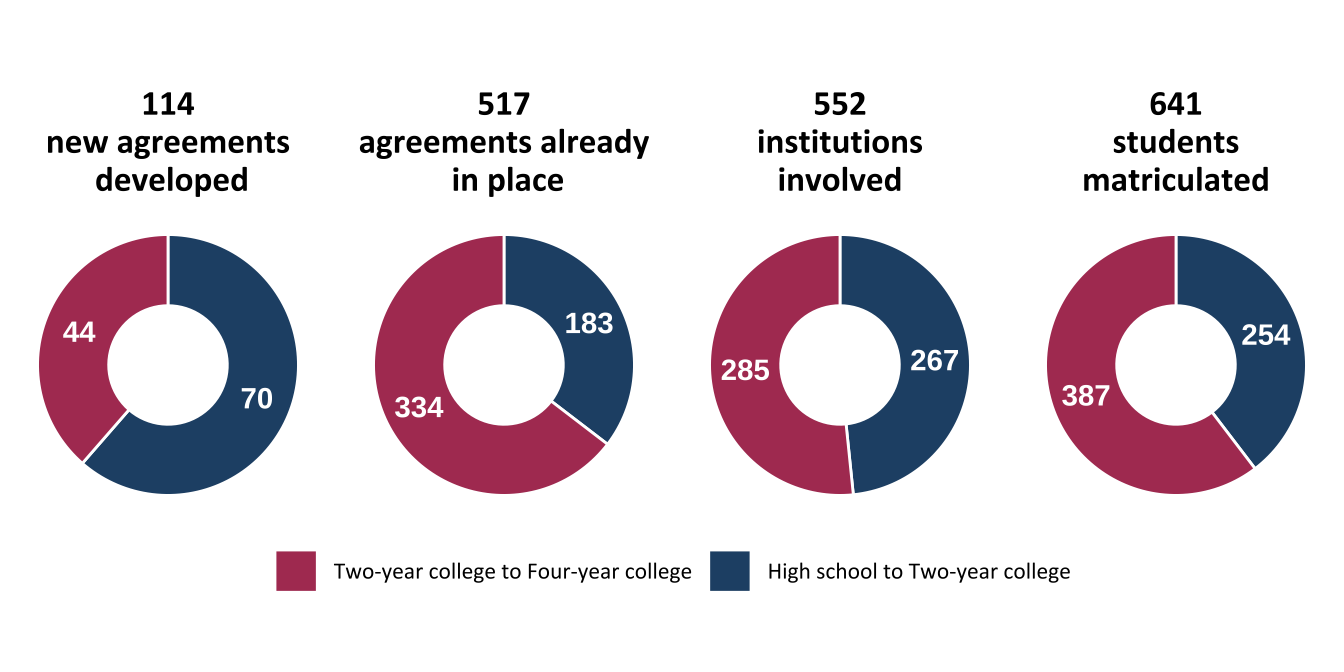
Figure 2.6: Number of articulation agreements, institutions, and students (n=50)