Field Lab 6: Design a camera trap study in Serengeti National Park.
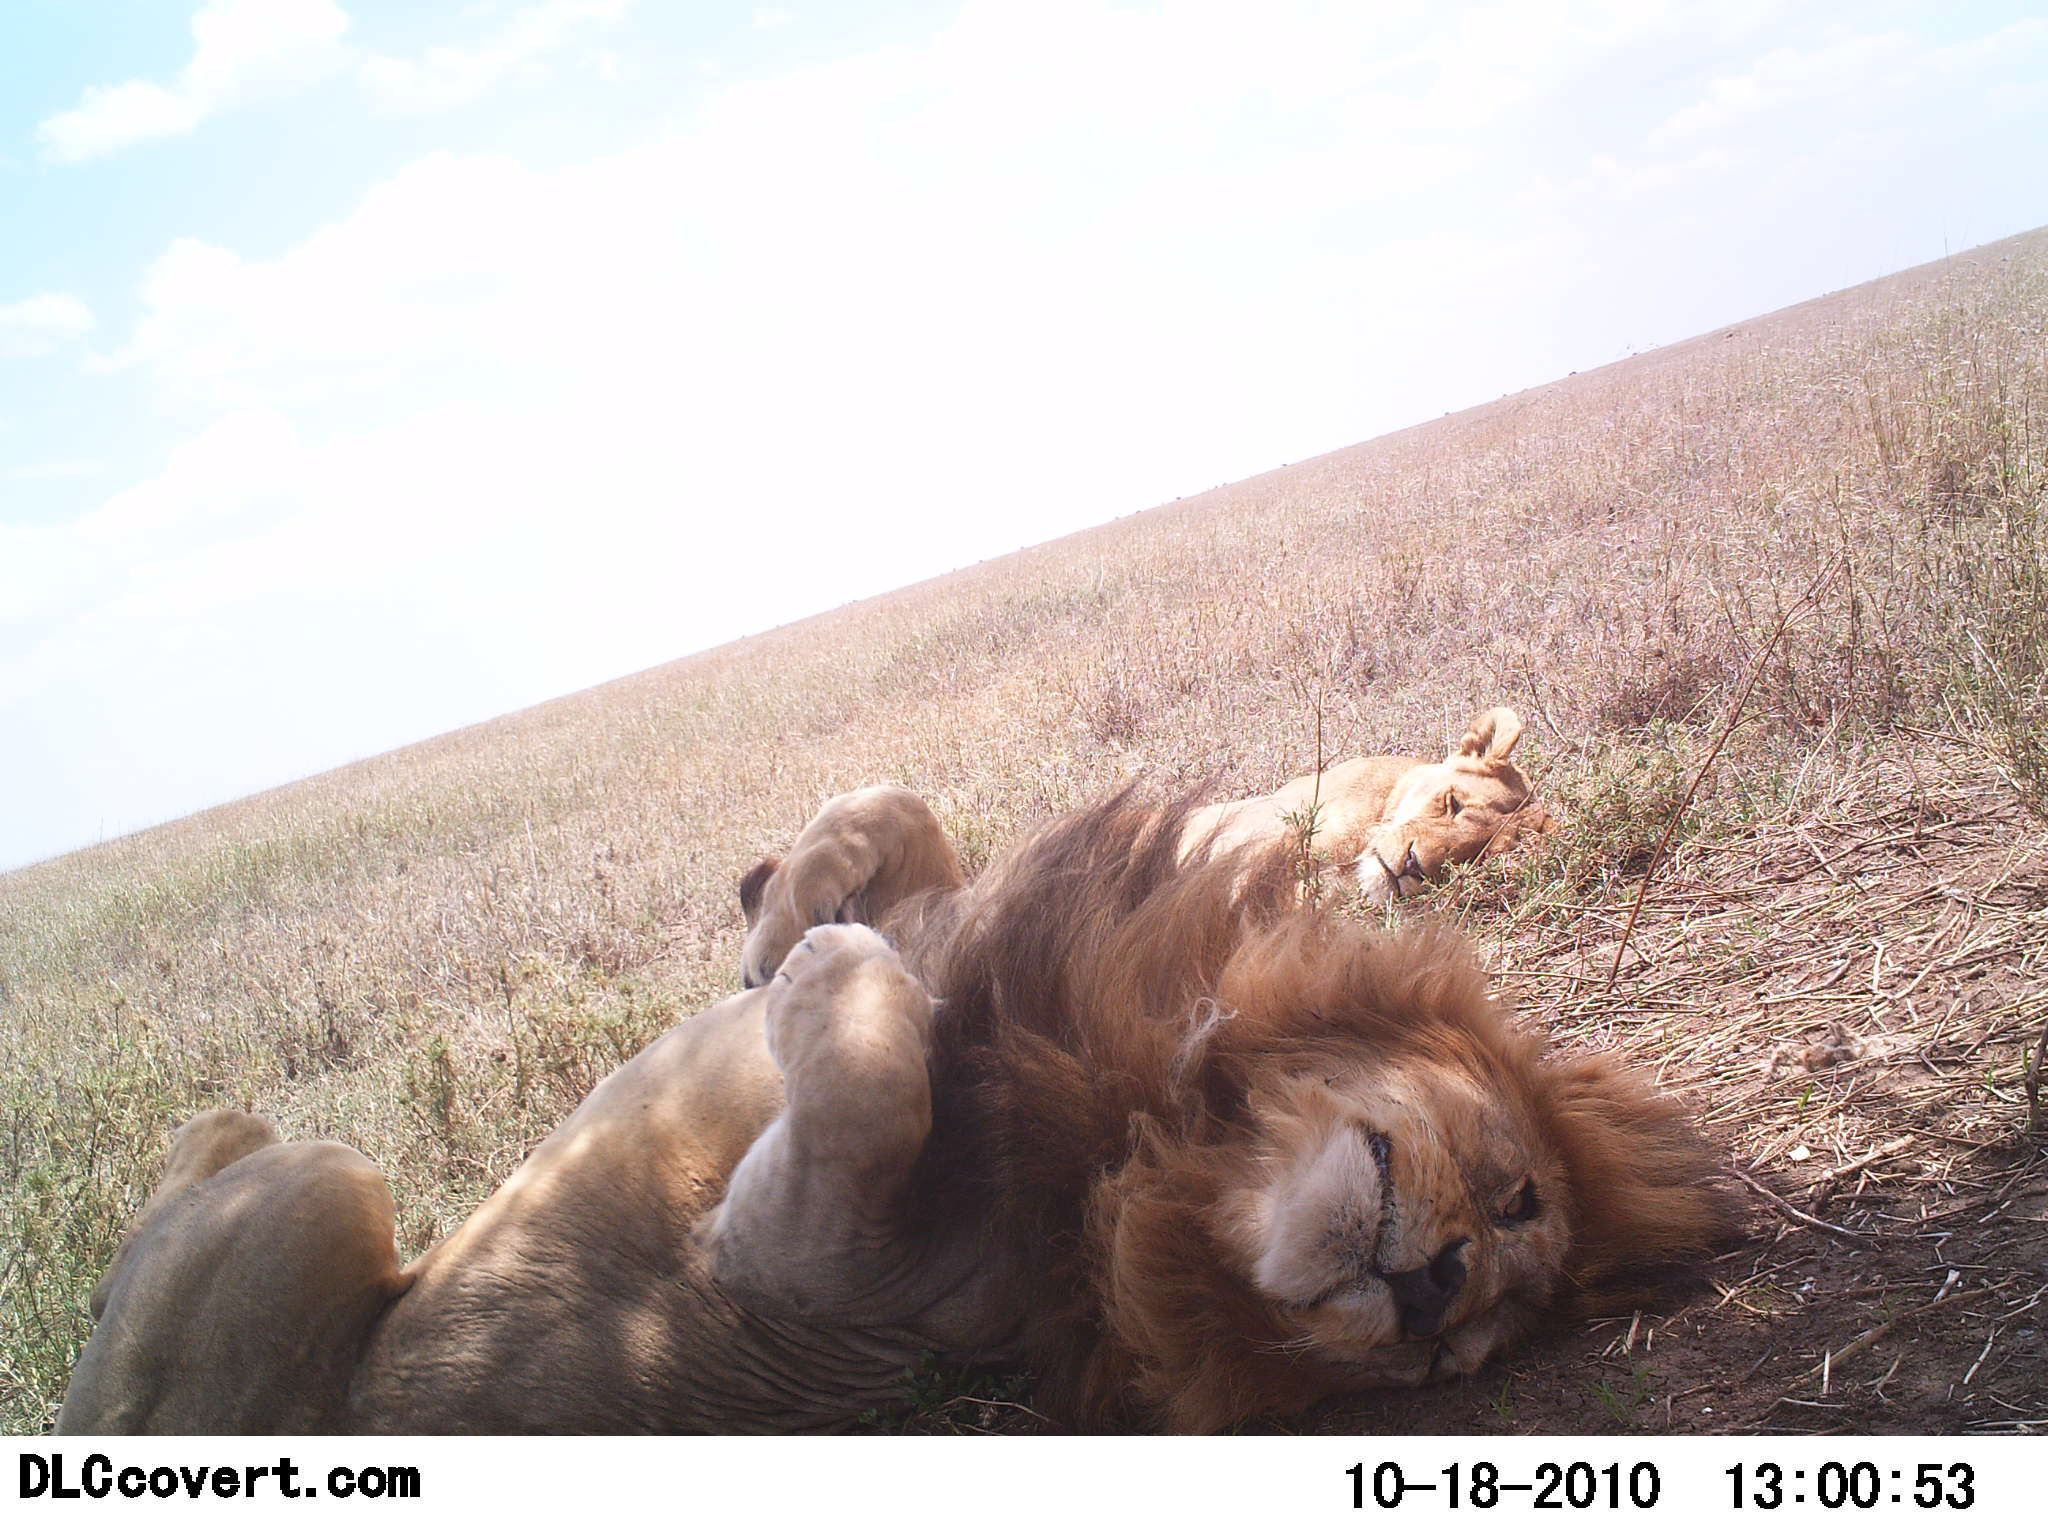
Figure 12: Image from the Snapshot Serengeti image database (http://lila.science/datasets/snapshot-serengeti)
Part 1. Background
The camera trap data that we will use for this field lab comes from the ‘Snapshot Serengeti’ project (http://lila.science/datasets/snapshot-serengeti ). The scientists set out out 225 cameras within a 1,125 km2 area (see map to the right). The cameras have been deployed continuously since 2010, and they recruited citizen scientists to help with classifying images (https://www.zooniverse.org/projects/zooniverse/snapshot-serengeti ).
Part 2. Data format and size
The camera trap photos along with the annotations (i.e. image classifications) are available for anyone to access. The original dataset includes over 2.65M sequences of camera trap images (totaling 7.1M images) from ten field seasons. As you can imagine that is a lot of data! For this lab we will focus on data collected over the course of three seasons. I have done a substantial amount of preprocessing the data so that you can access it for this lab. The table below includes the number of images available for each of the species. Note that annotations are tied to images, but are only reliable at the sequence level. For example, there are some sequences in which two of three images contain a lion, but the third is empty (lions, it turns out, walk away sometimes), but all three images would be annotated as “lion”. In the R code to download the photos it will pull out only the first photo in the sequence, but the table below includes all of the photographs in the sequence, so the actual sample size may vary slightly.
Part 3. Temporal niche separation using camera trap data
For this lab you are going to choose two animals from the camera trap dataset. It could be a pair of animals that are predator and prey or two potential competitors. Once you decide on the two animals you want to compare you will make some predictions about how you think they will differ in their activity patterns. You should choose different animals from your partner (so please check with them first).
Question 1. What are the two species you chose to compare? What are your predictions regarding their activity patterns?
Part 4. Data collection
We will be using RStudio to access and download 50 photos of each of the two species you indicated above. See Part I of Computer Lab 6. Analyzing camera trap data for detailed instructions on how to collect your data.
Part 5. Follow-up questions
Question 2. What did you notice during data collection? Does it seem that the data were consistent with your predictions?
Question 3. For this lab we are pooling data from different locations and seasons. How could this influence our results?
Question 4. What other factors (apart from time of day) could be influencing the presence or absence of the animals in your camera trap data?
Question 5. If you were to design a followup study, what additional data would you like to collect?