Chapter 3 Measurement Invariance
Measurement invariance addresses some of the statistical implications of the TSE and “Bias” frameworks and defines conditions that have to be fulfilled before inferences can be drawn about comparative conclusions dealing with constructs or scores in cross-national/cultural studies.
Comparisons can only be made if the people in the different countries/cultures react similarly to the questions asked.
The measures should be “functionally equivalent” and the response models should be invariant across countries
3.1 What is Measurement Invariance?
Formal definition of invariance:
“whether or not, under different conditions of observing and studying phenomena, measurement operations yield measures of the same attribute” (Horn and Mcardle 1992, 117).
What implies?
Measurement invariance implies that using the same questionnaire in different groups (such as countries or at various points in time, or under different conditions) does measure the same construct in the same way (Chen 2008; Davidov et al. 2014; Horn and Mcardle 1992; Millsap 2011).
3.2 How to test for measurement invariance?
The most common method to test measurement invariance is Multi-Group Confirmatory Factor Analysis (MGCFA).
3.2.1 Confirmatory Factor Analysis
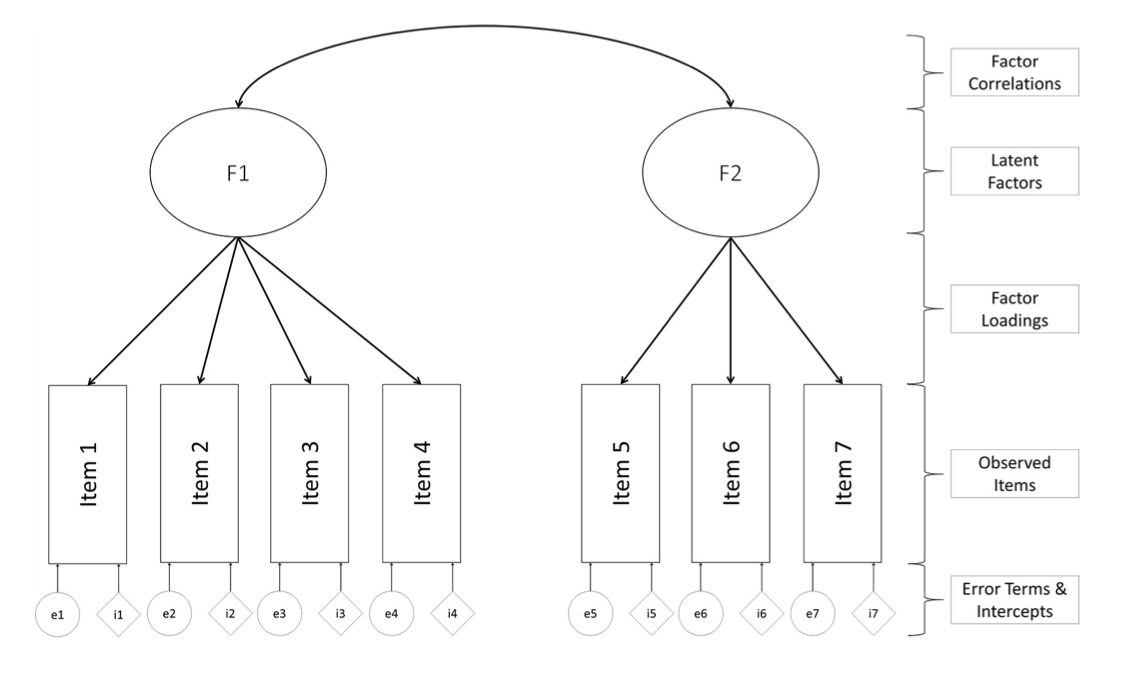
CFA focuses on modeling the relationship between manifest (i.e., observed) indicators and underlying latent variables (factors). CFA is a special case of structural equation modeling (SEM) in which relationships among latent variables are modeled as covariances/correlations rather than as structural relationships (i.e., regressions). CFA can also be distinguished from exploratory factor analysis (EFA) in that CFA requires researchers to explicitly specify all characteristics of the hypothesized measurement model (e.g., the number of factors, pattern of indicator- factor relationships) to be examined whereas EFA is more data-driven.

Figure 3.1: Source: Fischer and Karl (2019)
For more information about confirmatory factor analysis see Brown (2015).
3.2.2 Multi-Group Confirmatory Factor Analysis - MGCFA
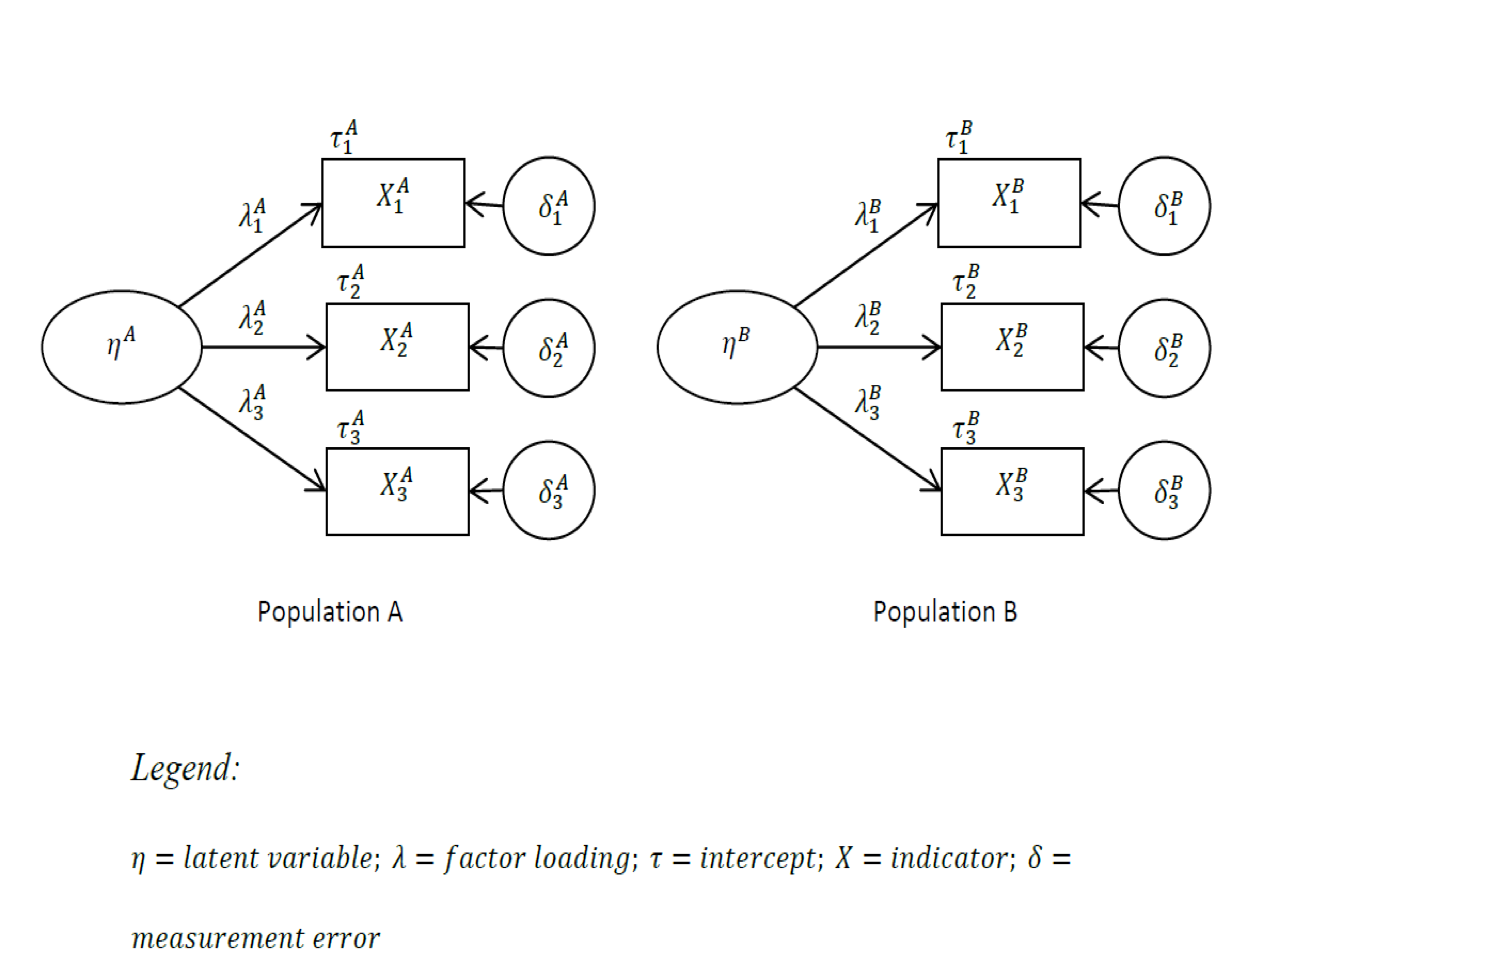
With a single model tests whether a theoretical model fits several groups simultaneously
How? Because we constrain parameters to be equal across groups
MGCFA invariance testing model in practice is testing an hypothesis of whether a given theoretical model fits well to the data across the groups.
Depending on what parameters we constraint to be equal across groups, we test one or another level of invariance

Figure 3.2: Multi-Group Confirmatory Factor Analysis Model
3.3 Invariance Testing Levels
Most research focus on 3 levels of measurement invariance:
Configural Invariance (structural equivalence): the same model holds for all the groups
Metric Invariance (measurement unit equivalence): factor loadings (slopes) are the same across the groups
Implication: The scale intervals are the same across groups because the loadings are the same in each group. When checked, allows comparing unstandardized regression coefficients and/or covariances across groups.
- Scalar Invariance (Full score equivalence): the intercepts are the same across all countries being compared.
Implication: Latent means can be compared across groups meaningfully.
Following a bottom-up approach, each level is tested by setting cross-group constraints on parameters (loadings and intercepts) and comparing hierarchically more constrained models with less constrained ones.
At the configural level, loadings and intercepts are freely estimated.
At the metric level, loadings are constrained to be equal across groups and the intercepts are freely estimated.
The scalar invariance model is the most constrained, with both loadings and intercepts constrained to be equal across groups.
3.3.1 Response Function
The process by which a respondent arrives at an answer, that is the relationship between the respondent’s “opinion” and the final answer, is called the response function. Figure 3.3 illustrates a possible response function

Figure 3.3: Illustration of a Response Function. Source: Adapted from Wicherts & Dolan
The X axis represents the latent variable mean; the Y axis represents the response to a survey question item measuring the latent variable. The diagonal represents the functional relation between the latent variable and the (unstandardized) response to the survey question item in group G1.
Another way to thing about invariance testing is as a procedure to check whether the response functions across different groups are similar and can therefore be compared.
3.3.1.1 Example
Let’s imagine we have two groups. These groups are respondents answering the same survey questions in two different countries: Group 1 and Group 2.

Figure 3.4: Source: Wicherts & Dolan, 2010
Figure 3.4 describes a configural invariance scenario. Both the factor loadings and intercepts are different across the groups, as is made clear by the different slopes and Y axis intersections for G1 and G2. Therefore, metric and scalar invariance do not hold in these groups and shouldn’t be compared.

Figure 3.5: Source: Wicherts & Dolan, 2010
Figure 3.5 describes metric invariance and scalar noninvariance. The slopes are identical and therefore we can assume the factor loadings are the same across the groups.

Figure 3.6: Source: Wicherts & Dolan, 2010
Finally, figure 3.6 shows that the loadings are the same across the groups (similar slopes) and that the intercepts are approximately also the same.
3.4 How to handle Noninvariance
It is not uncommon to have noninvariance across groups. The literature shows several examples of scales that fail to be comparable across groups. Some examples:
Alemán and Woods (2016) and SOKOLOV (2018) recently showed that the Inglehart value scales are not comparable across all countries (but see Welzel and Inglehart (2016)); Ariely and Davidov (2011) found that public support for democracy cannot be compared across countries in the World Value Survey (WVS); Lomazzi (2017) demonstrated that gender-role attitudes are not comparable across all WVS countries; Davidov, Schmidt, and Schwartz (2008) showed that means of human values in the ESS may not be compared across all countries; Rudnev et al. (2018) found that the means of Seeman’s alienation scale are not comparable cross-nationally. (Cieciuch et al. 2019)
Several theoretical and more technical procedures have been discussed to overcome a potential noninvariant result.
Figure 3.7 compiles a great part of this discussion and can be used as a decision tree when necessary.

Figure 3.7: Source: Cieciuch et al. (2019)
3.4.1 Partial Invariance Testing
Some authors consider that partial invariance is enough of a requisite for comparisons across groups to be made (Byrne, Shavelson, and Muthén 1989; Steenkamp and Baumgartner 1998).
Partial invariance is established when the parameters of at least two indicators are equal across groups.
This means to identify those items that are very different across groups and release them while making sure that at least two items per latent concept have equal loadings and intercepts.
While this approach has been frequently used, there are also some critics that see it as not enough to assure meaningful comparisons (De Beuckelaer and Swinnen 2011; Steinmetz 2018).
3.4.2 Alternative Measurement Invariance Testing procedures
3.4.2.1 Exact Invariance testing alternative approaches to MGCFA
Multi-indicator Multiple Cause (MIMIC)
- MIMIC model permits both categorical and continuous individual difference variables (e.g., sex and age) but permits only a subset of the model parameters to vary as a function of these characteristic
See (Kim, Yoon, and Lee 2012)
Item Response Theory (IRT) Differential Item Functioning
- Aimed to categorical data
See (Tay, Meade, and Cao 2015)
3.4.2.2 Approximate Invariance: a conceptually different approach
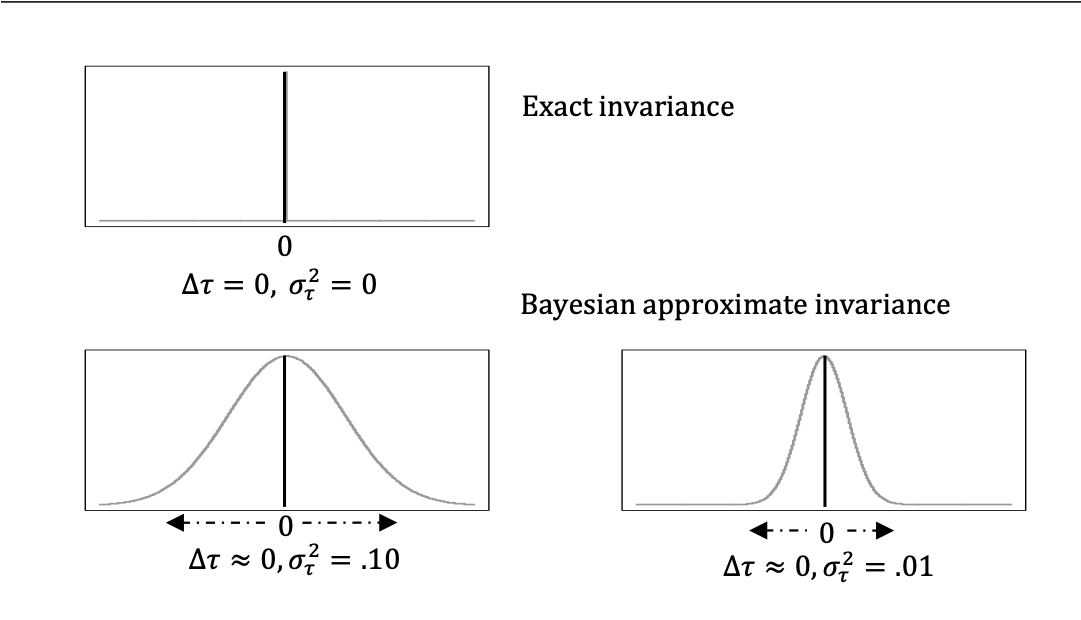
It is argued that a general measurement model using a CFA applies overly restrictive assumptions that represent a theory-driven model (Brown 2015; Marsh, Nagengast, and Morin 2013). Assumptions include that each measure loads on only one factor (e.g., assuming the absence of cross-loadings and residual correlations), the absence of effects from covariates, and the assumption of an exact invariant of the measures in MGCFA.
- In analysis of cross-national data, equality constraints tend to lead to the rejection of the tested model and often produce poor model fit statistics. Increasing the methodological sophistication and availability of statistical tools provide ways of quantifying uncertainty in the hypothesis through the estimation of possible values in the population rather than depending on only a single value for many populations.

Figure 3.8: Source: Desa et al. (2018)
Approximate Invariance techniques:
References
Alemán, José, and Dwayne Woods. 2016. “Value Orientations From the World Values Survey.” Comparative Political Studies 49 (8): 1039–67. https://doi.org/10.1177/0010414015600458.
Ariely, Gal, and Eldad Davidov. 2011. “Can we Rate Public Support for Democracy in a Comparable Way? Cross-National Equivalence of Democratic Attitudes in the World Value Survey.” Social Indicators Research 104 (2): 271–86. https://doi.org/10.1007/s11205-010-9693-5.
Brown, T. 2015. Confirmatory Factor Analysis for Applied Research. New York: The GuilFord Press. https://doi.org/10.1017/CBO9781107415324.004.
Byrne, Barbara M., Richard J. Shavelson, and Bengt Muthén. 1989. “Testing for the equivalence of factor covariance and mean structures: The issue of partial measurement invariance.” Psychological Bulletin 105 (3): 456–66. https://doi.org/10.1037/0033-2909.105.3.456.
Chen, Fang Fang. 2008. “What happens if we compare chopsticks with forks? The impact of making inappropriate comparisons in cross-cultural research.” Journal of Personality and Social Psychology 95 (5): 1005–18. https://doi.org/10.1037/a0013193.
Cieciuch, Jan, Eldad Davidov, Peter Schmidt, and René Algesheimer. 2019. “How to Obtain Comparable Measures for Cross-National Comparisons.” KZfSS Kölner Zeitschrift Für Soziologie Und Sozialpsychologie 71 (S1): 157–86. https://doi.org/10.1007/s11577-019-00598-7.
Davidov, Eldad, Bart Meuleman, Jan Cieciuch, Peter Schmidt, and Jaak Billiet. 2014. “Measurement Equivalence in Cross-National Research.” Annual Review of Sociology 40 (1): 55–75. https://doi.org/10.1146/annurev-soc-071913-043137.
Davidov, E., P. Schmidt, and S. H. Schwartz. 2008. “Bringing Values Back In: The Adequacy of the European Social Survey to Measure Values in 20 Countries.” Public Opinion Quarterly 72 (3): 420–45. https://doi.org/10.1093/poq/nfn035.
De Beuckelaer, Alain, and Gilbert Swinnen. 2011. “Biased latent variable mean comparisons due to measurement noninvariance: A simulation study.” In Cross-Cultural Analysis: Methods and Applications., 117–47. European Association for Methodology Series. New York, NY, US: Routledge/Taylor & Francis Group.
De Roover, Kim, Jeroen K. Vermunt, and E. Ceulemans. 2019. “Mixture multigroup factor analysis for unraveling factor loading non-invariance across many groups.” PsyArXiv. https://doi.org/https://doi.org/10.31234/osf.io/7fdwv.
Desa, Deana, Fons J. R. van de Vijver, Ralph Carstens, and Wolfram Schulz. 2018. “Measurement Invariance in International Large-scale Assessments.” In Advances in Comparative Survey Methods, 879–910. Hoboken, NJ, USA: John Wiley & Sons, Inc. https://doi.org/10.1002/9781118884997.ch40.
Fischer, Ronald, and Johannes A. Karl. 2019. “A primer to (cross-cultural) multi-group invariance testing possibilities in R.” Frontiers in Psychology 10 (JULY): 1–18. https://doi.org/10.3389/fpsyg.2019.01507.
Horn, John L., and J. J. Mcardle. 1992. “A practical and theoretical guide to measurement invariance in aging research.” Experimental Aging Research 18 (3): 117–44. https://doi.org/10.1080/03610739208253916.
Kim, Eun Sook, Myeongsun Yoon, and Taehun Lee. 2012. “Testing Measurement Invariance Using MIMIC.” Educational and Psychological Measurement 72 (3): 469–92. https://doi.org/10.1177/0013164411427395.
Lek, Kimberley, Daniel Oberski, Eldad Davidov, Jan Cieciuch, Daniel Seddig, and Peter Schmidt. 2018. “Approximate Measurement Invariance.” In Advances in Comparative Survey Methods, 911–29. Hoboken, NJ, USA: John Wiley & Sons, Inc. https://doi.org/10.1002/9781118884997.ch41.
Lomazzi, Vera. 2017. “Using Alignment Optimization to Test the Measurement Invariance of Gender Role Attitudes in 59 Countries” 12 (1): 1–27. https://doi.org/10.12758/mda.2017.09.
Marsh, Herbert W., Benjamin Nagengast, and Alexandre J. S. Morin. 2013. “Measurement invariance of big-five factors over the life span: ESEM tests of gender, age, plasticity, maturity, and la dolce vita effects.” Developmental Psychology 49 (6): 1194–1218. https://doi.org/10.1037/a0026913.
Millsap, Roger E. 2011. Statistical approaches to measurement invariance. New York, NY, US: Routledge/Taylor & Francis Group.
Muthén, Bengt, and Tihomir Asparouhov. 2018. “Recent Methods for the Study of Measurement Invariance With Many Groups.” Sociological Methods & Research 47 (4): 637–64. https://doi.org/10.1177/0049124117701488.
Rudnev, Maksim, Ekaterina Lytkina, Eldad Davidov, Peter Schmidt, and Andreas Zick. 2018. “Testing Measurement Invariance for a Second-Order Factor. A Cross-National Test of the Alienation Scale.” MDA - Methoden, Daten, Analysen 12 (January). https://doi.org/10.12758/mda.2017.11.
SOKOLOV, BORIS. 2018. “The Index of Emancipative Values: Measurement Model Misspecifications.” American Political Science Review 112 (2): 395–408. https://doi.org/10.1017/S0003055417000624.
Steenkamp, Jan-Benedict E M, and Hans Baumgartner. 1998. “Assessing Measurement Invariance in.” Journal of Consumer Reserach 25 (1): 78–107. https://doi.org/10.1086/209528.
Steinmetz, Holger. 2018. “Estimation and Comparison of Latent Means Across Cultures.” In Cross-Cultural Analysis: Methods and Applications, edited by E. Davidov, Peter Schmidt, Jaak Billiet, and Bart Meuleman, 2nd editio. New York: Routledge Taylor & Francis Group.
Tay, Louis, Adam W Meade, and Mengyang Cao. 2015. “An Overview and Practical Guide to IRT Measurement Equivalence Analysis.” Organizational Research Methods 18 (1): 3–46. https://doi.org/10.1177/1094428114553062.
Welzel, Christian, and Ronald F. Inglehart. 2016. “Misconceptions of Measurement Equivalence.” Comparative Political Studies 49 (8): 1068–94. https://doi.org/10.1177/0010414016628275.