Chapter 7 Further Reading
7.1 Critical Issues of MGCFA Measurement invariance
7.1.1 Model testing
Quality of the model is the similarity of estimated parameters to the true population parameters (assuming the model is correct). However, cannot really observe this directly
- Model fit is the testing procedure and indicates the similarity between observed variance-covariance matrix and the variance-covariance matrix predicted by model.
Two testing approaches
- Global Fit indices: The most popular global fit measure is the χ2 test but it was shown to be problematic.
(…) a number of alternative fit measures have been proposed (even though most of them still are derived from the chi-square statistic). Here, we focus on the most commonly reported fit statistics (Hu and Bentler, 1999), which can be differentiated into (a) incremental or comparative and (b) lack-of-fit indices. Incremental or comparative fit models compare the fit of the theoretical model against an alternative model. This is (typically) an independence model in which no relationships between variables are expected. Higher values are indicating better fit with values above 0.95 indicating good fit (Hu and Bentler, 1998). The Tucker–Lewis Index (TLI) or non-normed fit index (NNFI) and the comparative fit index (CFI; Bentler, 1990) are the most commonly reported and more robust indicators (Hu and Bentler, 1999). Lack of fit indices in contrast indicate better fit, if the value is lower. The standardized root mean square residual (SRMR; Bollen, 1989) compares the discrepancy between the observed correlation matrix and the implied theoretical matrix. Smaller values indicate that there is less deviation. Hu and Bentler (1998) suggested that values less than 0.08 are acceptable. The root mean square error of approximation (RMSEA; Browne and Cudeck, 1992) uses a similar logic, but also takes into account model complexity and rewards more parsimonious models. Historically, values ranging between 0.06 and 0.08 were deemed acceptable, but simulations by Hu and Bentler (1998, 1999) suggested that a cut-off of 0.06 might be more appropriate. (Fischer and Karl 2019)
Most commonly used: chi-square, CFI, TLI, RMSEA, SRMR (all available upon request in lavaan).
See David Kenny’s website for a detailed explanation of each fit indice.
- Local Fit indices: Saris, Satorra, and Veld (2009) argue that global fit measures are never sufficient and that researchers should test the local fit of their models, that is, they should look at the parameter level and test if each of the parameters in the model is or not misspecified. Local fit testing tells whether there are misspecifications in the model using the modification indices (an estimate of the amount by which the χ2 would be reduced if a single parameter restriction was to be removed from the model), the power of the test (which is the complement of type II error, i.e., of wrongly failing to reject the null hypothesis), and when necessary the expected parameter changes (an approximation to the value of the parameter if it was not constrained).
Local fit testing: in R’s semTools package (miPowerFit); in Mplus Jrule for Mplus
Fit indices are not like R2
High model fit does not guarantee theoretical soundness of the model. There are usually many models that have similarly good fit to the data, so you found only one of them.
7.1.2 Correction for measurement error in invariance testing
Without correction for measurement errors, we run the risk of giving explanations for differences between countries on substantive grounds that could be due to differences in measurement quality of the instruments.
The problem with this approach is that the needed information is seldom available: quality estimates
The information about the quality can be derived from external sources such as MTMM experiments or SQP predictions.
Pirralha and Weber (2020) suggest to test on cognitive equivalence i.e. invariance after correction for measurement errors.
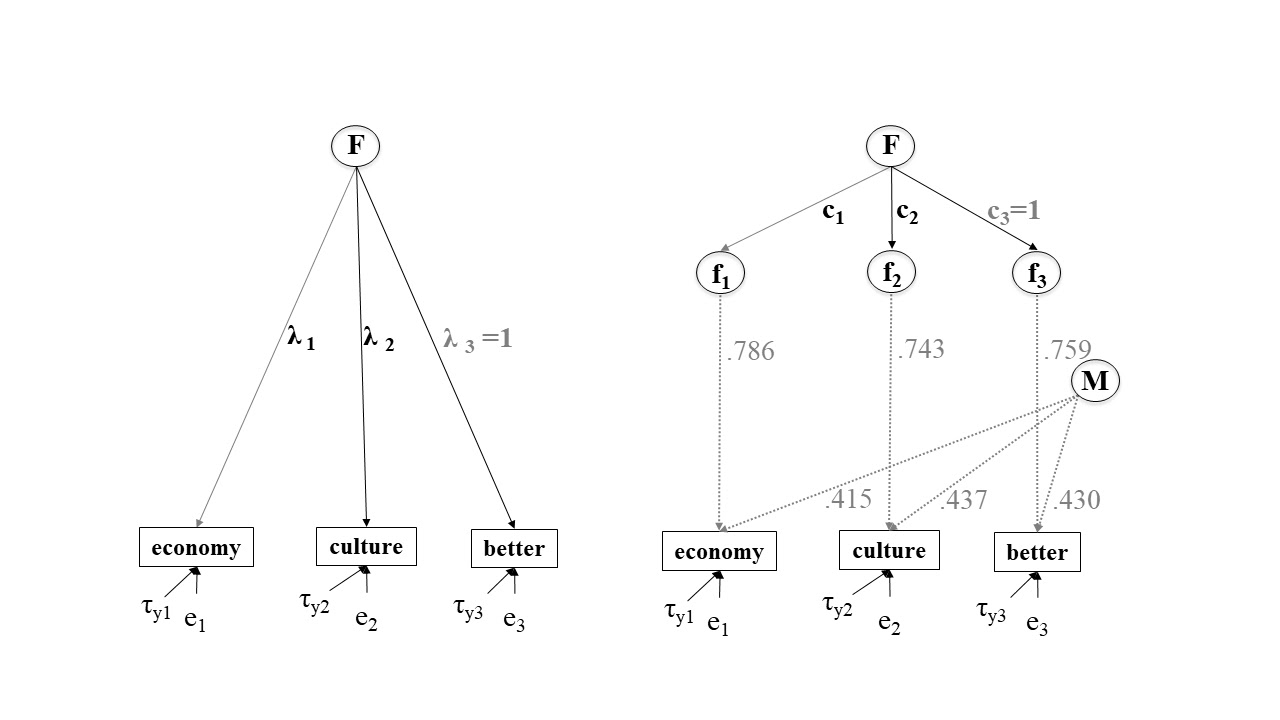
Figure 7.1: Measurement invariance with correction for measurement error models. Source: Pirralha and Weber (2020)
7.1.3 Sample size & Model Characteristics
Sample size cannot be too small (no rule of thumb here).
Number of items per scale is very important. Large simulation study by Pokropek, Davidov, and Schmidt (2019) shows that model characteristics such as number of items per scale is at least as important as invariance testing procedure
Take into account the nature of the observed items (ordinal, continuous, nominal, dichotomous)
7.2 Additional resources
Highly recommended: listen to the Quantitude Podcast episode 12
Measurement Invariance checklists and tutorials:
References
Fischer, Ronald, and Johannes A. Karl. 2019. “A primer to (cross-cultural) multi-group invariance testing possibilities in R.” Frontiers in Psychology 10 (JULY): 1–18. https://doi.org/10.3389/fpsyg.2019.01507.
Pirralha, André, and Wiebke Weber. 2020. “Correction for measurement error in invariance testing: An illustration using SQP.” Edited by Karl Bang Christensen. PLOS ONE 15 (10): e0239421. https://doi.org/10.1371/journal.pone.0239421.
Pokropek, Artur, Eldad Davidov, and Peter Schmidt. 2019. “A Monte Carlo Simulation Study to Assess The Appropriateness of Traditional and Newer Approaches to Test for Measurement Invariance.” Structural Equation Modeling: A Multidisciplinary Journal 00 (00): 1–21. https://doi.org/10.1080/10705511.2018.1561293.
Saris, Willem E., Albert Satorra, and William M. van der Veld. 2009. “Testing Structural Equation Models or Detection of Misspecifications?” Structural Equation Modeling: A Multidisciplinary Journal 16 (4): 561–82. https://doi.org/10.1080/10705510903203433.