4 自动报告

代码提供:刘小妹

4.1 使用方法

library(DataExplorer)
introduce(diamonds)
## # A tibble: 1 × 9
##    rows columns discrete_columns continuous_columns all_missing_columns
##   <int>   <int>            <int>              <int>               <int>
## 1 53940      10                3                  7                   0
## # ℹ 4 more variables: total_missing_values <int>, complete_rows <int>,
## #   total_observations <int>, memory_usage <dbl>
plot_intro(diamonds)

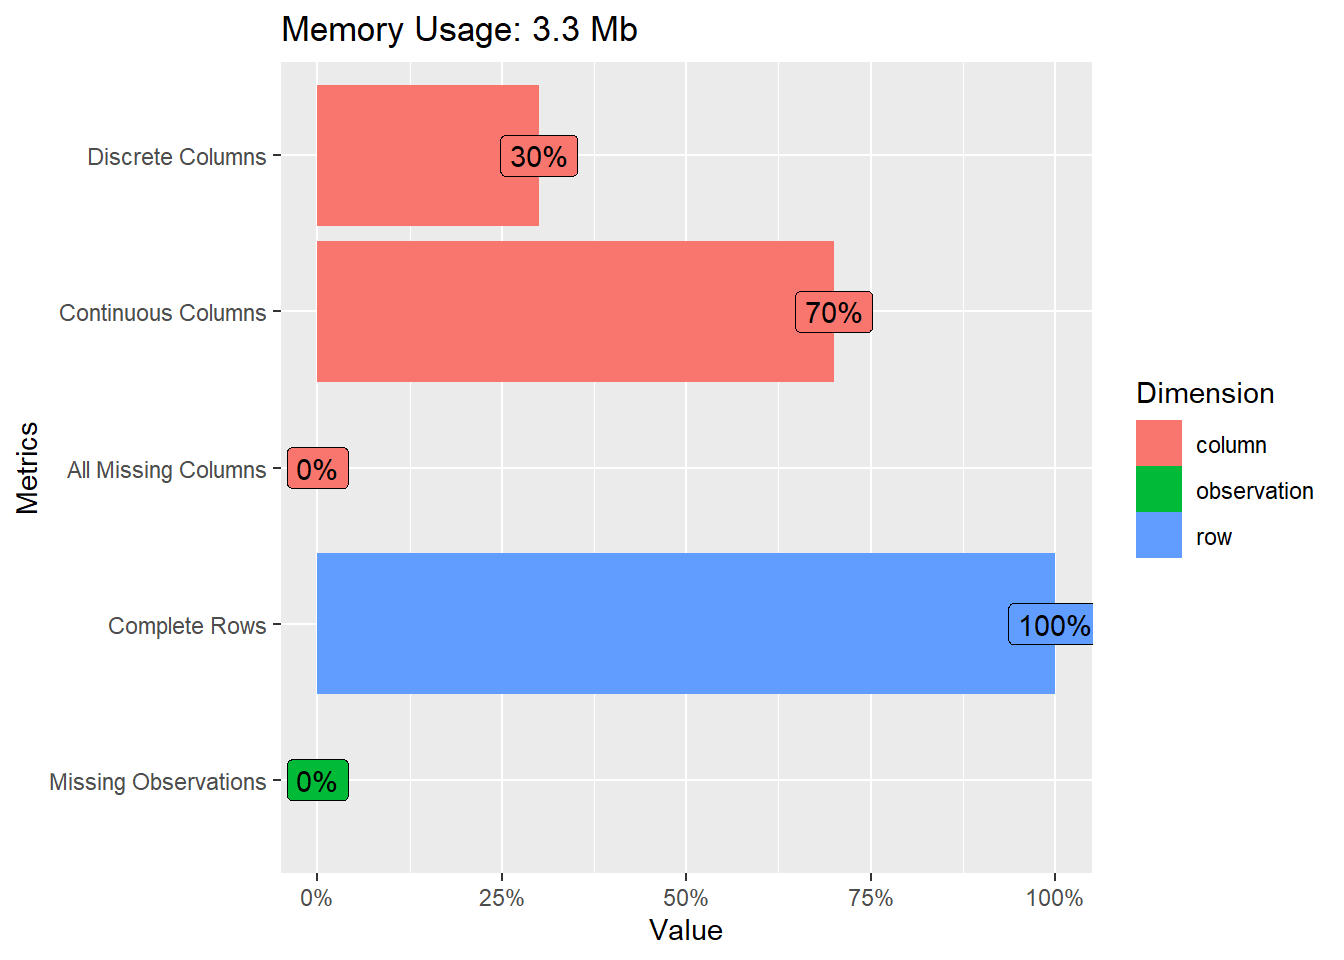
plot_missing(diamonds)
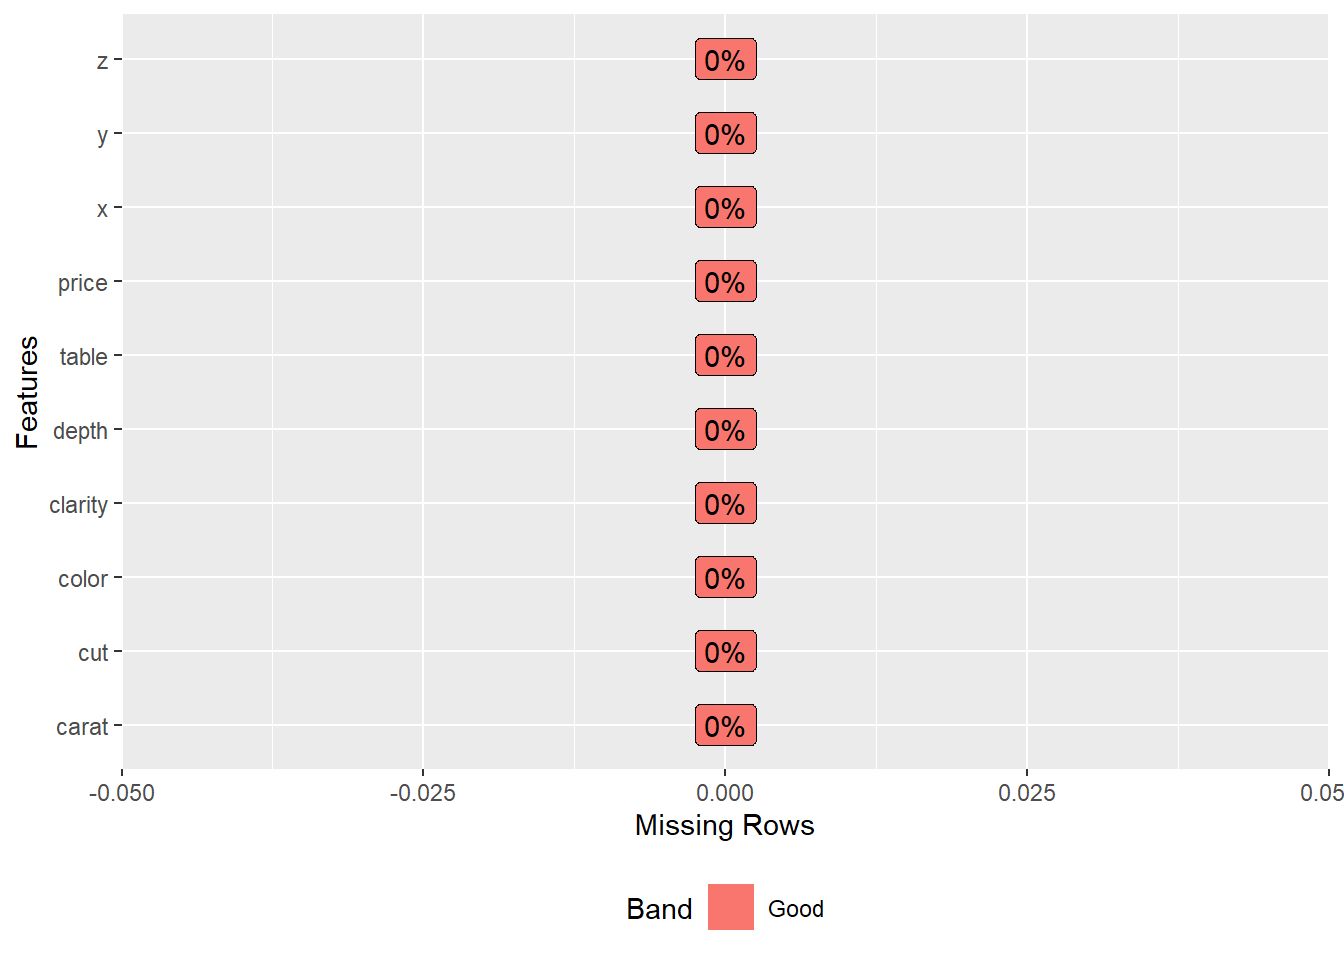
plot_bar(diamonds)

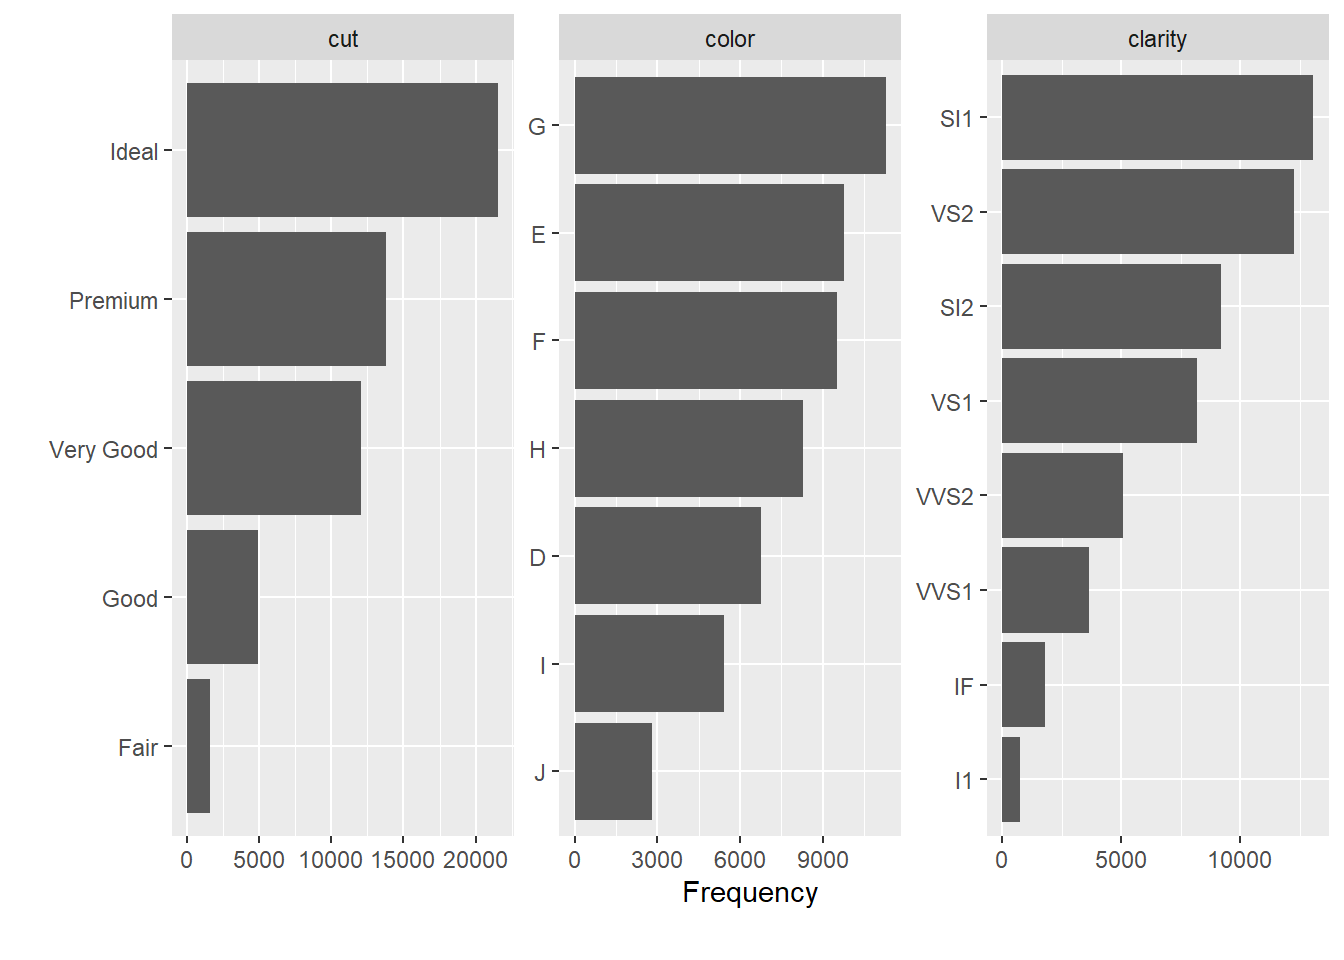
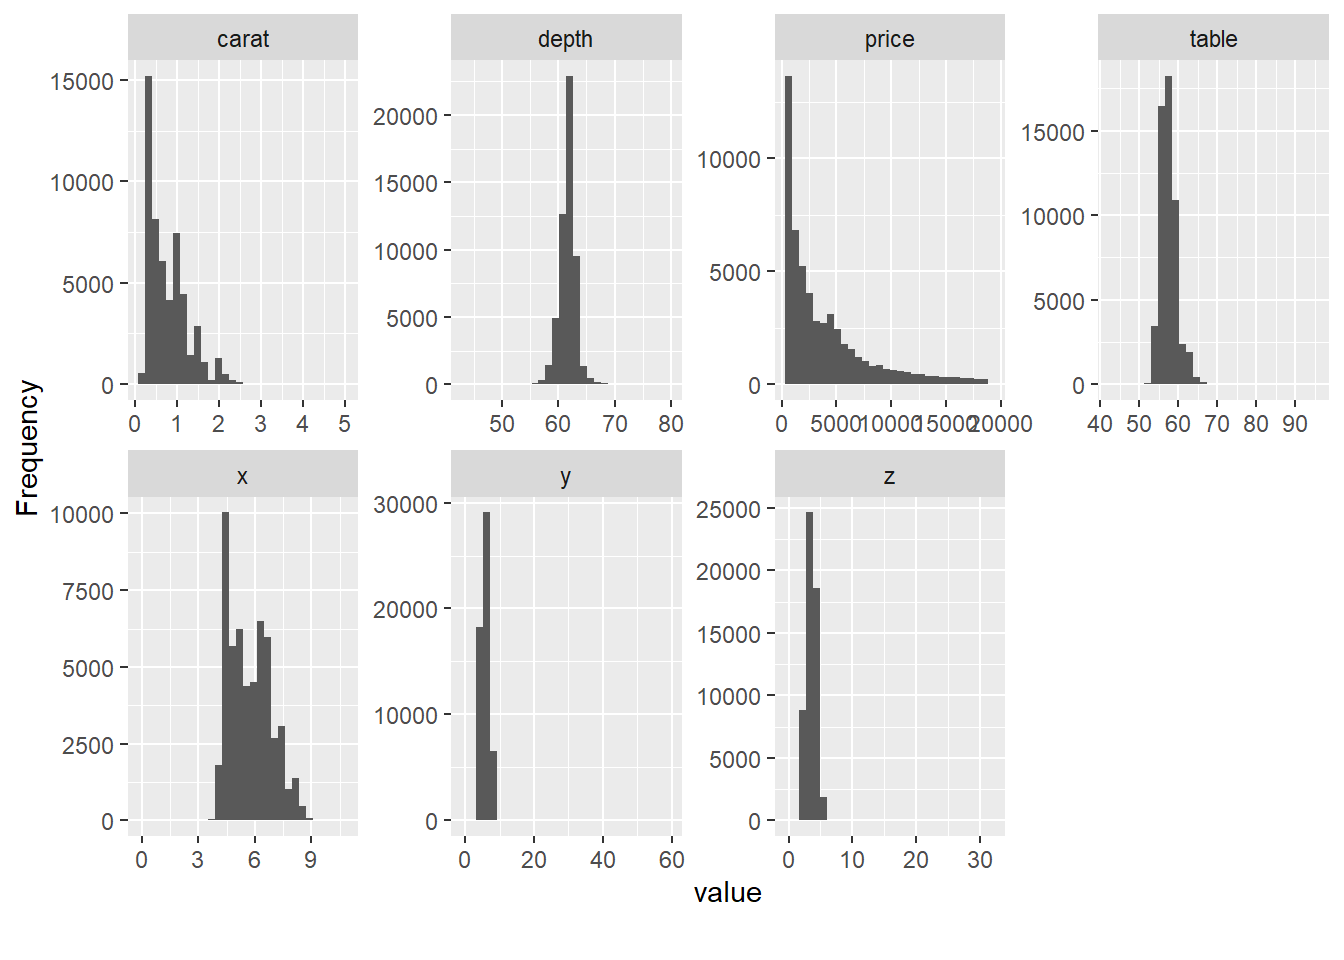
plot_histogram(diamonds)
create_report(diamonds)
## 
## 
## processing file: report.rmd
## 
  |                                           
  |                                     |   0%
  |                                           
  |.                                    |   2%                                 
  |                                           
  |..                                   |   5% (global_options)                
  |                                           
  |...                                  |   7%                                 
  |                                           
  |....                                 |  10% (introduce)                     
  |                                           
  |....                                 |  12%                                 
  |                                           
  |.....                                |  14% (plot_intro)                    
  |                                           
  |......                               |  17%                                 
  |                                           
  |.......                              |  19% (data_structure)                
  |                                           
  |........                             |  21%                                 
  |                                           
  |.........                            |  24% (missing_profile)               
  |                                           
  |..........                           |  26%                                 
  |                                           
  |...........                          |  29% (univariate_distribution_header)
  |                                           
  |...........                          |  31%                                 
  |                                           
  |............                         |  33% (plot_histogram)                
  |                                           
  |.............                        |  36%                                 
  |                                           
  |..............                       |  38% (plot_density)                  
  |                                           
  |...............                      |  40%                                 
  |                                           
  |................                     |  43% (plot_frequency_bar)            
  |                                           
  |.................                    |  45%                                 
  |                                           
  |..................                   |  48% (plot_response_bar)             
  |                                           
  |..................                   |  50%                                 
  |                                           
  |...................                  |  52% (plot_with_bar)                 
  |                                           
  |....................                 |  55%                                 
  |                                           
  |.....................                |  57% (plot_normal_qq)                
  |                                           
  |......................               |  60%                                 
  |                                           
  |.......................              |  62% (plot_response_qq)              
  |                                           
  |........................             |  64%                                 
  |                                           
  |.........................            |  67% (plot_by_qq)                    
  |                                           
  |..........................           |  69%                                 
  |                                           
  |..........................           |  71% (correlation_analysis)          
  |                                           
  |...........................          |  74%                                 
  |                                           
  |............................         |  76% (principal_component_analysis)  
  |                                           
  |.............................        |  79%                                 
  |                                           
  |..............................       |  81% (bivariate_distribution_header) 
  |                                           
  |...............................      |  83%                                 
  |                                           
  |................................     |  86% (plot_response_boxplot)         
  |                                           
  |.................................    |  88%                                 
  |                                           
  |.................................    |  90% (plot_by_boxplot)               
  |                                           
  |..................................   |  93%                                 
  |                                           
  |...................................  |  95% (plot_response_scatterplot)     
  |                                           
  |.................................... |  98%                                 
  |                                           
  |.....................................| 100% (plot_by_scatterplot)           
## output file: D:/02_work/2020sRBook/2020sRBook1/report.knit.md
## "D:/StatisticsSoftware/Rstudio/resources/app/bin/quarto/bin/tools/pandoc" +RTS -K512m -RTS "D:/02_work/2020sRBook/2020sRBook1/report.knit.md" --to html4 --from markdown+autolink_bare_uris+tex_math_single_backslash --output pandoc2a8074db7957.html --lua-filter "D:\StatisticsSoftware\R\R-4.2.3\library\rmarkdown\rmarkdown\lua\pagebreak.lua" --lua-filter "D:\StatisticsSoftware\R\R-4.2.3\library\rmarkdown\rmarkdown\lua\latex-div.lua" --embed-resources --standalone --variable bs3=TRUE --section-divs --table-of-contents --toc-depth 6 --template "D:\StatisticsSoftware\R\R-4.2.3\library\rmarkdown\rmd\h\default.html" --no-highlight --variable highlightjs=1 --variable theme=yeti --mathjax --variable "mathjax-url=https://mathjax.rstudio.com/latest/MathJax.js?config=TeX-AMS-MML_HTMLorMML" --include-in-header "C:\Users\Sonde\AppData\Local\Temp\RtmpyAnlY9\rmarkdown-str2a8079874369.html"
## 
## Output created: report.html