3 用ggplot2制图
代码提供:
张洛宏 徐颖 陈宇祥 柯颖婷
主要内容: -散点图 抖散图 箱线图 直方图 密度图 提琴图 山峦图 椭圆图 2D密度图 -图的分面 -图上标注文本
3.1 读取数据
#数据准备
library(ggplot2)
library(tidyverse)
data(diamonds)
#使用ggplot2的自带数据集diamonds
set.seed(100)
dsmall <- diamonds[sample(nrow(diamonds),1000),]
head(dsmall)
## # A tibble: 6 × 10
## carat cut color clarity depth table price x y z
## <dbl> <ord> <ord> <ord> <dbl> <dbl> <int> <dbl> <dbl> <dbl>
## 1 1.26 Ideal G SI1 59.6 57 6738 7.08 7.04 4.21
## 2 0.7 Ideal D VS2 62.7 57 3448 5.65 5.67 3.55
## 3 0.36 Ideal F SI1 62 56 770 4.59 4.54 2.83
## 4 2.1 Premium J SI2 59.1 58 12494 8.46 8.4 4.98
## 5 1.21 Premium D SI2 59.7 58 4946 7.06 6.96 4.19
## 6 2 Good E SI2 64.7 57 15393 7.75 7.86 5.053.2 散点图 抖散图 箱线图 直方图
散点图
ggplot(data=dsmall,aes(x=carat,y=price))+
  geom_point()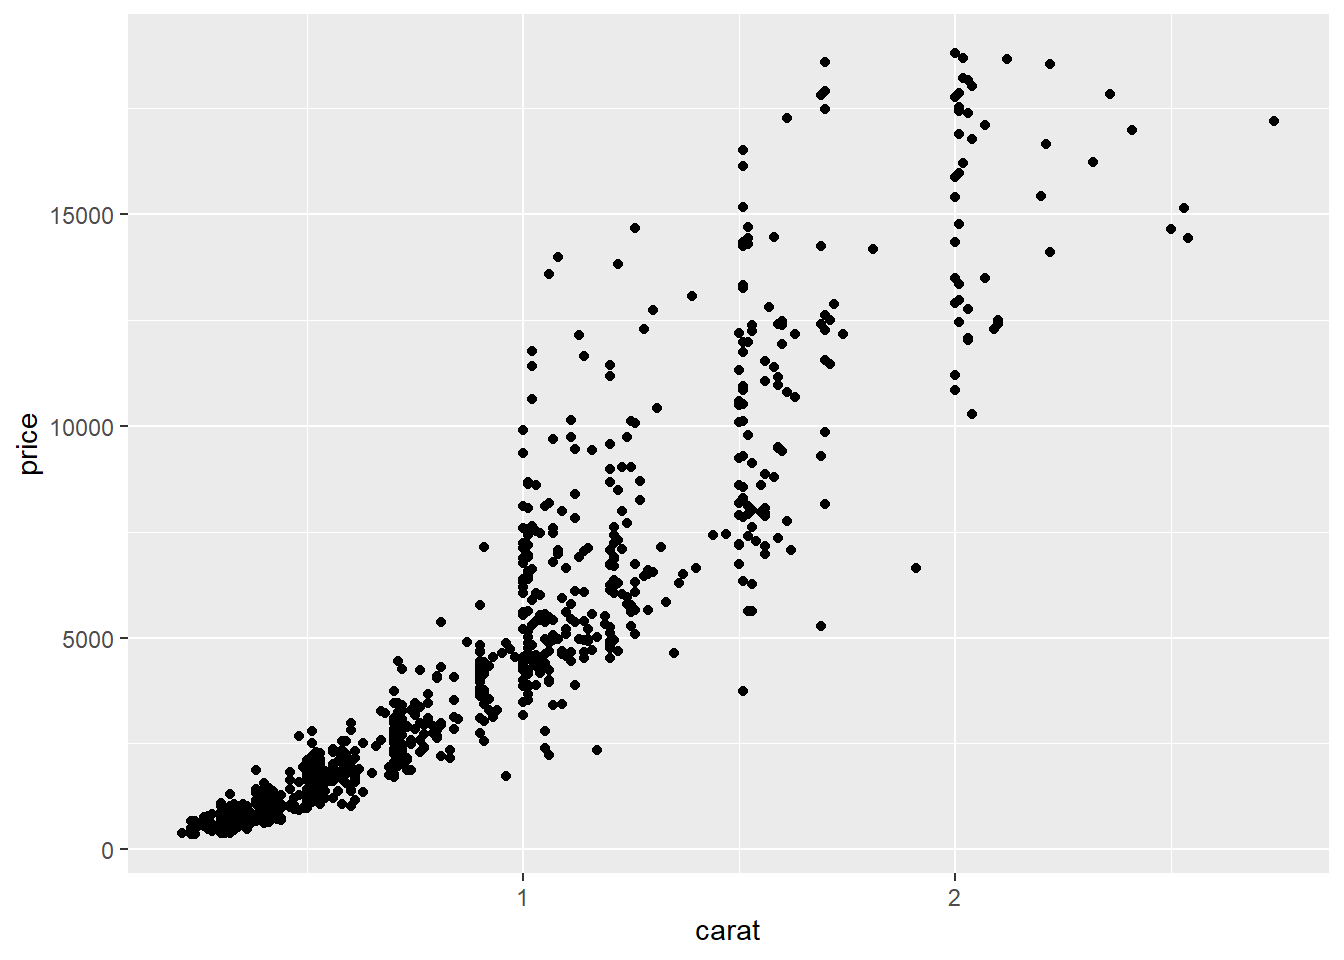
#设置颜色
ggplot(data=dsmall,
       aes(x=carat,y=price,color=cut))+
  geom_point()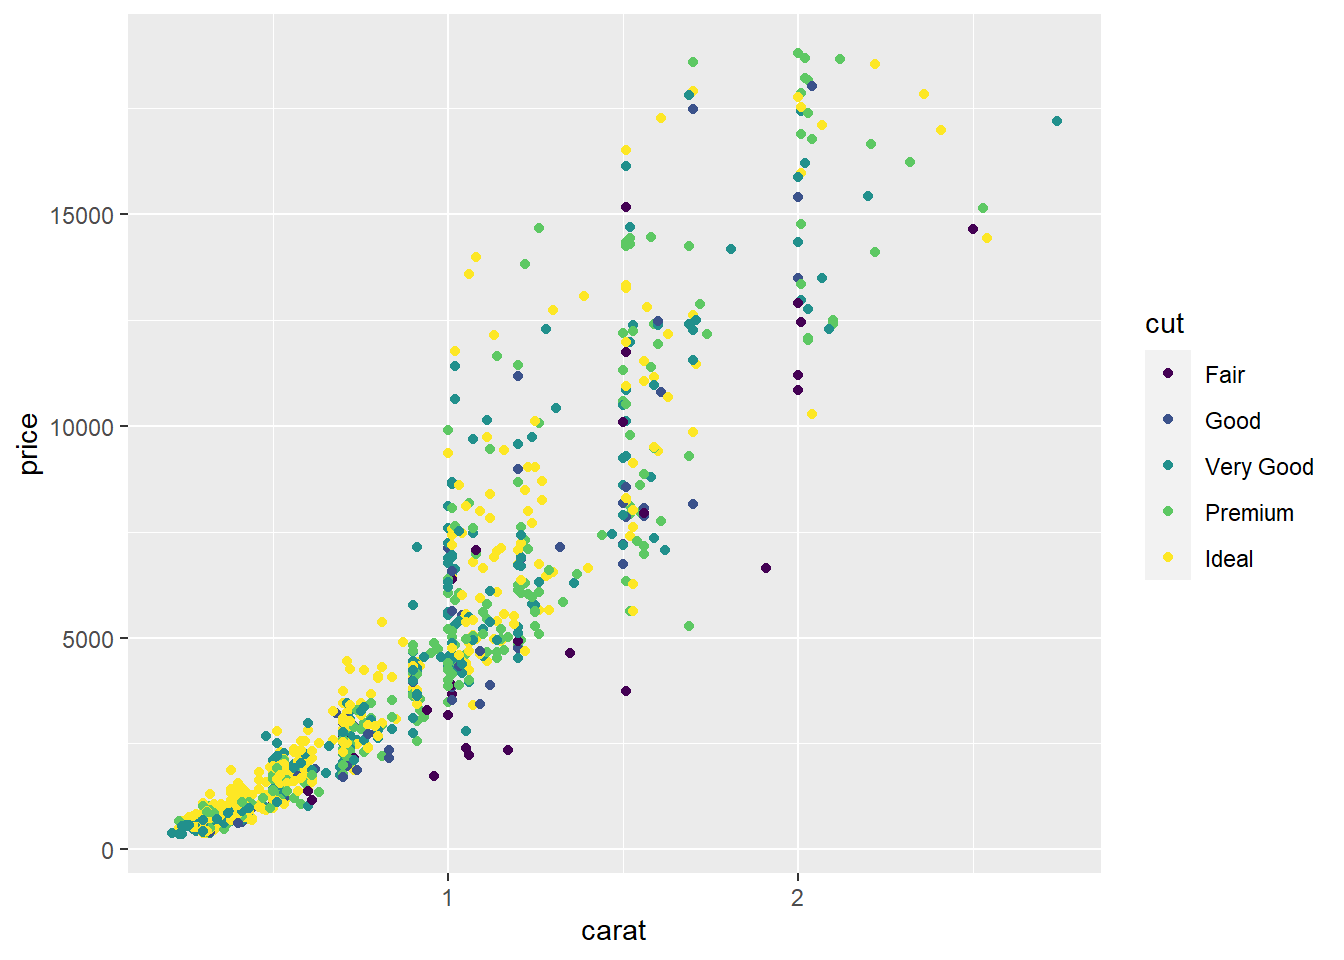
抖散图
ggplot(data=dsmall,aes(x=cut,y=x))+
  geom_point()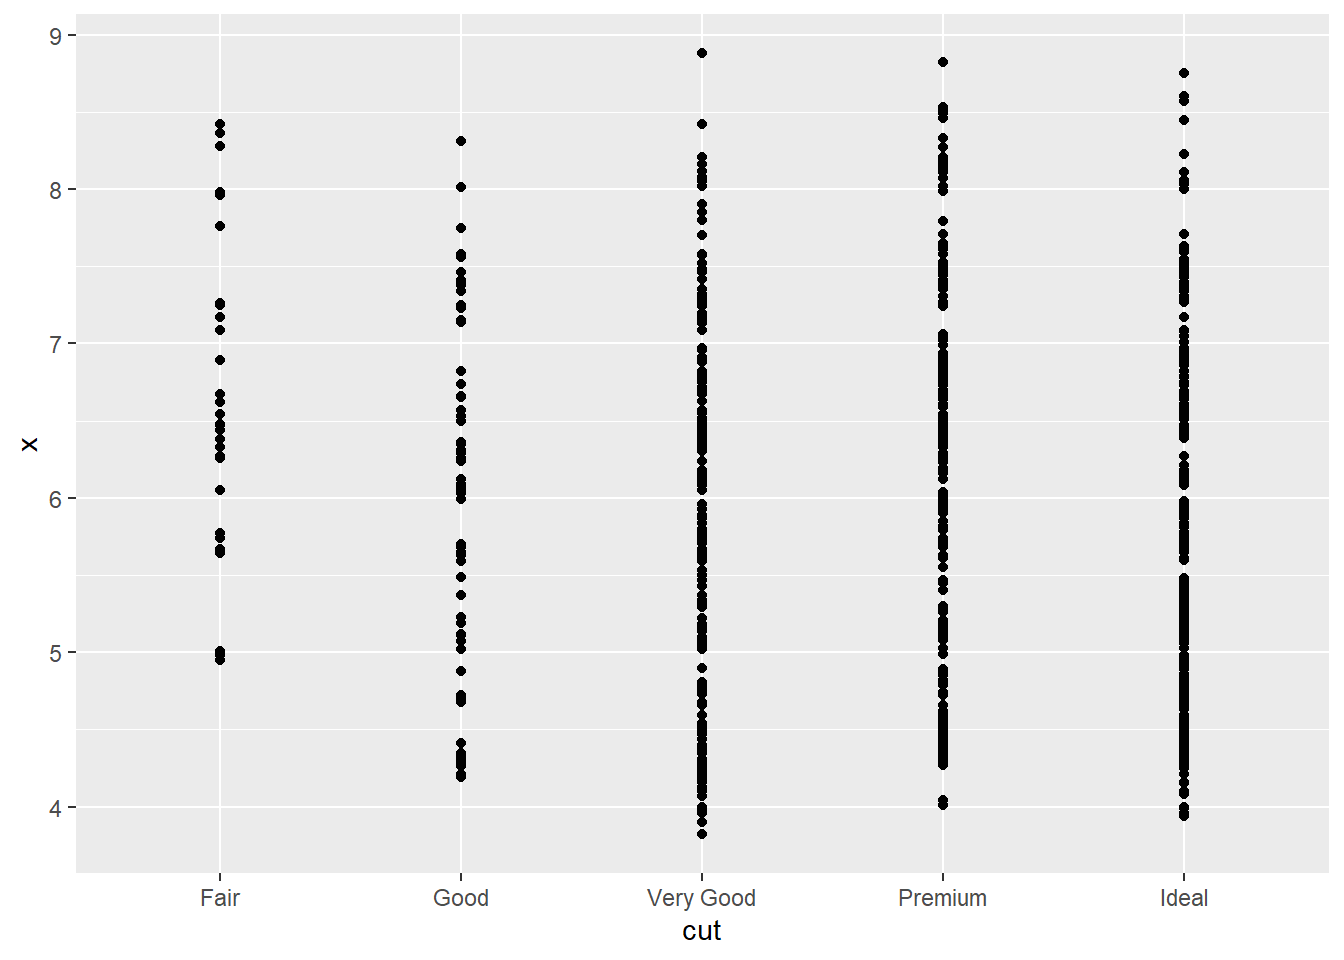
dsmall %>%
  ggplot(aes(x = cut, y =x)) +
  geom_jitter() #为每个点的位置增加了少量的随机变化,能够处理点相互重叠的问题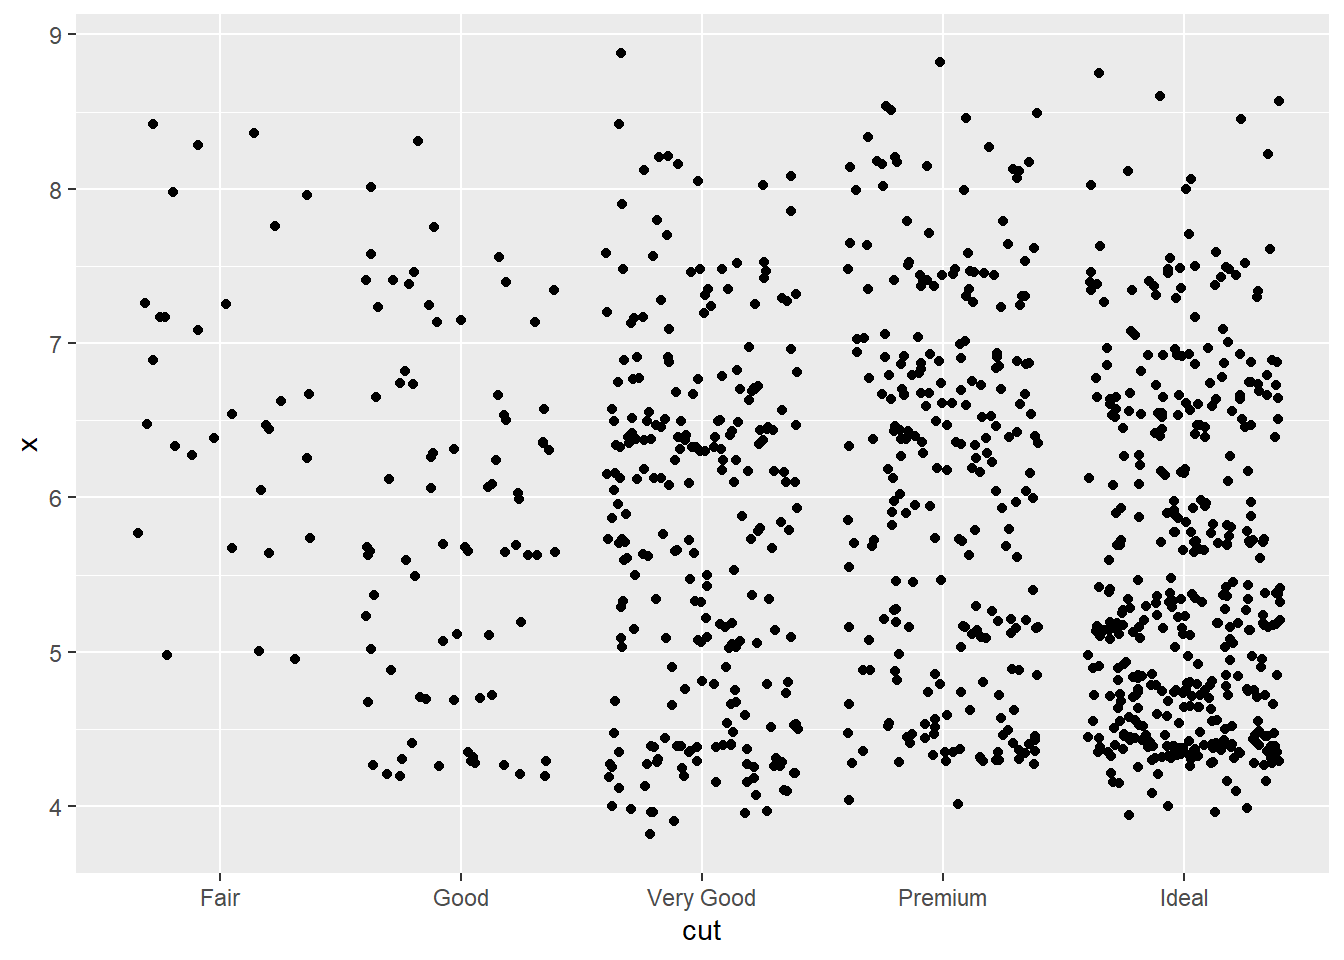
箱线图
ggplot(data=dsmall,
       aes(x=cut,y=price,fill=cut,color=cut))+
  geom_boxplot(alpha=0.7)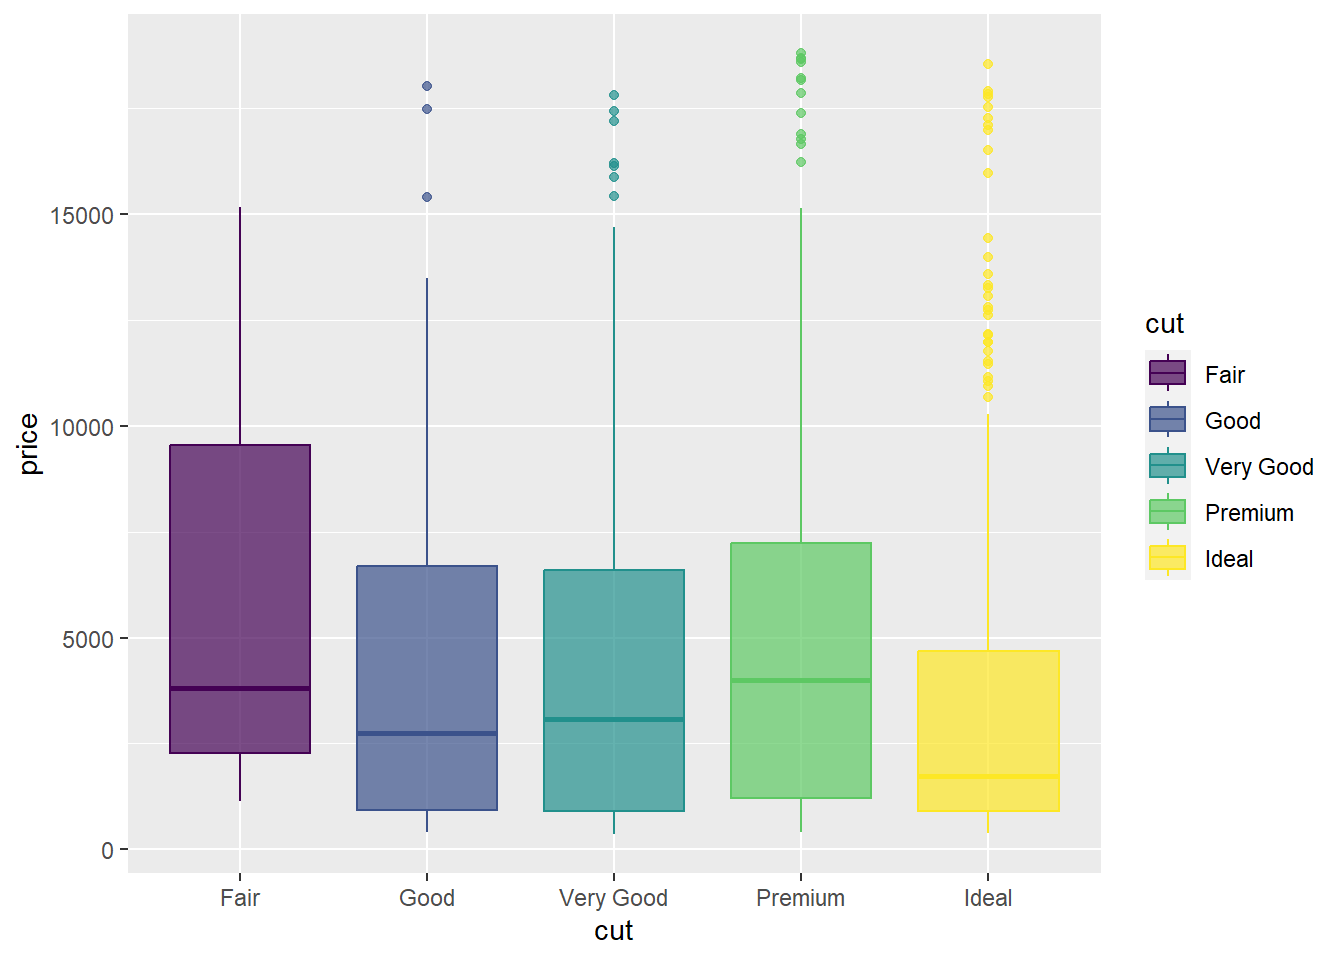
#添加标题、横纵轴标签
ggplot(data=dsmall,
       aes(x=cut,y=price,fill=cut,color=cut))+
  geom_boxplot(alpha=0.7)+
  labs(x="钻石切工",y="钻石价格",title="钻石切工和钻石价格关系分布箱线图")
直方图
ggplot(data=dsmall,aes(x=price))+
  geom_histogram(bins=30)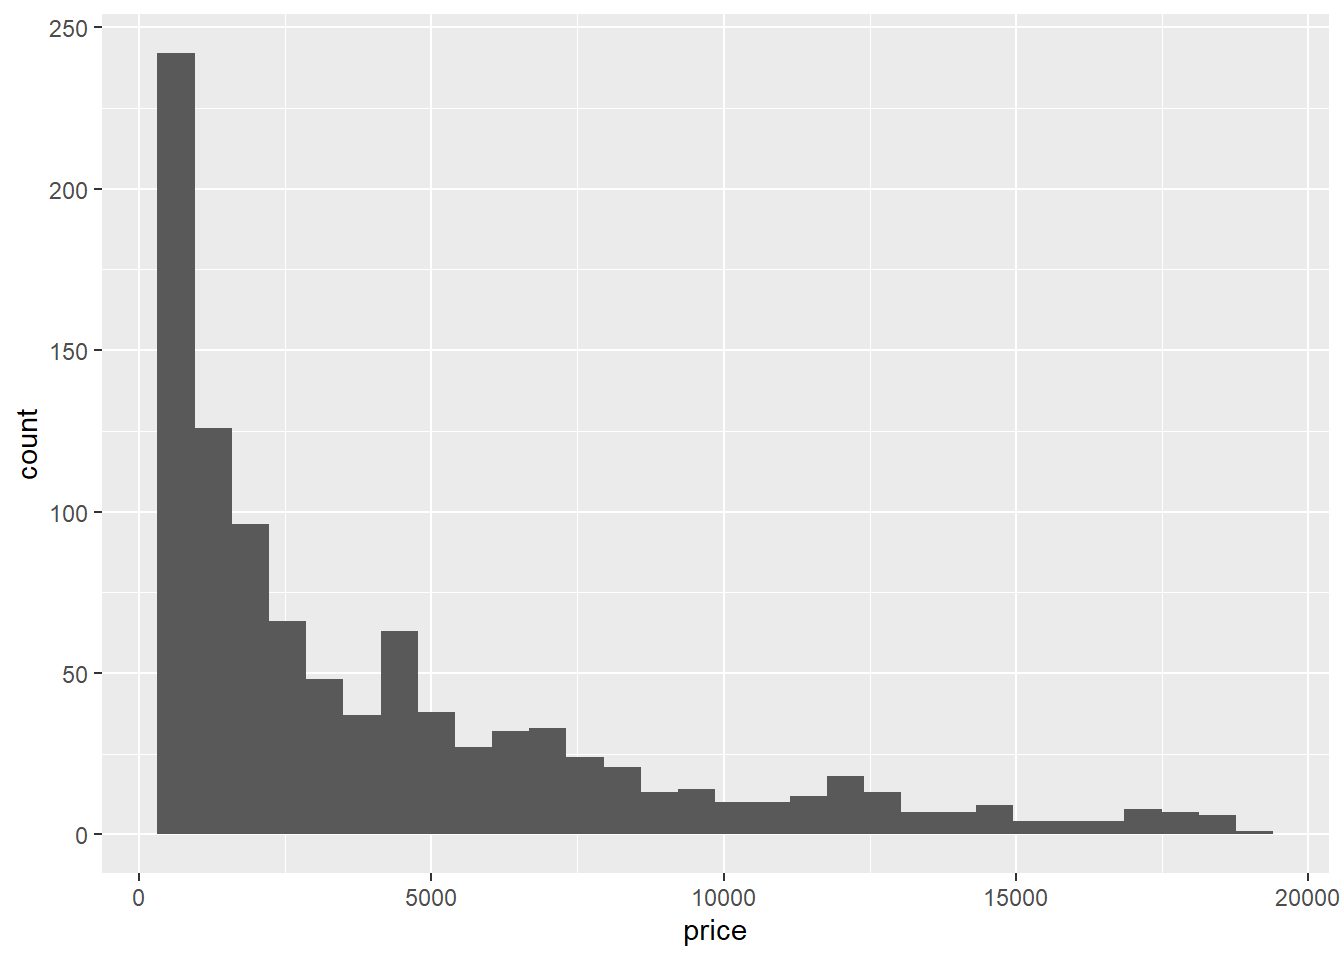
3.3 密度图 提琴图 山峦图 椭圆图 2D密度图
密度图
ggplot(data=dsmall,
       aes(x=price,fill=cut))+
  geom_density(alpha=0.5)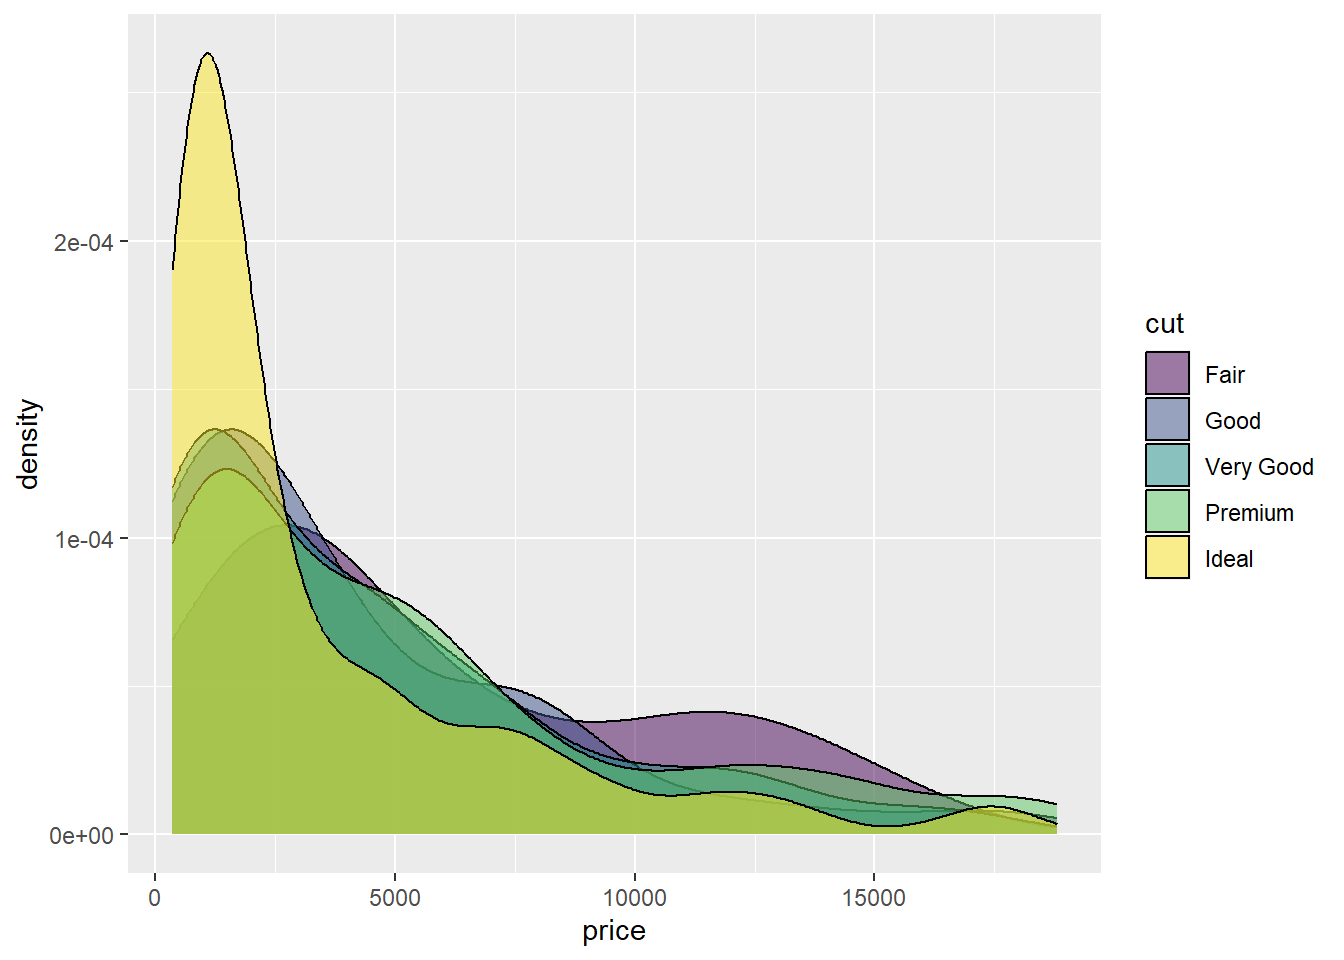
提琴图
ggplot(data=dsmall,
       aes(x=cut,y=price,fill=cut))+
  geom_violin(alpha=0.5)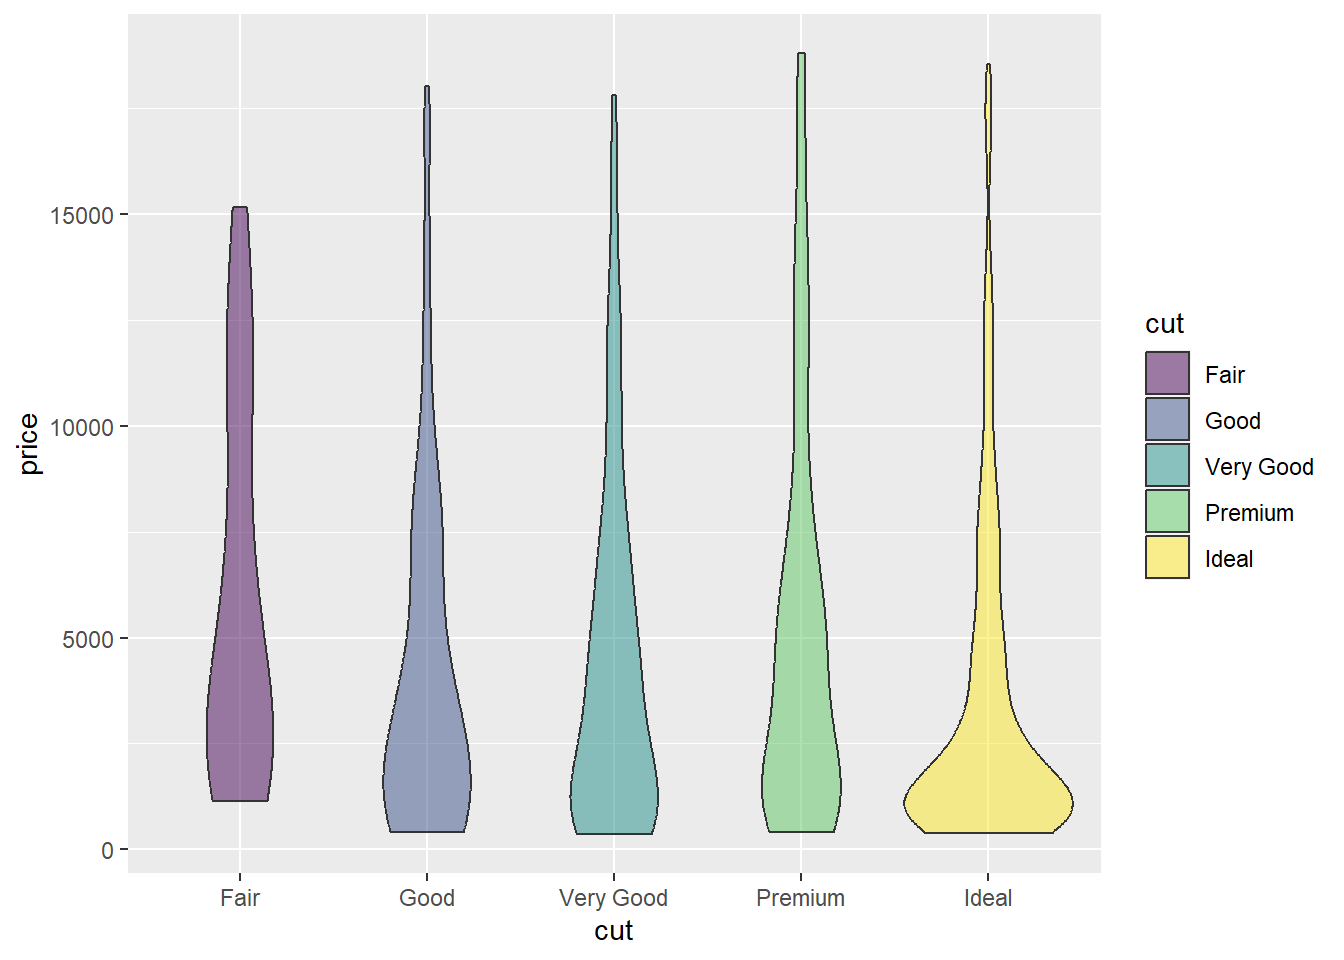
山峦图
x为连续变量,y为离散变量
library(ggridges)
dsmall %>%
  ggplot(aes(x = depth ,y = cut ,fill = cut)) +
  ggridges::geom_density_ridges()
## Picking joint bandwidth of 0.378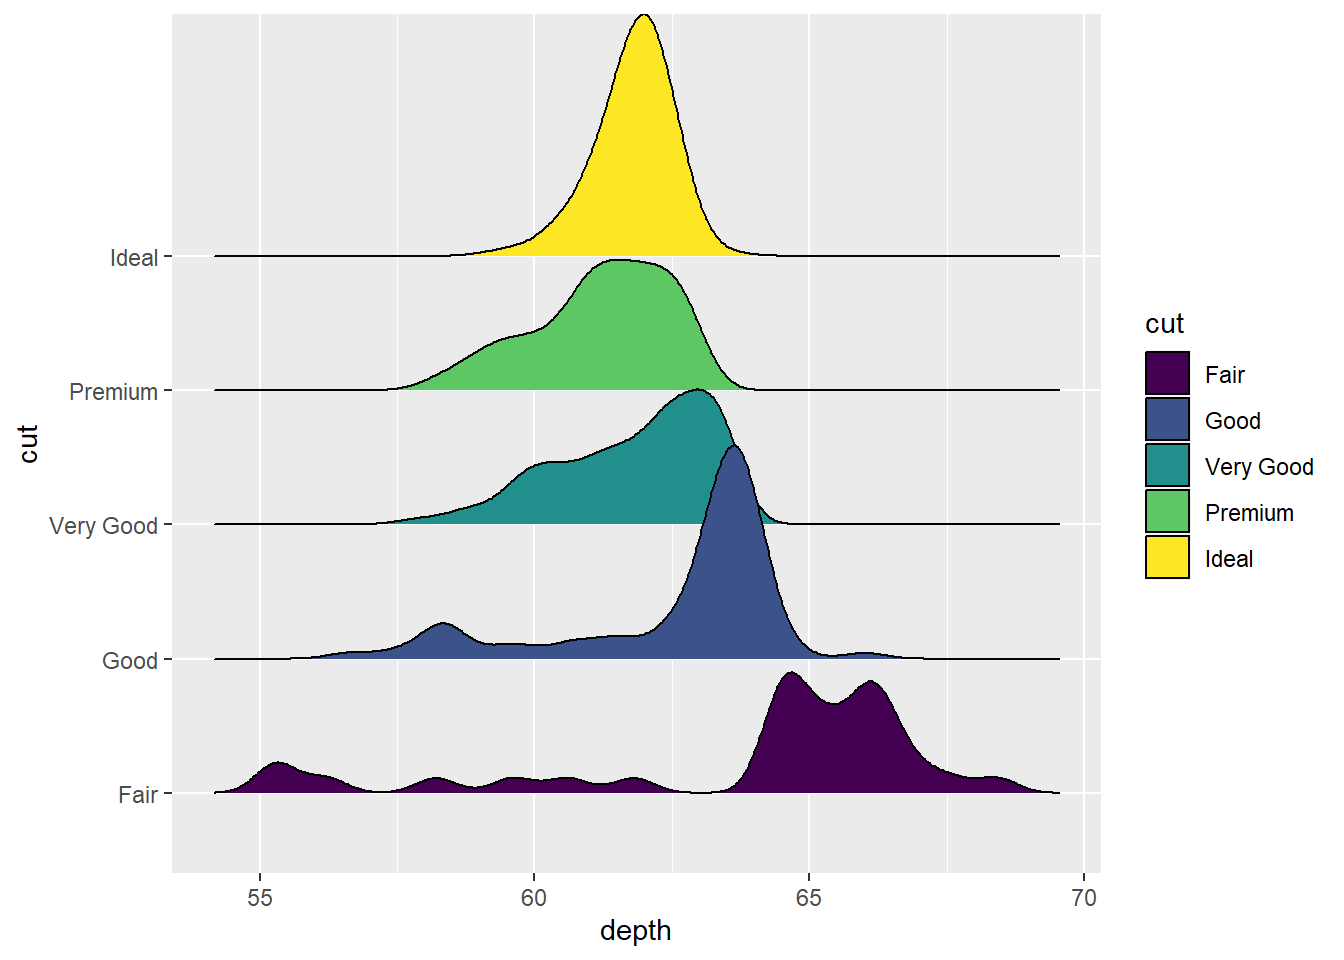
椭圆图
dsmall %>%
  ggplot(aes(x = log(carat), y = price)) +
  geom_point() +
  stat_ellipse(type = "norm", level = 0.95) #level=0.95为95%置信区间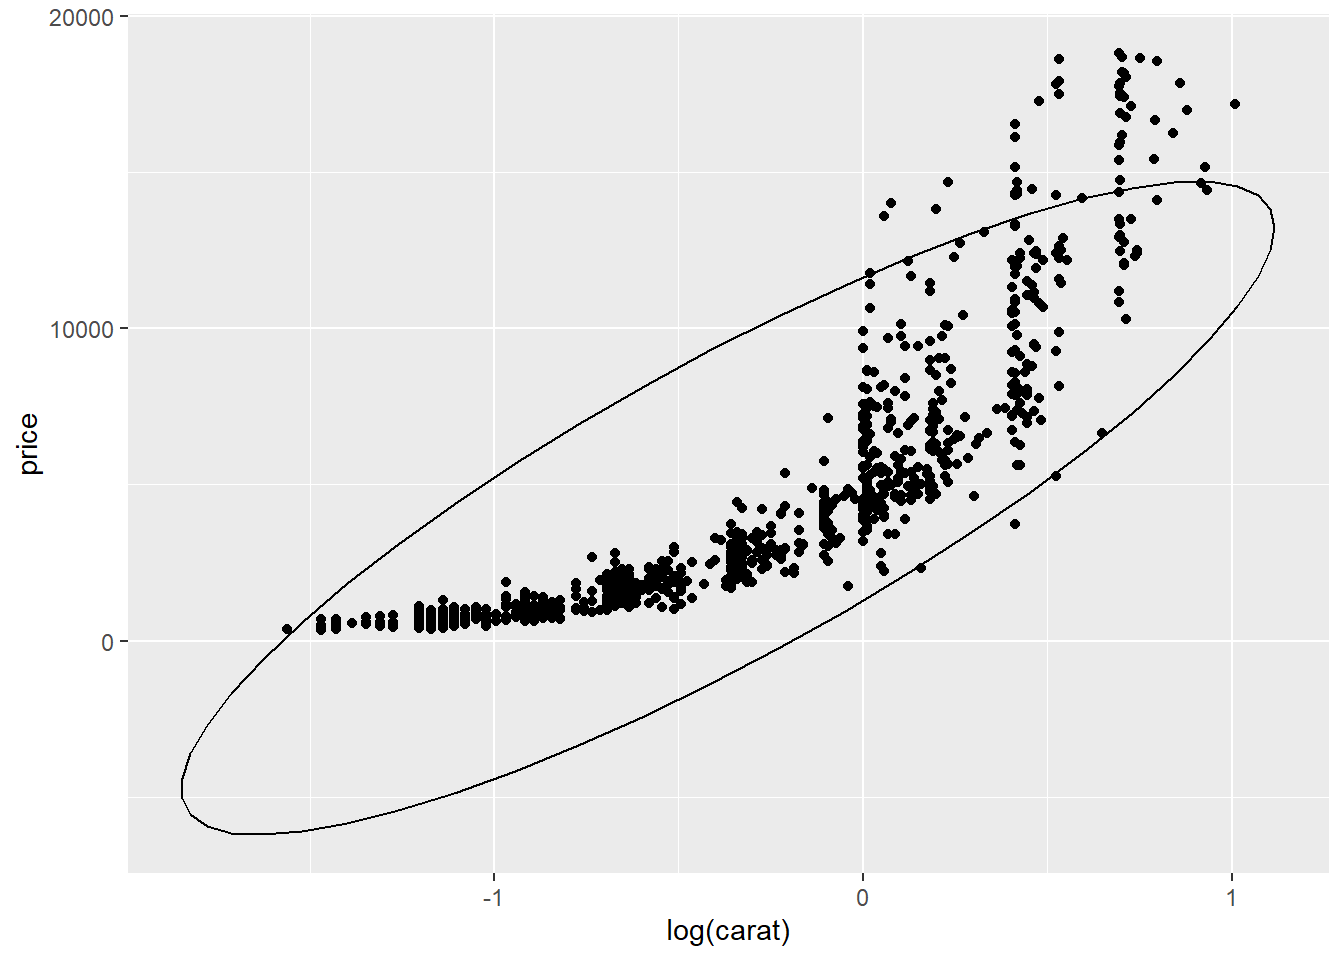
2D密度图
dsmall %>%
  ggplot(aes(x =carat , y = depth)) +
  geom_bin2d() #作长方形分块的二维直方图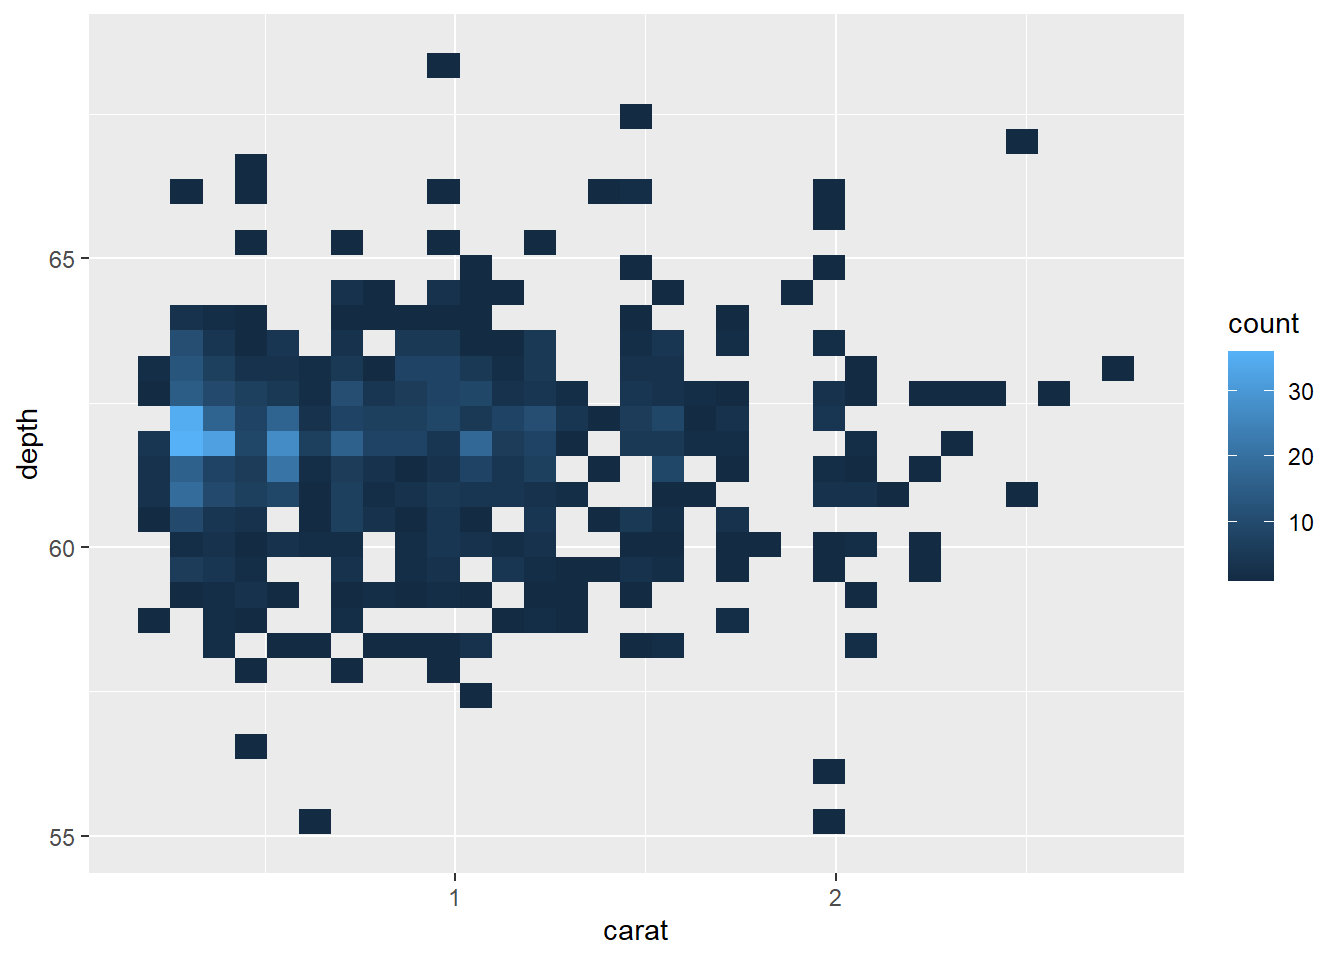
3.4 图的分面{facet_grid() / facet_wrap()}
dsmall %>%
  ggplot(aes(x = carat)) +
  geom_density() +
  facet_grid(. ~ cut)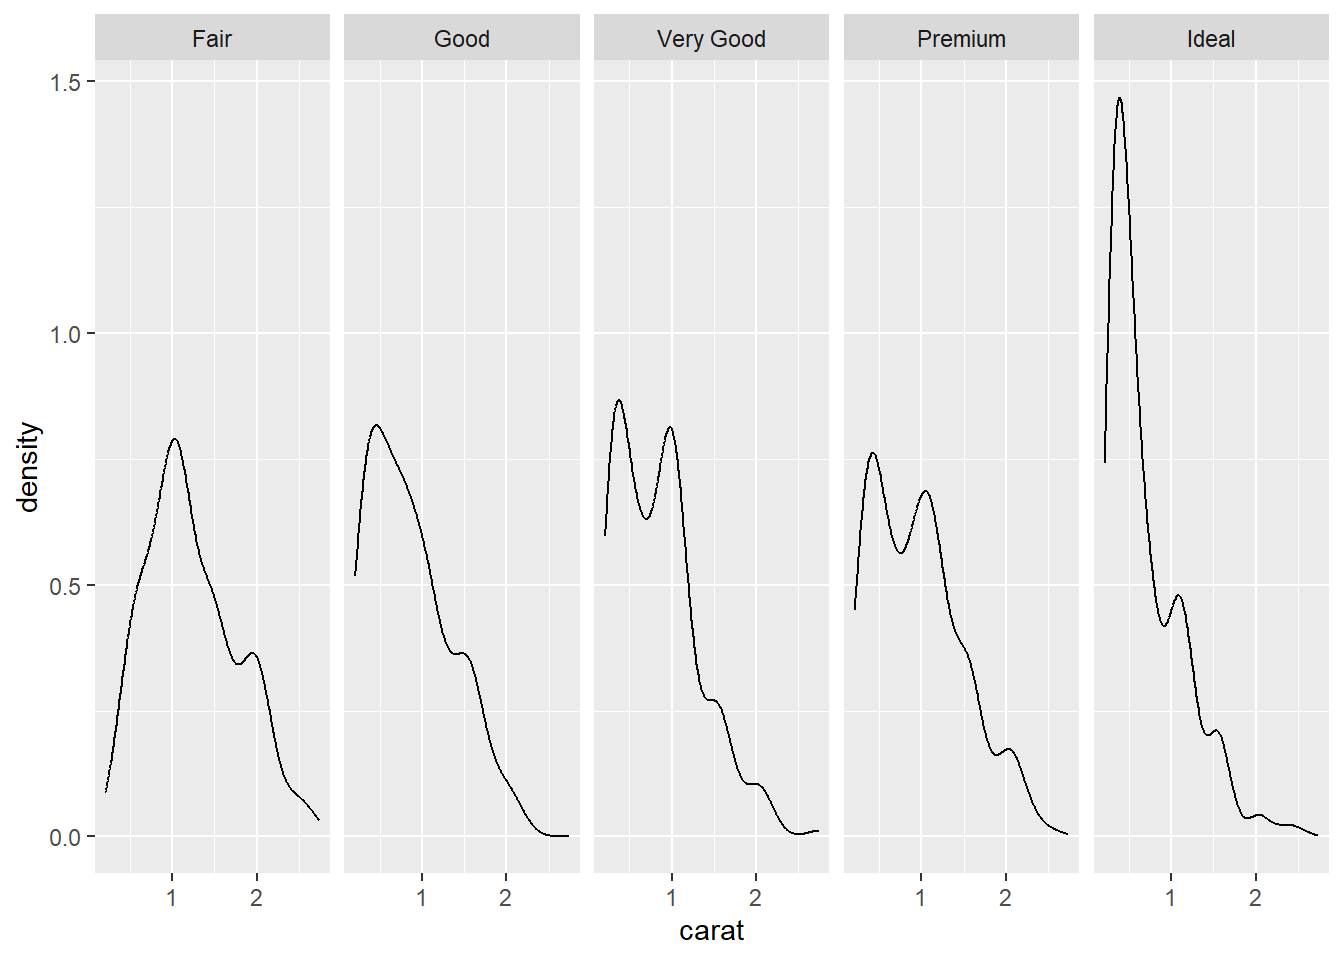
dsmall %>%
  ggplot(aes(x = carat, fill = cut)) +
  geom_histogram() +
  facet_grid(cut ~ .)
## `stat_bin()` using `bins = 30`. Pick better value with `binwidth`.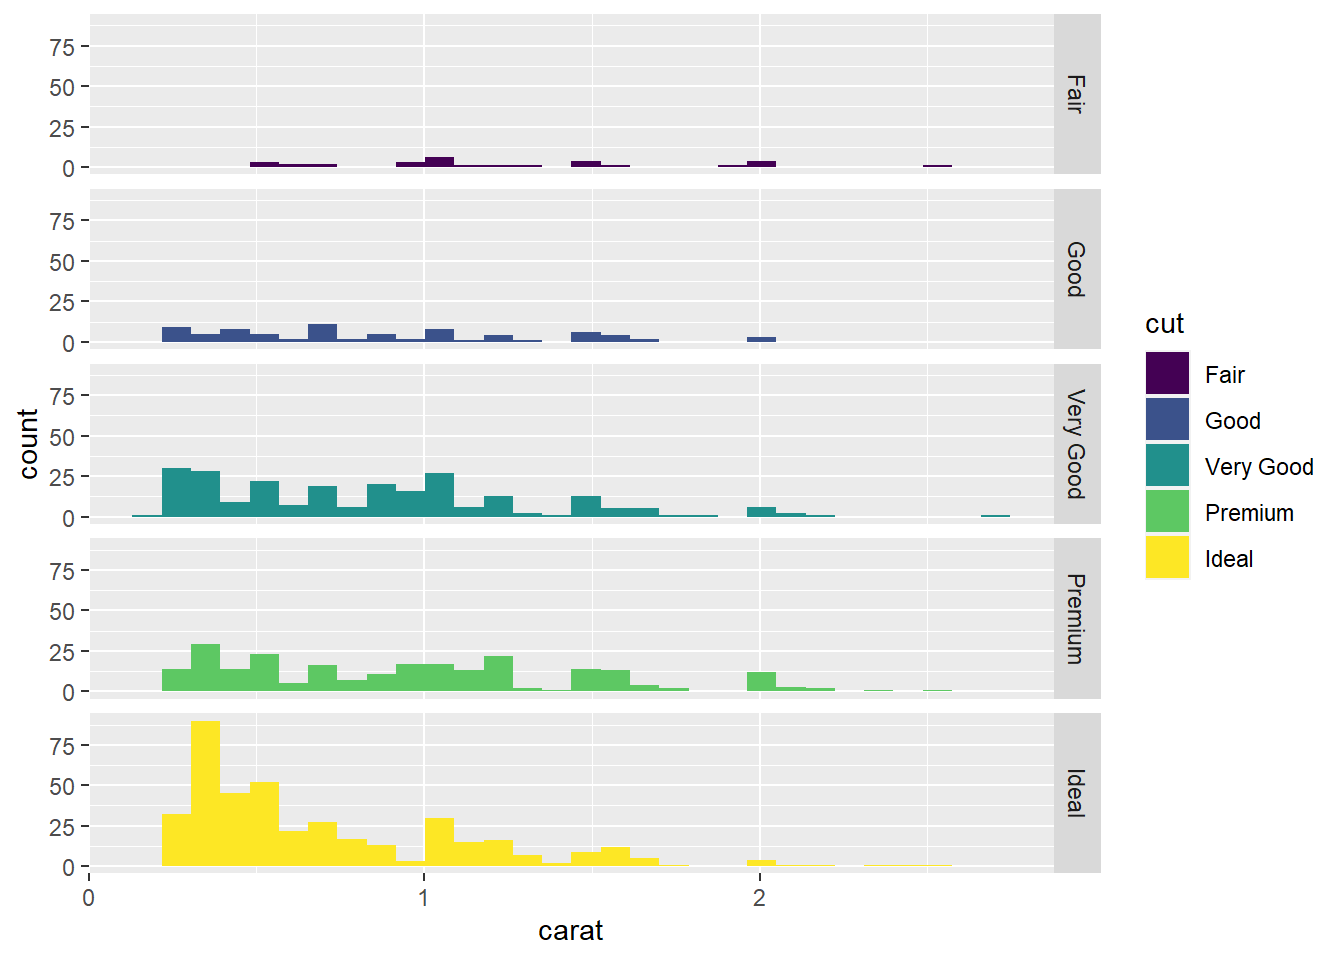
dsmall %>%
  ggplot(aes(x = carat, y = stat(density))) +
  geom_histogram(aes(fill = cut)) +
  geom_density() +
  facet_grid(cut ~ .)
## Warning: `stat(density)` was deprecated in ggplot2 3.4.0.
## ℹ Please use `after_stat(density)` instead.
## This warning is displayed once every 8 hours.
## Call `lifecycle::last_lifecycle_warnings()` to see where this warning was
## generated.## `stat_bin()` using `bins = 30`. Pick better value with `binwidth`.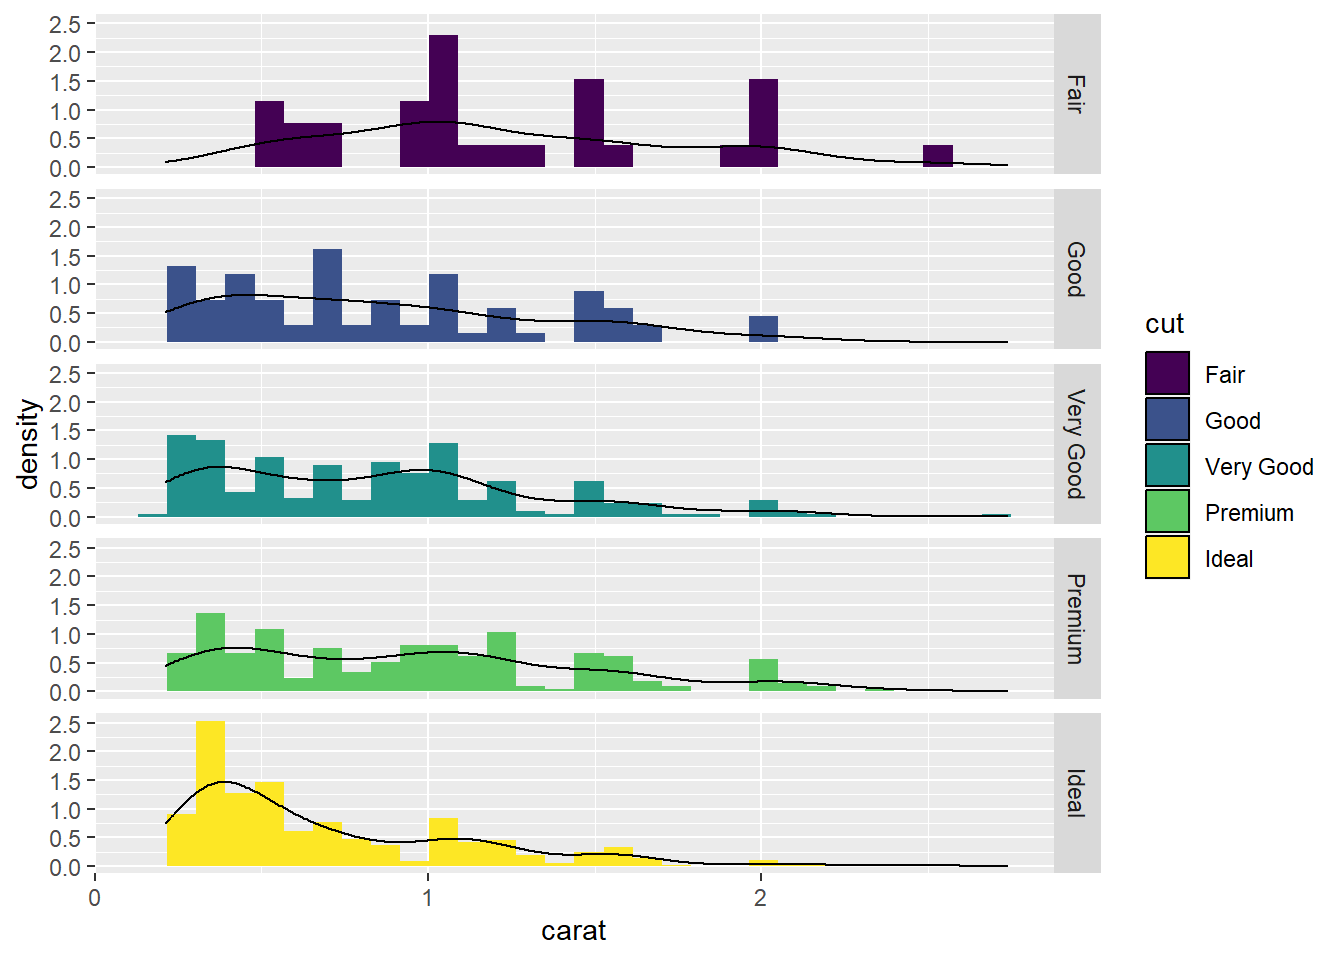
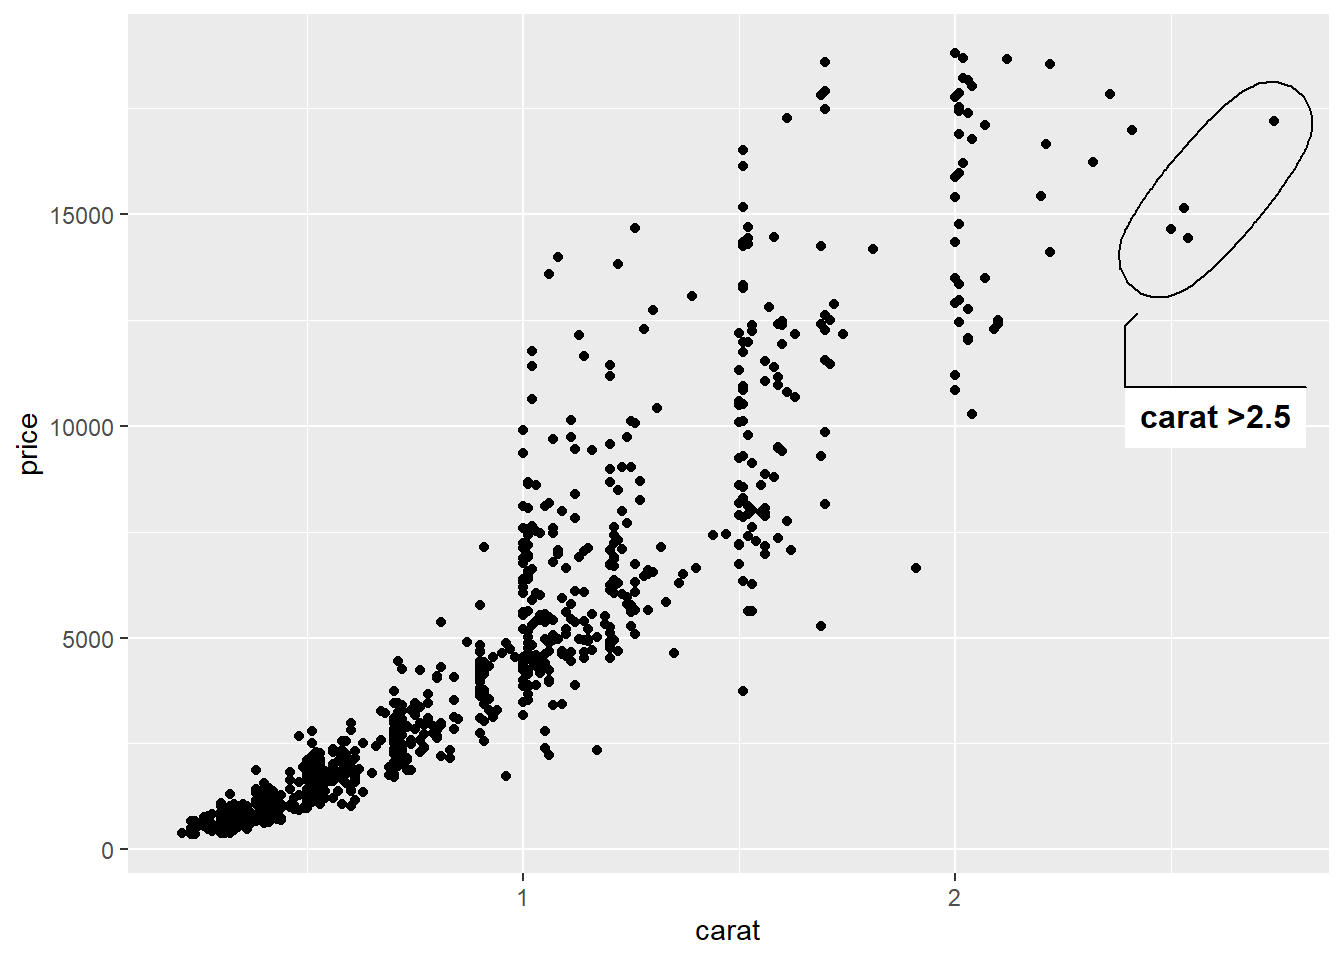
3.5 图上标注文本
#在图上用文本标注
library(ggforce)
dsmall %>%
  ggplot(aes(x = carat, y = price)) +
  geom_point() +
  ggforce::geom_mark_ellipse(aes(
    filter = carat > 2.5,
    label = "carat >2.5"))
## Warning: Using the `size` aesthetic in this geom was deprecated in ggplot2 3.4.0.
## ℹ Please use `linewidth` in the `default_aes` field and elsewhere instead.
## This warning is displayed once every 8 hours.
## Call `lifecycle::last_lifecycle_warnings()` to see where this warning was
## generated.