Chapter 6 Problem 6
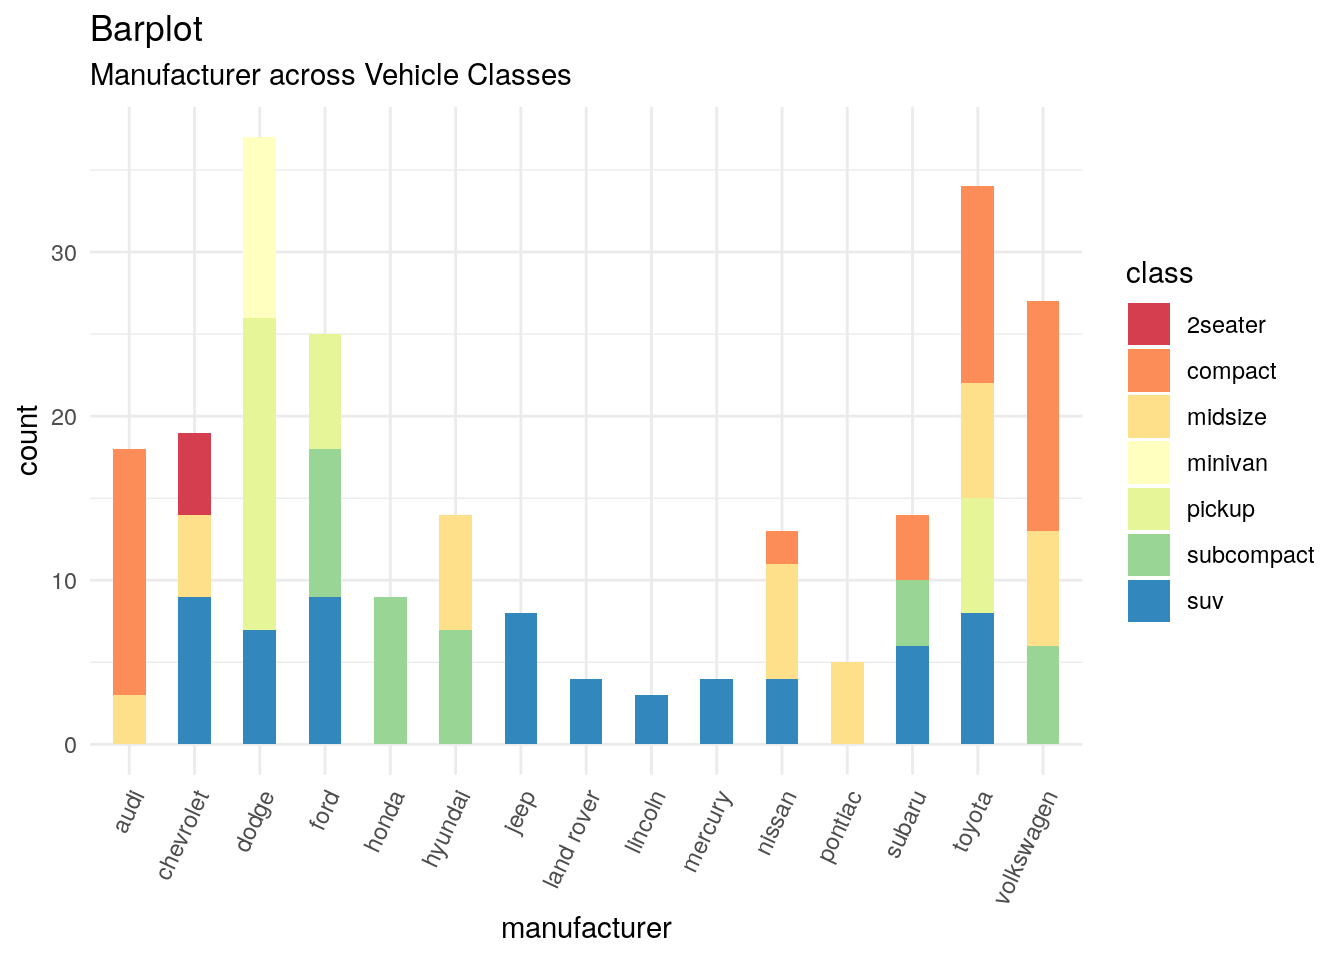
Using the mpg dataset in the ggplot2 package. replicate the plot below using the foolowing settings.
- Set width = 0.6 for the width of bars.
- Rotate tick labels in the x-axis by 65 degree.
- Use palette = “Spectral” for color.
library(RColorBrewer)
ggplot(mpg, aes(manufacturer, fill = class)) +
  geom_bar(width = 0.5) +
  scale_fill_brewer(palette = "Spectral") +
  theme_minimal() +
  theme(axis.text.x = element_text(angle = 65, hjust=1)) +
  labs(
    title = "Barplot",
    subtitle = "Manufacturer across Vehicle Classes"
  )