Chapter 5 Problem 5
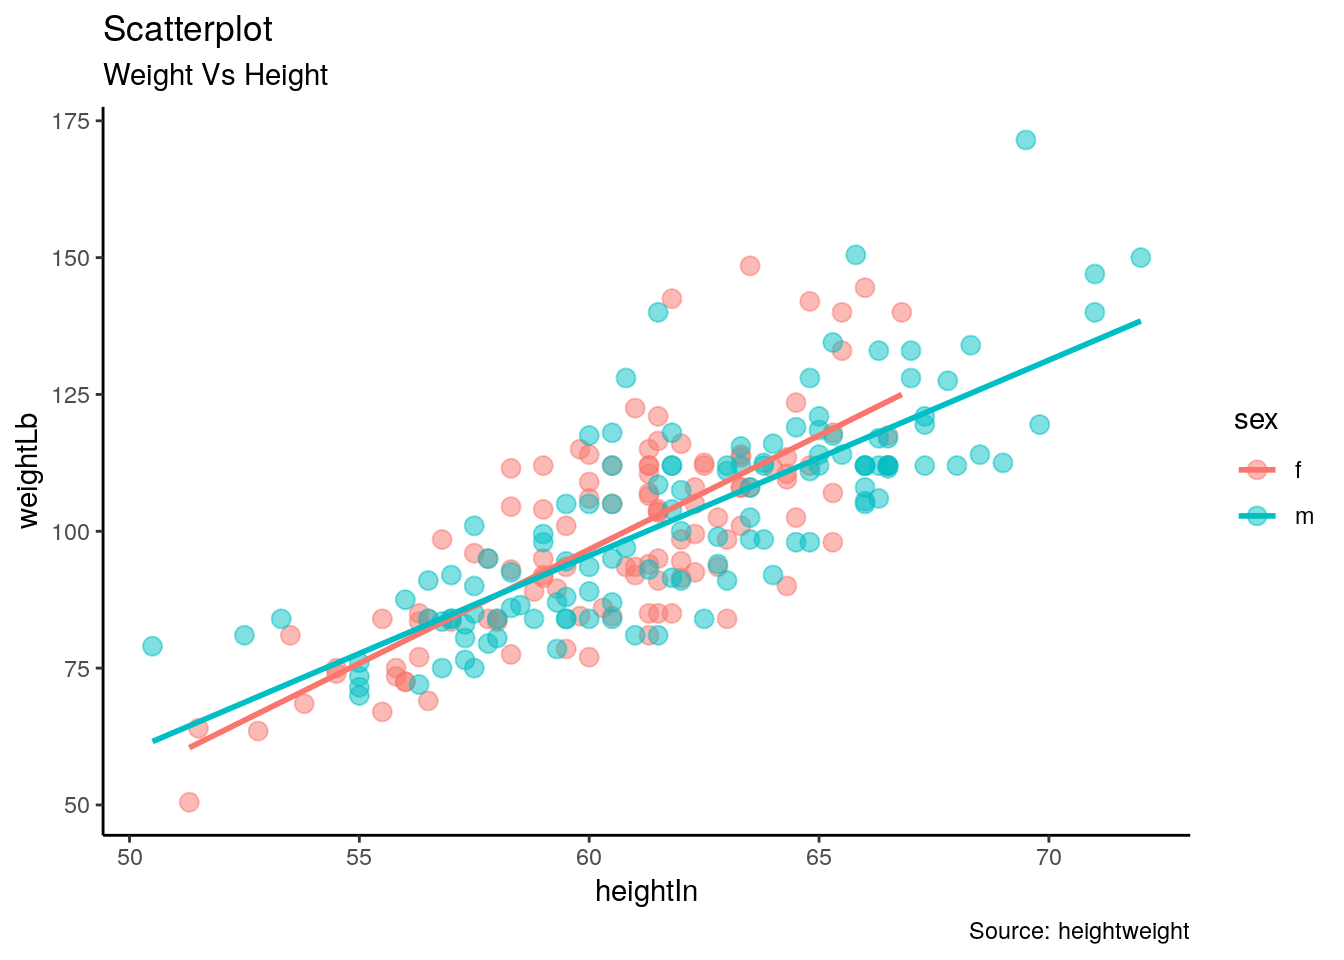
sing the heightweight dataset in the gcookbook package. replicate the plot below the following settings.
- Set size = 3 of points.
- Set alpha = 0.5
- Use theme_classic()
library(gcookbook)
ggplot(heightweight, aes(heightIn, weightLb, color = sex)) +
  geom_point(size = 3, alpha = 0.5) +
  theme_classic() +
  geom_smooth(se = FALSE, method="lm") +
  labs(
    title = "Scatterplot",
    subtitle = "Weight Vs Height",
    caption = "Source: heightweight"
  )