Chapter 3 Problem 3
Using the midwest dataset in the ggplot2 package. replicate the plot below using the following settings.
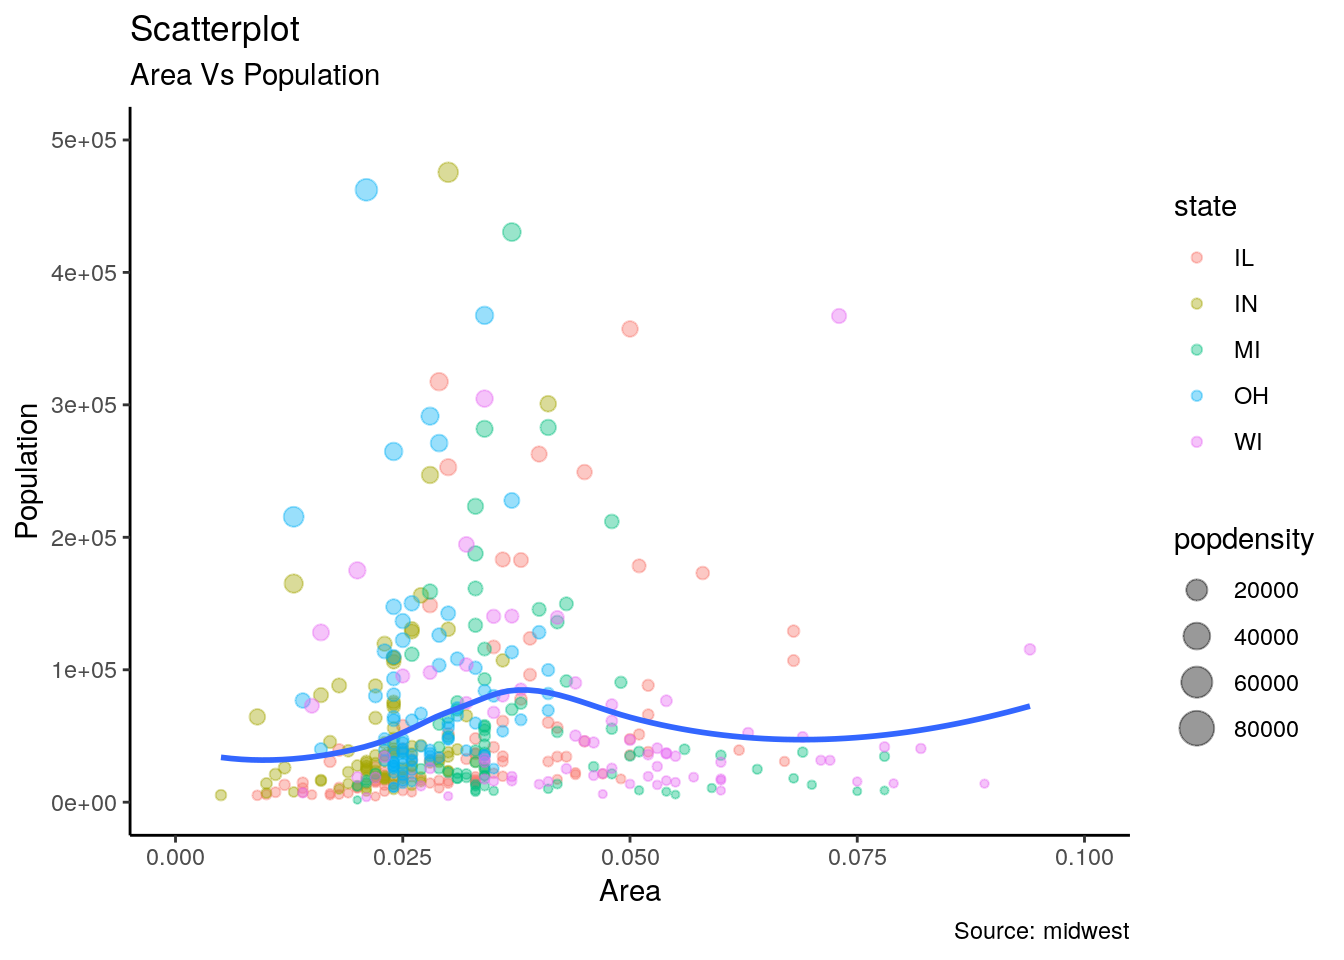
- Map x = area and y = poptotal
- Set alpha = 0.4
- Set the limit of x-axis is c(0, 0.1)
- Set the limit of y-axis is c(0, 500000)
- Use se = FALSE option within geom_smooth() to remove confidence bands.
- Use theme_classic()
ggplot(midwest, aes(area, poptotal)) +
  geom_point(aes(color = state, size = popdensity), alpha  = 0.4) +
  scale_x_continuous(name = "Area", limits = c(0, 0.1)) +
  scale_y_continuous(name = "Population", limits = c(0, 500000)) +
  geom_smooth(se = FALSE) +
  theme_classic() +
  labs(
    title = "Scatterplot",
    subtitle = "Area Vs Population",
    caption = "Source: midwest"
  )
## `geom_smooth()` using method = 'loess' and formula 'y ~ x'## Warning: Removed 15 rows containing non-finite values (stat_smooth).## Warning: Removed 15 rows containing missing values (geom_point).