Chapter 4 Box plots
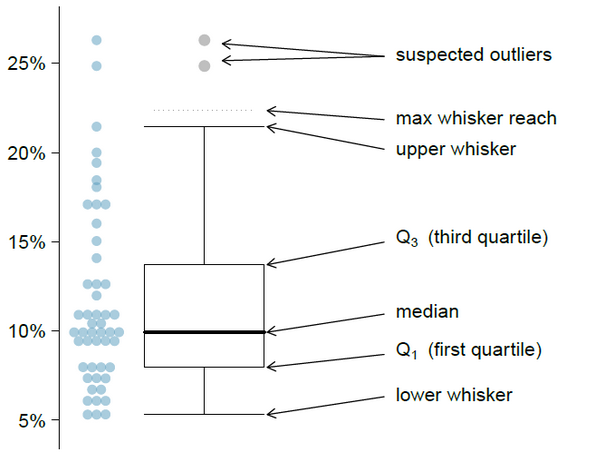
Figure 4.1: Box plot
4.1 Exercises
Exercise 4.1 For the orders in the internet shop (orders.csv) calculate and interpret the median of the order amount, the lower (first) quartile, the upper (third) quartile, the 10th percentile and the 90th percentile. What is the IQR?
Exercise 4.2 For the speed radar data (SpeedRadarData.csv) calculate and interpret the median, the Q1, the Q3 for the
two-wheelers,
passenger cars.
Exercise 4.3 Prepare a box plot for orders.
Exercise 4.4 Compare graphically the speed of passenger cars and two-wheelers using two box plots.
Exercise 4.5 Using data from the green cards (green.csv) compare:
hand spans of males and females,
height of males and females,
video watching time for males and females,
video watching time on Sundays and Mondays.
4.2 Spreadsheet templates:
Boxplot template in Google sheets: https://docs.google.com/spreadsheets/d/1yIptIJw_mEU_wDCe_eghDCc09udtdh03_d8adU6v69A/edit?usp=sharing
Similar template for the box plot in Excel: Boxplot_template.xlsx