Autocorrelation
Readings: FPP3 Sections 2.7-2.9, 4.2, 4.5
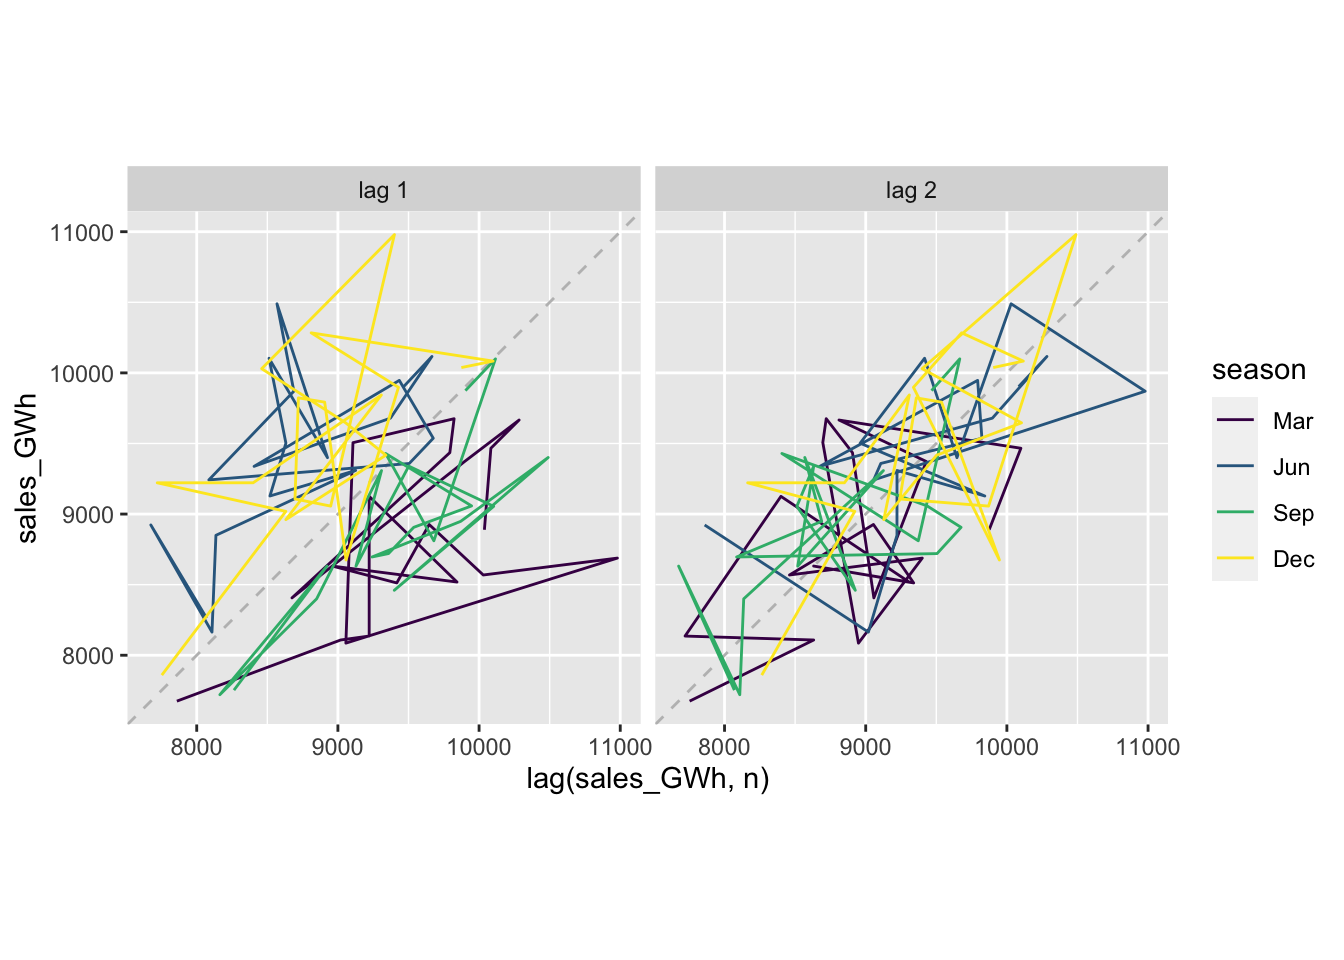
vaelsales_tbl_ts %>% filter(month(Month) %in% c(3,6,9,12)) %>% gg_lag(sales_GWh, lags = 1:2)

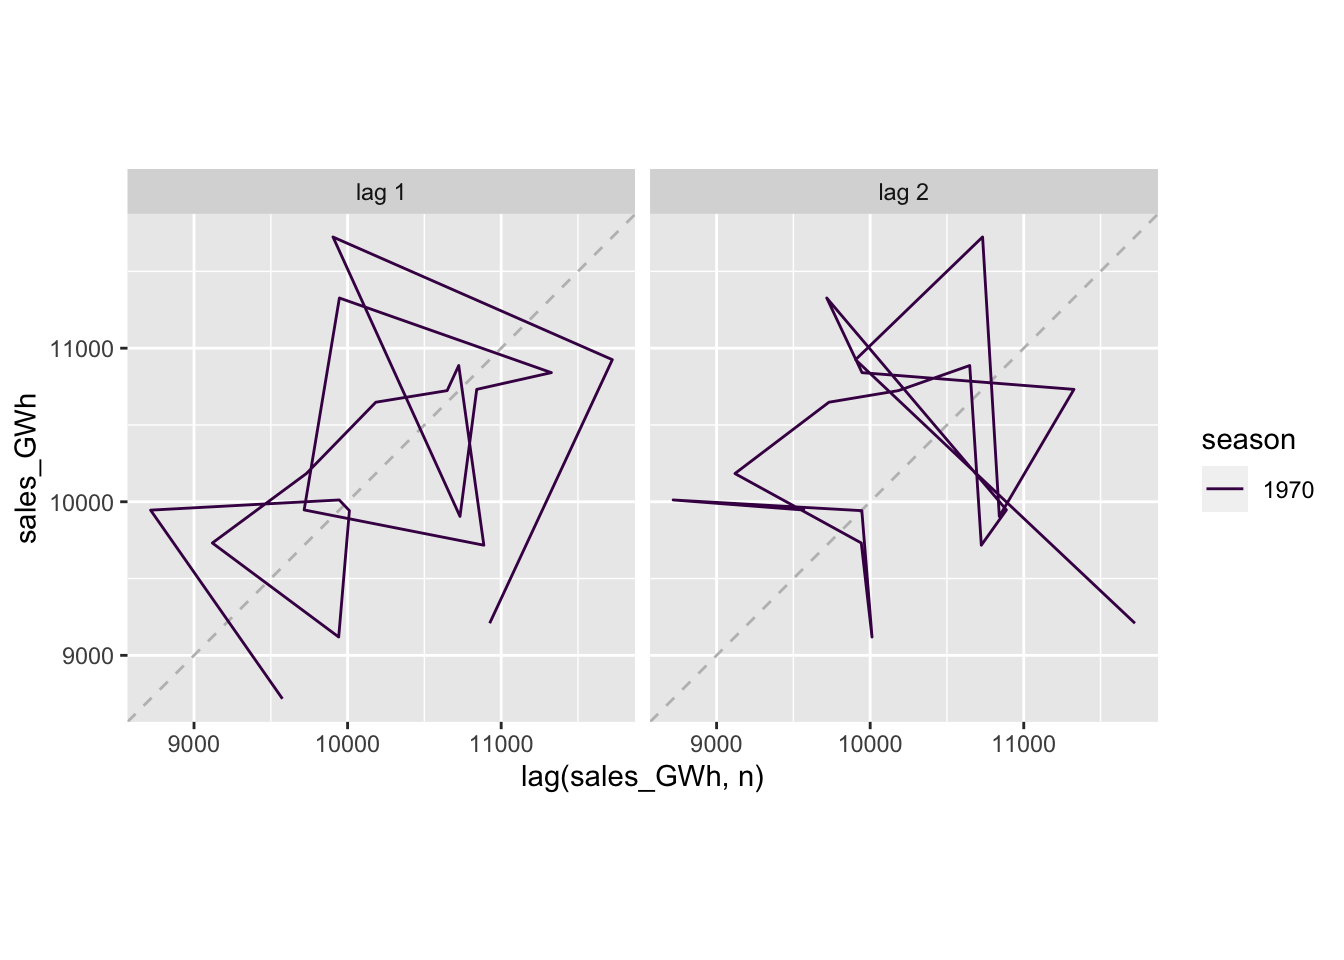
vaelsales_tbl_ts %>% filter(month(Month) == 1) %>% gg_lag(sales_GWh, lags = 1:2)

vaelsales_tbl_ts %>% ACF(sales_GWh) %>% autoplot()

Heere be monsters
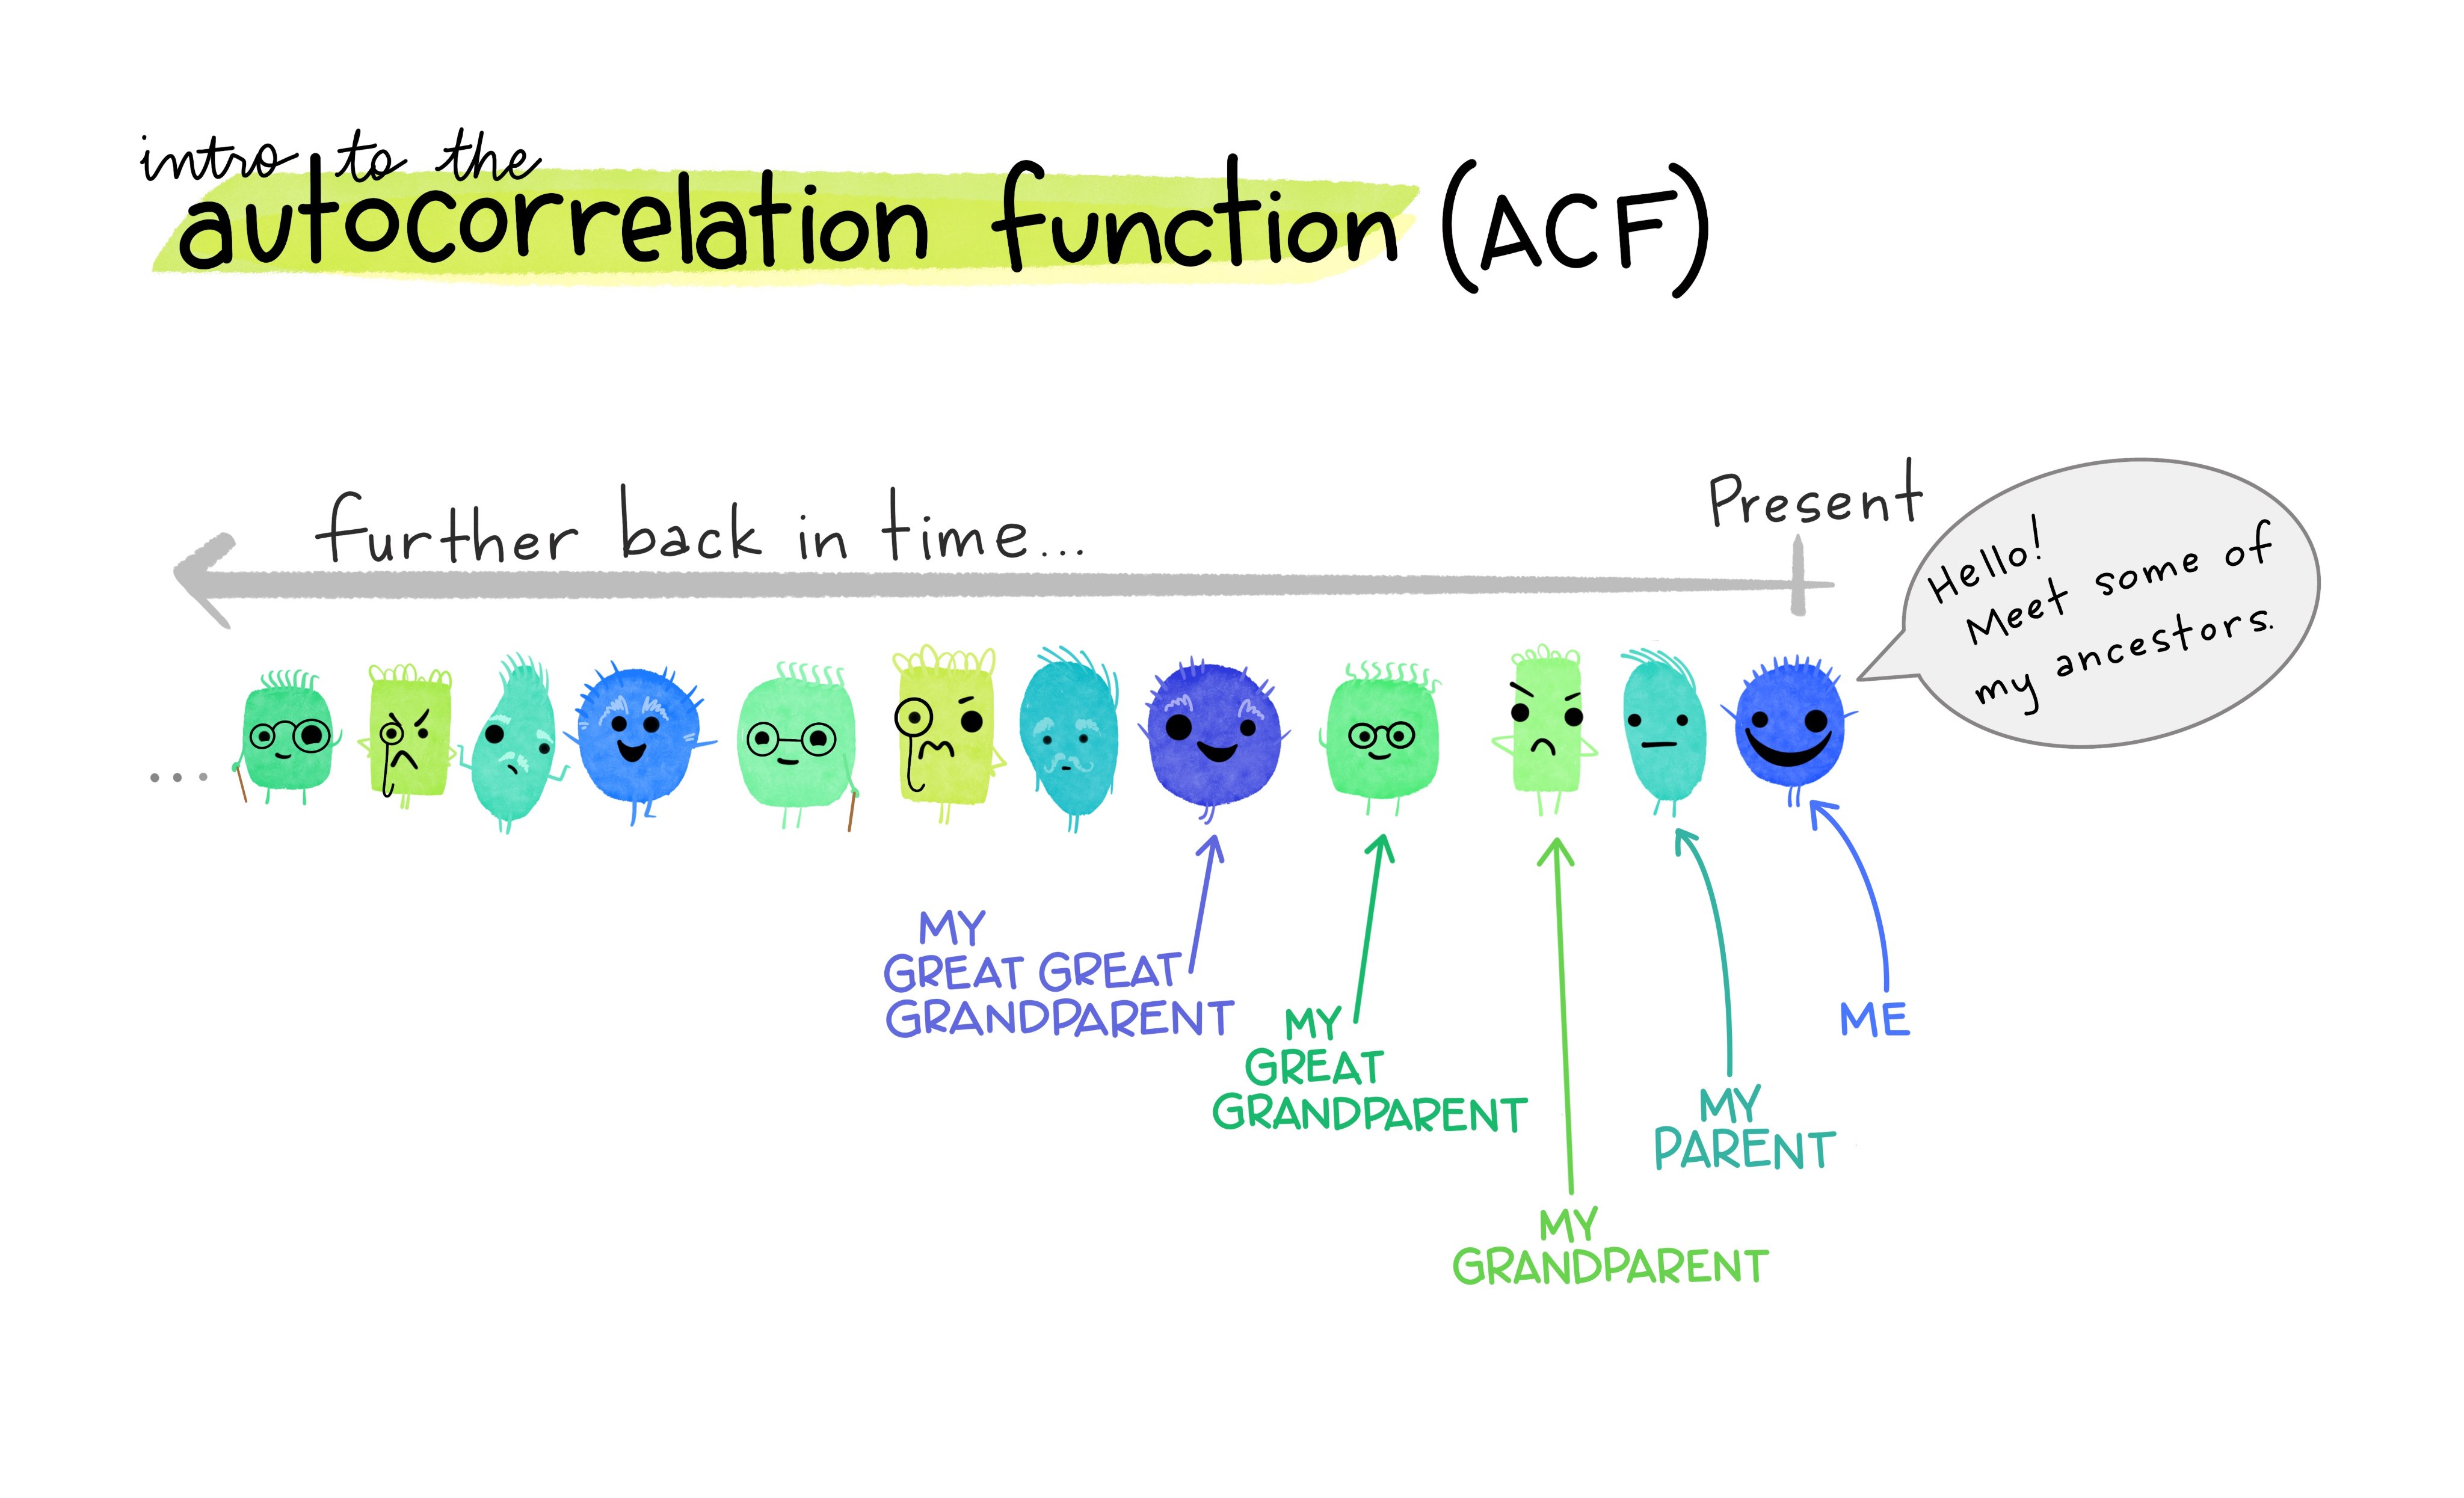
knitr::include_graphics("graphics/horst_acf/horst_acf_1.jpg")


