Chapter 7 Laboratory 2: Weather
7.1 Introduction
In recent lectures, we have discussed the earth’s energy balance and basics of precipitation formation and other meteorological phenomena. The main learning objectives of this lab are for you to 1) become familiar with different types of instrumentation used in environmental science (specifically here, in climate and weather science), and 2) to learn how to manipulate and make calculations with large datasets using spreadsheet software.
Weather is what we call the condition of the atmosphere at any particular time and place. Constantly changing, it is comprised of a number of variables, including:
- Humidity
- Precipitation
- Wind speed and direction
- Atmospheric pressure
- Air temperature
- Radiative or energy fluxes (such as insolation – incoming solar radiation)
1. Humidity can loosely be defined as the amount of water vapour in the air. In actuality, there are three main measurements of humidity: relative, absolute, and specific humidity, but relative humidity is the most often used. Relative humidity refers to the ratio of the amount of water vapour actually in the air to the maximum amount of water vapour required for saturation at that particular temperature and pressure—in other words, how close the air is to being saturated with vapour. Relative humidity can be used in conjunction with temperature to approximate the dew point—the atmospheric temperature at which a particular air mass will be saturated (100% relative humidity) with respect to water vapour—with the following formula developed by Mark G. Lawrence in 2005:
\[\begin{equation} T_{dew} = T_{air} – \frac{(100-RH)}{5} \tag{7.1} \end{equation}\]where:
- \(T_{dew}\) is the dew point in \(^\circ\)C
- \(T_{air}\) is temperature in \(^\circ\)C
- \(RH\) is relative humidity in %
If you know the dew point, you can calculate the actual vapour pressure (e) of the air mass using the formula:
\[\begin{equation} e = 6.11 \times 10^\frac{(7.5\times T_{dew})}{(237.3+T_{dew})} \tag{7.2} \end{equation}\]where:
- \(e\) is the vapour pressure in millibars (mb)
- \(T_{dew}\) is the dew point in \(^\circ\)C
Once you have the vapour pressure, it is relatively easy to calculate the humidex (how hot the weather feels to the average person) with the following formula:
\[\begin{equation} Humidex = T_{air} + 0.5555(e -10) \tag{7.3} \end{equation}\]where:
- \(T_{air}\) is the air temperature in \(^\circ\)C
- \(e\) is the vapour pressure in mb
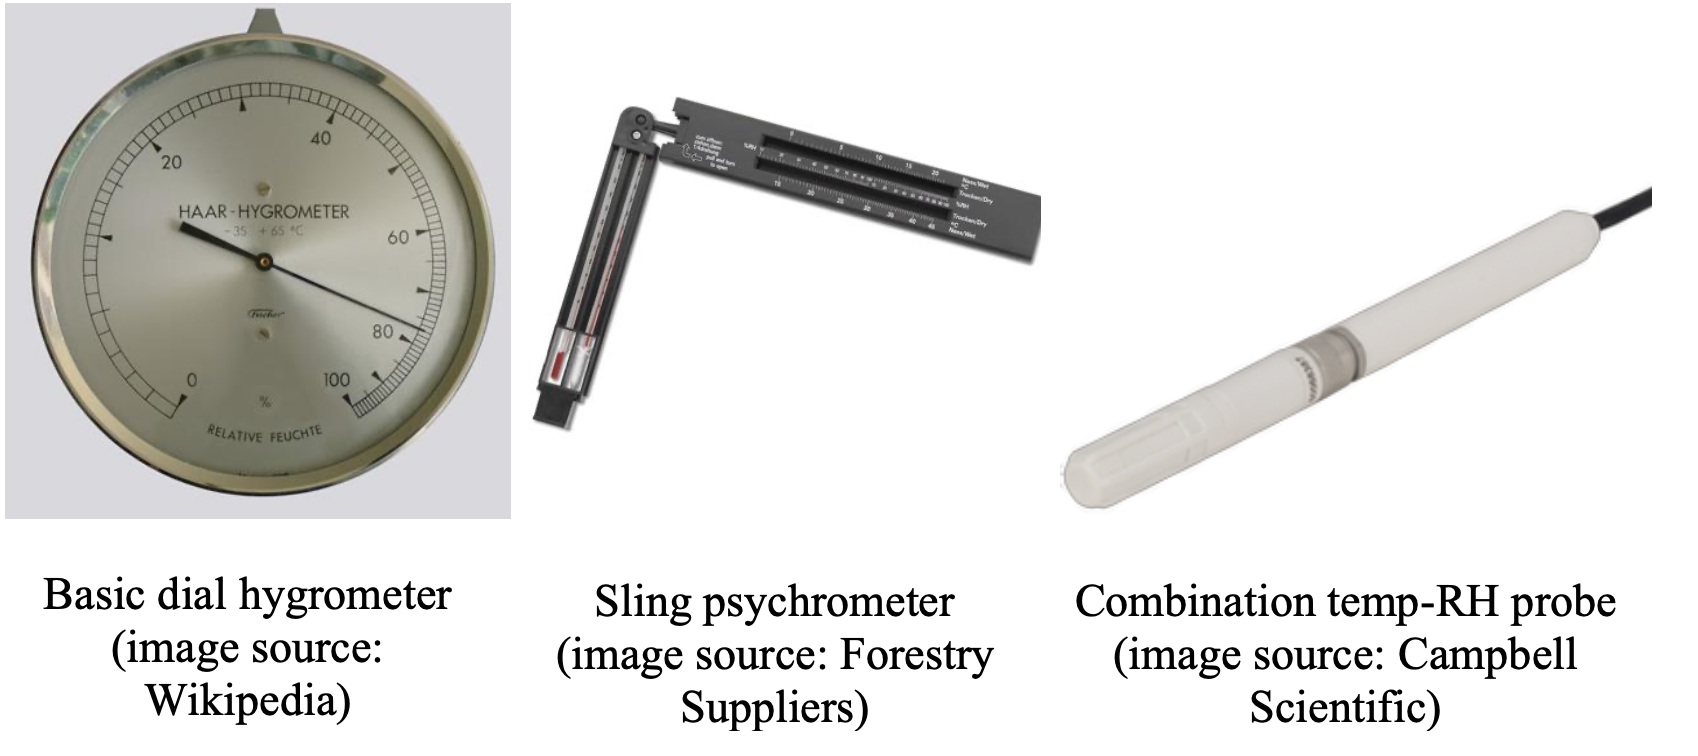
Figure 7.1: Weather instruments that measure humidity.
2. Precipitation is either liquid or solid water particles falling from clouds to the Earth’s surface by the force of gravity. These liquid or solid particles are better known as rain, snow, or hail. Commonly, rain is measured using rain gauges and snow by a variety of techniques, including snow gauges (Figure 7.2).
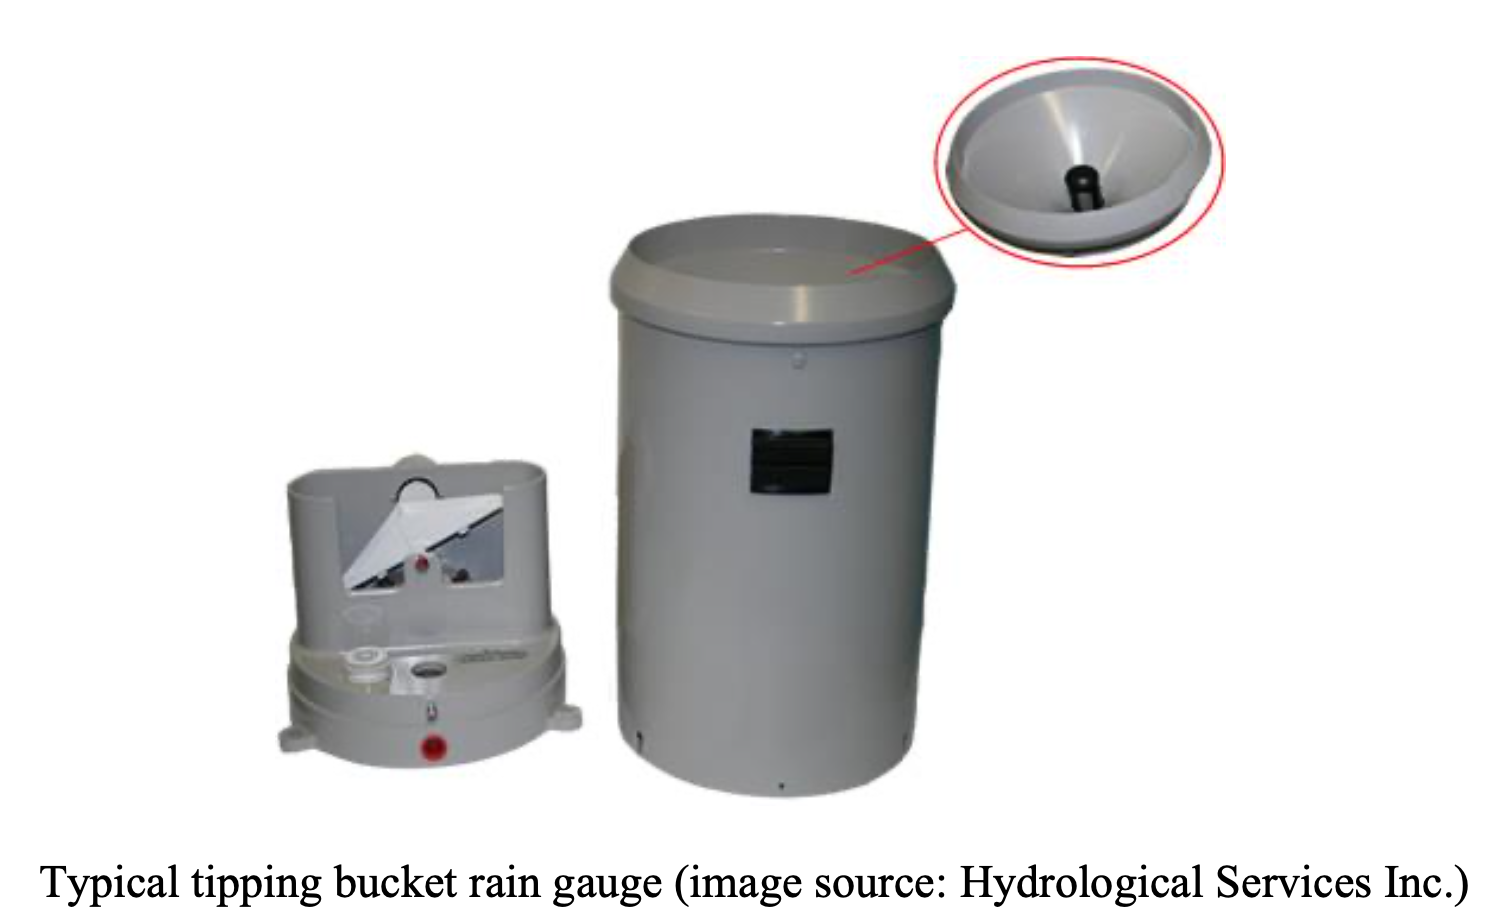
Figure 7.2: A rain gauge.
3. Wind is the horizontal, bulk movement of air on the Earth’s surface. Winds are often discussed with regards to the direction (from which they are blowing) as well as their strength. Weather vanes (Figure 7.3) are used to measure wind direction, whereas anemometers are used to measure wind speed. Sometimes these two instruments can be combined into one instrument that can measure both wind direction and speed (as in the photo below).
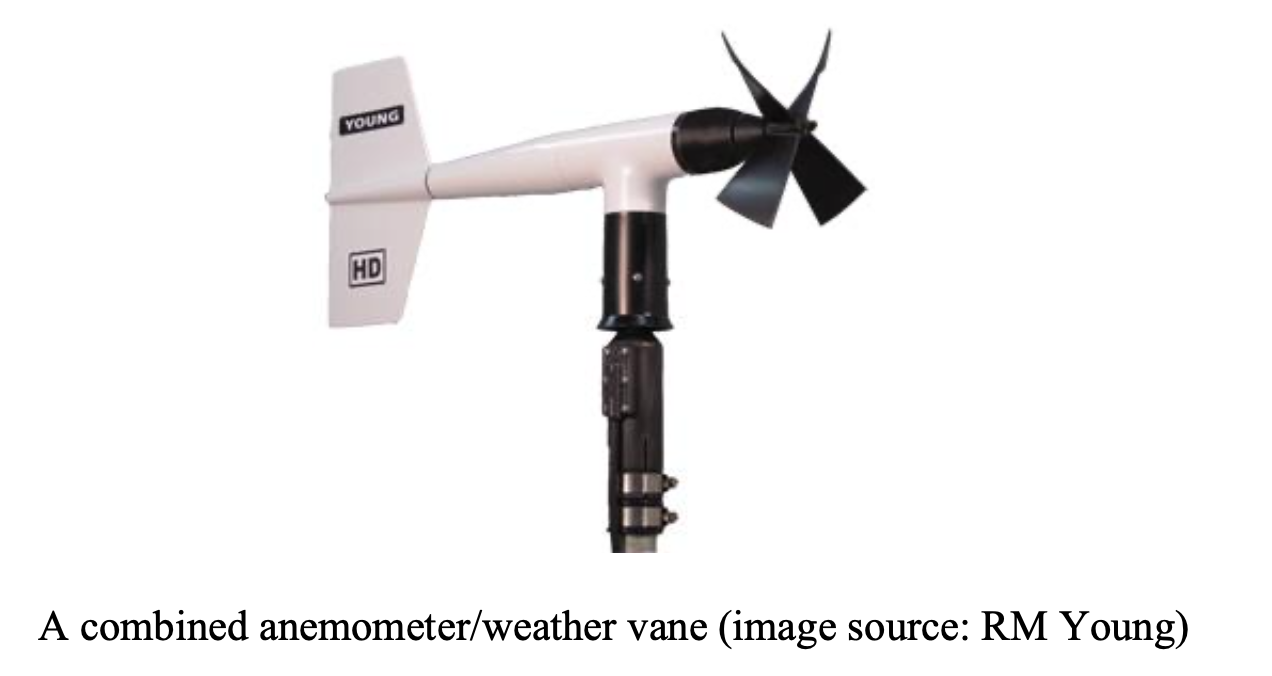
Figure 7.3: A weather vane and anemometer.
4. Atmospheric or barometric pressure is caused by the pressure exerted by the weight of the air in the atmosphere of Earth. In other words, it is the amount of force exerted over an area of surface by the air above. The instrument used to measure atmospheric pressure is the barometer (Figure 7.4).
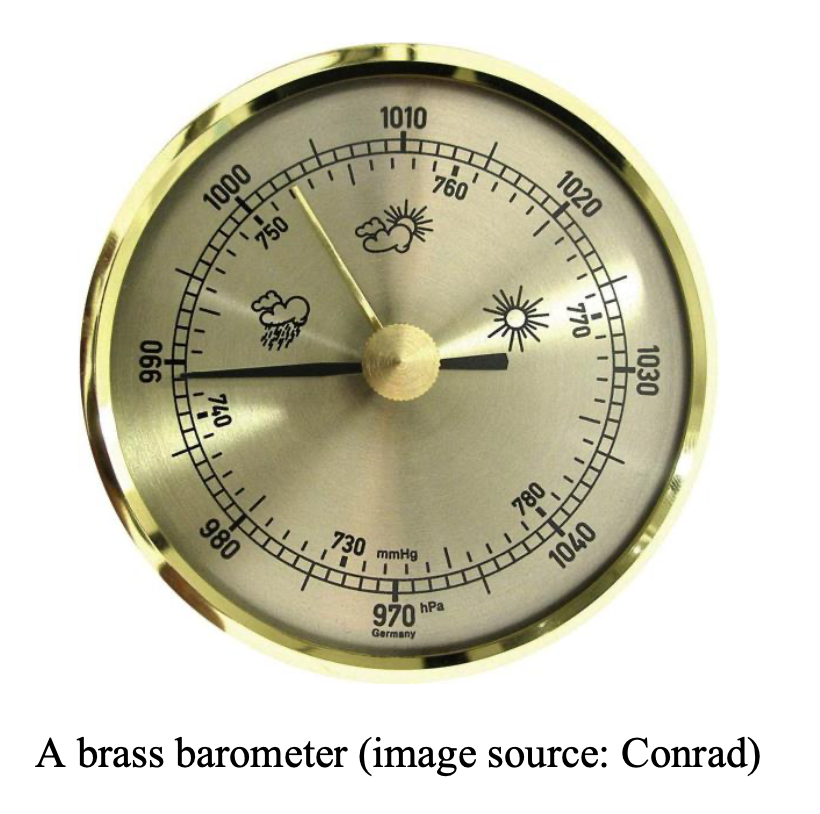
Figure 7.4: A brass barometer.
5. Temperature is a measure of sensible energy (the energy that we can feel) and is one of the more intuitive meteorological measurements to most students. Thermometers (Figure 7.5) and a variety of electronic sensors, such as thermocouples and thermistors, are used to measure temperature.
Figure 7.5: A mercuric weather thermometer.
6. Incoming solar radiation (“insolation”), or the energy flux hitting the earth’s surface from the Sun, can be measured using a pyranometer. Instruments for measuring all of the above variables can be found both at the demonstration plot behind the Science Research Building and at the UTSC Weather Station on top of the Science Wing. This station provides data for DPES and even has its own twitter account at UTSC_weather, which posts autonomously four times a day with weather updates.
Due to COVID-19 restrictions, we will not conduct in-person tours to UTSC’s weather station. Instead, we have included a ‘Virtual’ weather station tour. Please see Video 7.1 below.

7.2 Assignment #2 Questions
Assignment 2 is 45 marks total – worth 15% of your final grade.
Please submit a pdf version of your assignment on Quercus under “Lab 2 submission”. Your lab 2 assignment is due by Friday October 23, 4:00 pm.
Using the data provided from the UTSC weather station for the months of June and July of 2019 (available in the “Assignments” Module on the Quercus page), answer the following questions.
- Download the two data files from UTSC’s weather station, which present daily weather data for the months of June and July. These files are titled “EESA01 2020 Lab 2 June 2019 data.xlsx”, and “EESA01 2020 Lab 2 July 2019 data.xlsx”, respectively, and both present the following meteorological variables:
- Average temperature in \(^\circ\)C (AirTC_AVG)
- Relative humidity in % saturation (RH)
- Barometric Pressure in kPa (BP_kPa_AVG)
- Total rainfall in mm (Rain_mm_TOT)
- Average windspeed in kilometers per hour (WS_kph_AVG)
- Wind direction in degrees (\(^\circ\))
- Average solar irradiance in watts per m2 (SlrW_AVG)
- Total solar irradiance in kilojoules per m2 (SlrkJ_2_TOT)
Using this data, A) calculate average monthly values for June and July separately, for any weather
variables where the average is appropriate; then B) calculate total monthly values for June and July
separately, for any weather variables where a summed value is appropriate. Use the appropriate
Excel functions (see Appendix C). When submitting this question, submit a table (see Appendix D)
for each of June and July data that clearly shows the sums or average values (clearly labeled).
(9 marks)
Calculate mean dew point for every day of both June and July (Refer to equation (7.1) to calculate the dewpoint). What is the mean dewpoint for each month of June and July? Calculate the vapour pressure for every day in both June and July (Refer to equation (7.2) to calculate the vapour pressure). Calculate the humidex for every day in both June and July (Refer to equation (7.3) to calculate the humidex). What is the mean humidex for each month of June and July? Organize your answer in a neat, clearly labeled table. (10 marks)
Using IF/THEN statements (see Appendix C), change the daily average wind direction to quadrants entitled “N”, “S”, “E”, and “W”. For “N”, use >315\(^\circ\) but <45\(^\circ\), for “S”, use >135\(^\circ\) but <225\(^\circ\), for “E”, use >45\(^\circ\) but <135\(^\circ\), and for “W”, use >225\(^\circ\) but <315\(^\circ\). Calculate the dominant wind direction for each month by calculating the “mode”. In your submitted answer, include the formulae (IF/THEN statements) you used to calculate each wind direction. (10 marks)
Make a scatterplot relating mean daily temperature to mean daily solar irradiance. Be mindful of which variables should be on the independent and dependent axes. Add a linear trendline to the data and include both an equation and R2 value for the trendline. Comment on the observed relationship in terms of its strength and why you would or would not expect a good relationship here. See Appendix (E) for more information on constructing a plot. (10 marks)
In less than 10 lines, explain how a vane anemometer works (do some research and use APA style referencing). What two meteorological variables does this instrument measure? See Appendix (F) for more information on APA referencing. (6 marks)