Chapter 9 Laboratory 4: Deforestation and Agriculture
9.1 Introduction
Forests globally have been disappearing at an alarming rate. These losses have had major consequences for Earth’s climate, biogeochemical and water cycles, and biodiversity. While deforestation and forest degradation are a global phenomenon, the loss of tropical forests has been particularly pronounced. For example, one of the most extensively forested countries in the world, and the focus of our assignment here, is Brazil: a country that has seen major forest loss within the Amazonian forest region over the past several decades.
One of the main causes of deforestation globally, and in Brazil particularly, is agricultural expansion: the conversion of natural forested landscapes into food production systems. Agricultural expansion can occur for multiple reasons, including subsistence livelihoods (i.e., small scale agriculture), though major forest loss is commonly attributable to very large-scale industrial agriculture. In the case of Brazil, two primary agricultural land-uses – namely cattle and soybean production – are a major cause of deforestation.
Using Brazil as an example, this lab will introduce students to open access data sources that are available to evaluate 1) patterns of land-use change that are unfolding within countries and across the globe. Based on Microsoft Excel software, we will use this open access data to 2) understand and quantify how both forest land and agricultural land have changed in Brazil over the past 25 years; and 3) understand the role that expansion of cattle and soy farms have played in driving these changes.
Assignment 4 is 27 marks total – worth 15% of your final grade.
This is your FINAL LAB ASSIGNMENT. Please submit a pdf version of your assignment on Quercus under “Lab 4 submission”. Your lab 4 assignment is due by Friday November 20, 4:00 pm.
9.2 Procedure for Laboratory 4 - Part 1/3: Land-use change in Brazil since 1995.
Part 1 data instructions: this is a multiple step process involving three different datasets; two of these datasets will be downloaded from an online source, and then the third will be created by merging these two downloaded datasets.
Visit the Food and Agricultural Organization of the United Nations data portal by clicking here: FAOSTAT website.
Here, click on the “Data” tab and locate the “Agri-environmental indicators” section. Once here, click on the “Land Use Indicators” data tab.
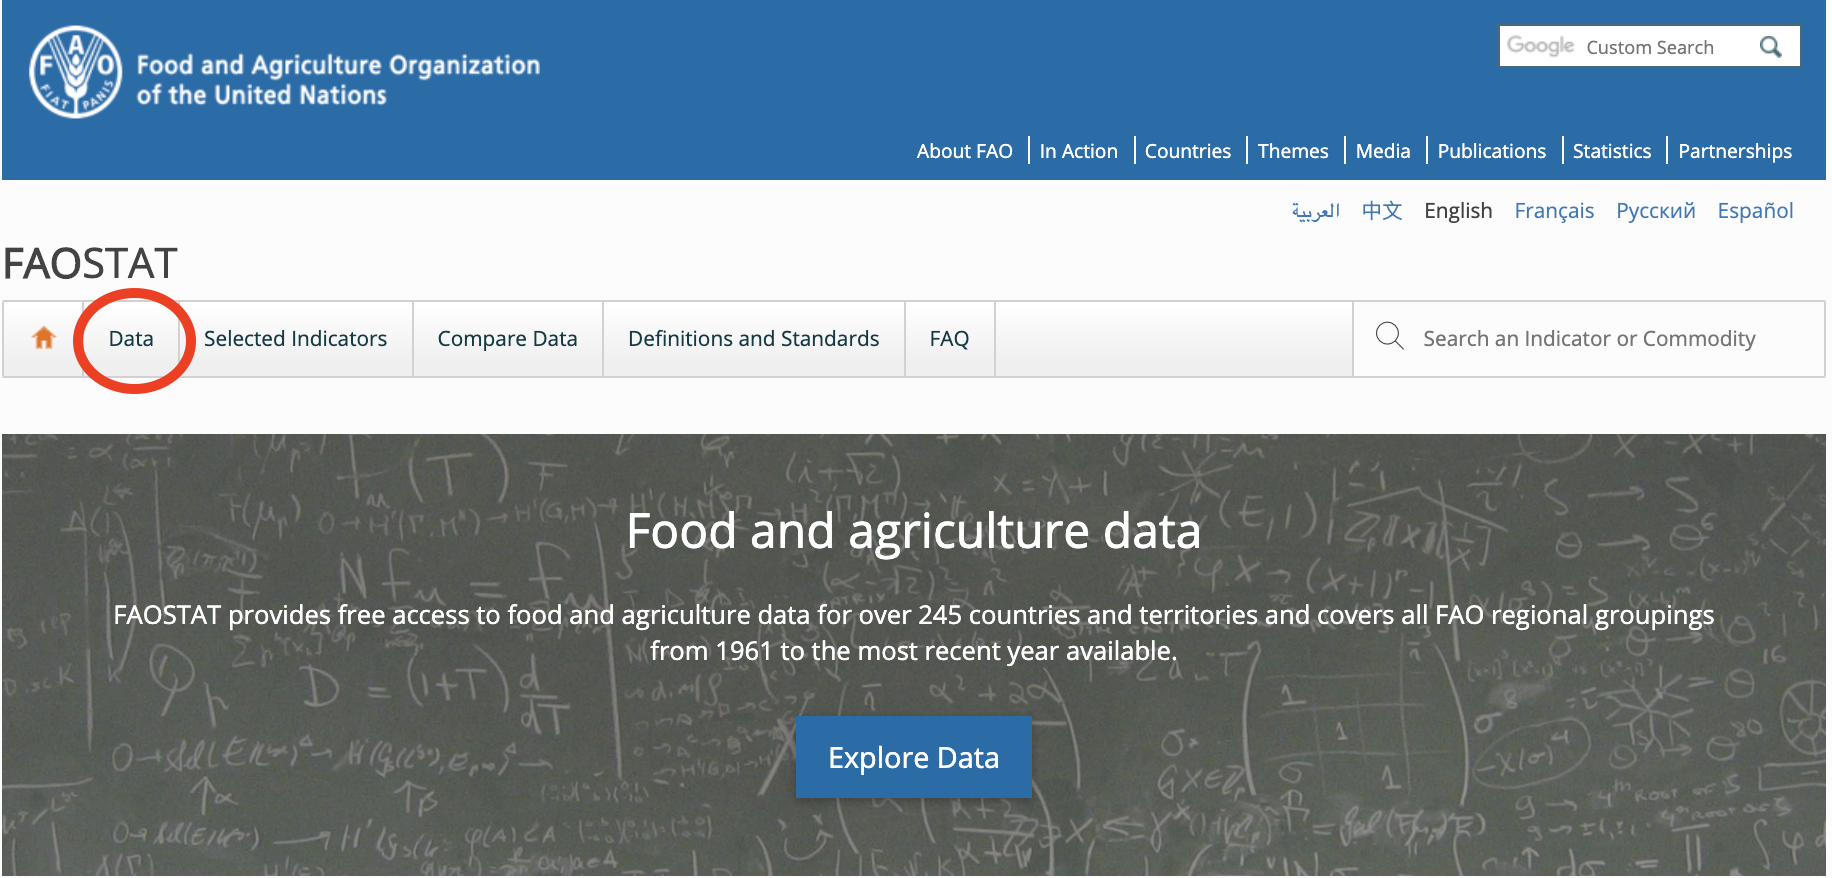
Figure 9.1: FAOSTAT main page. Please click ‘Data’.
*
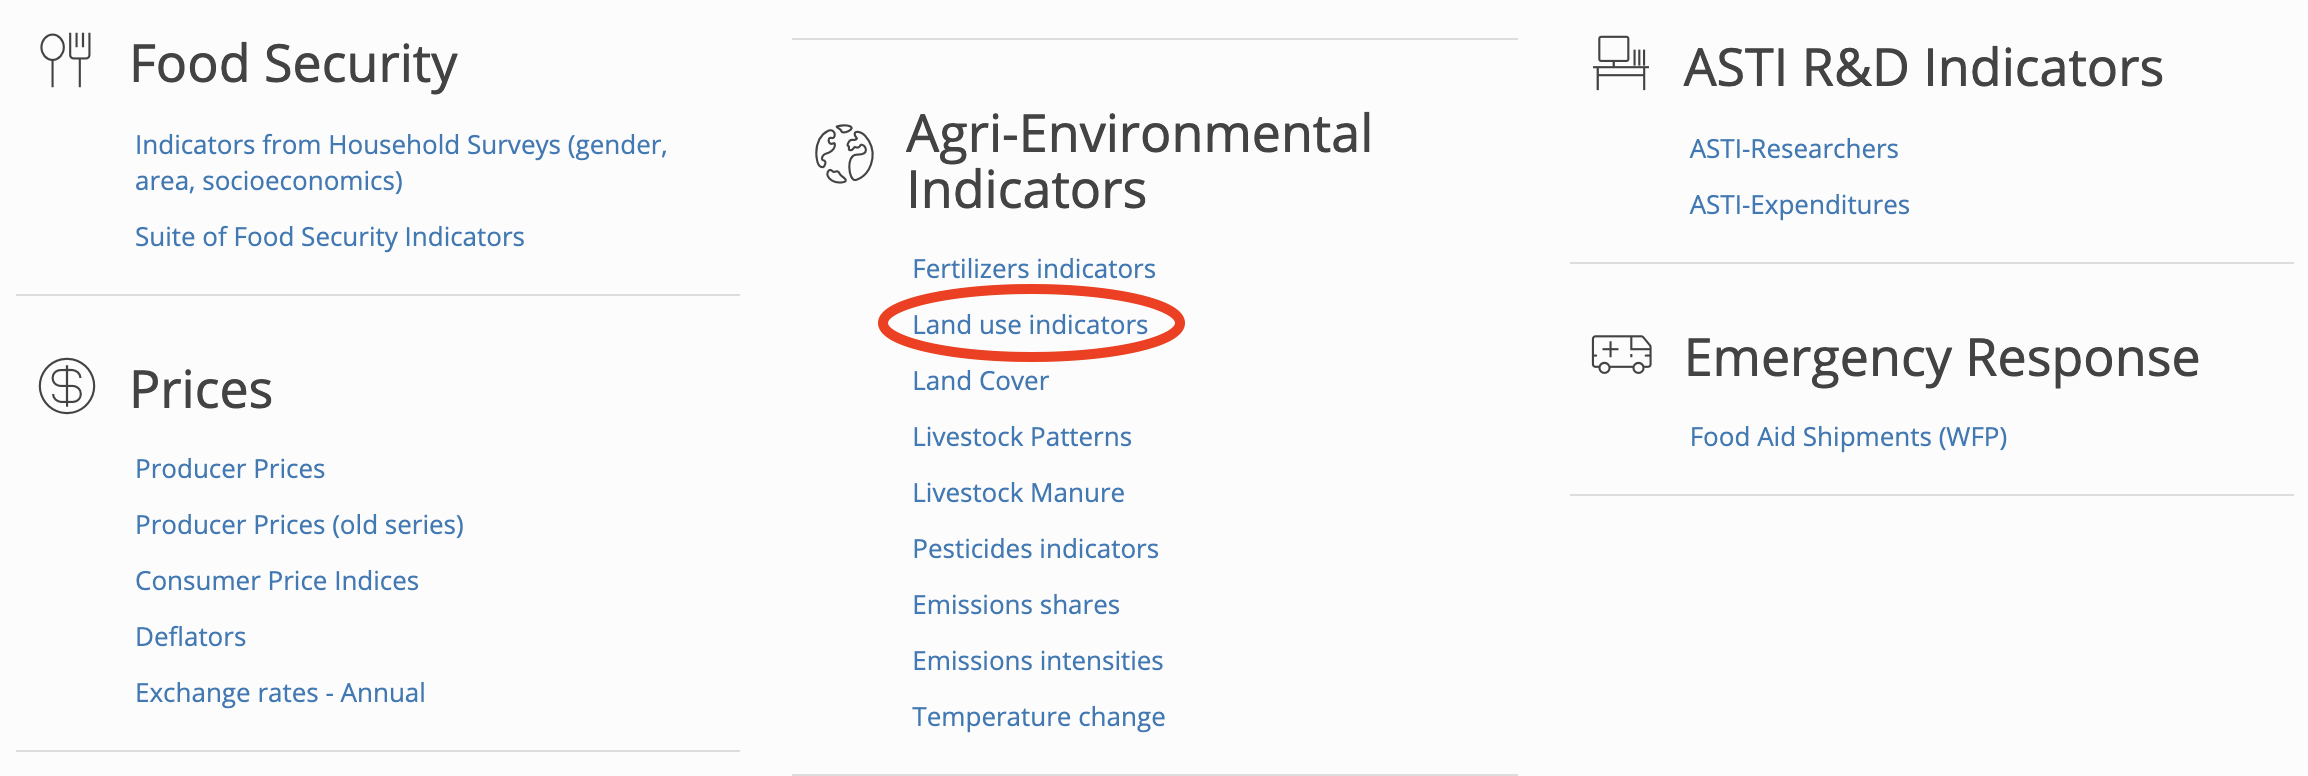
Figure 9.2: Please click ‘Land use indicators’.
- A new page will open that allows you to download datasets for multiple environmental indicators, across different countries, at different time periods.
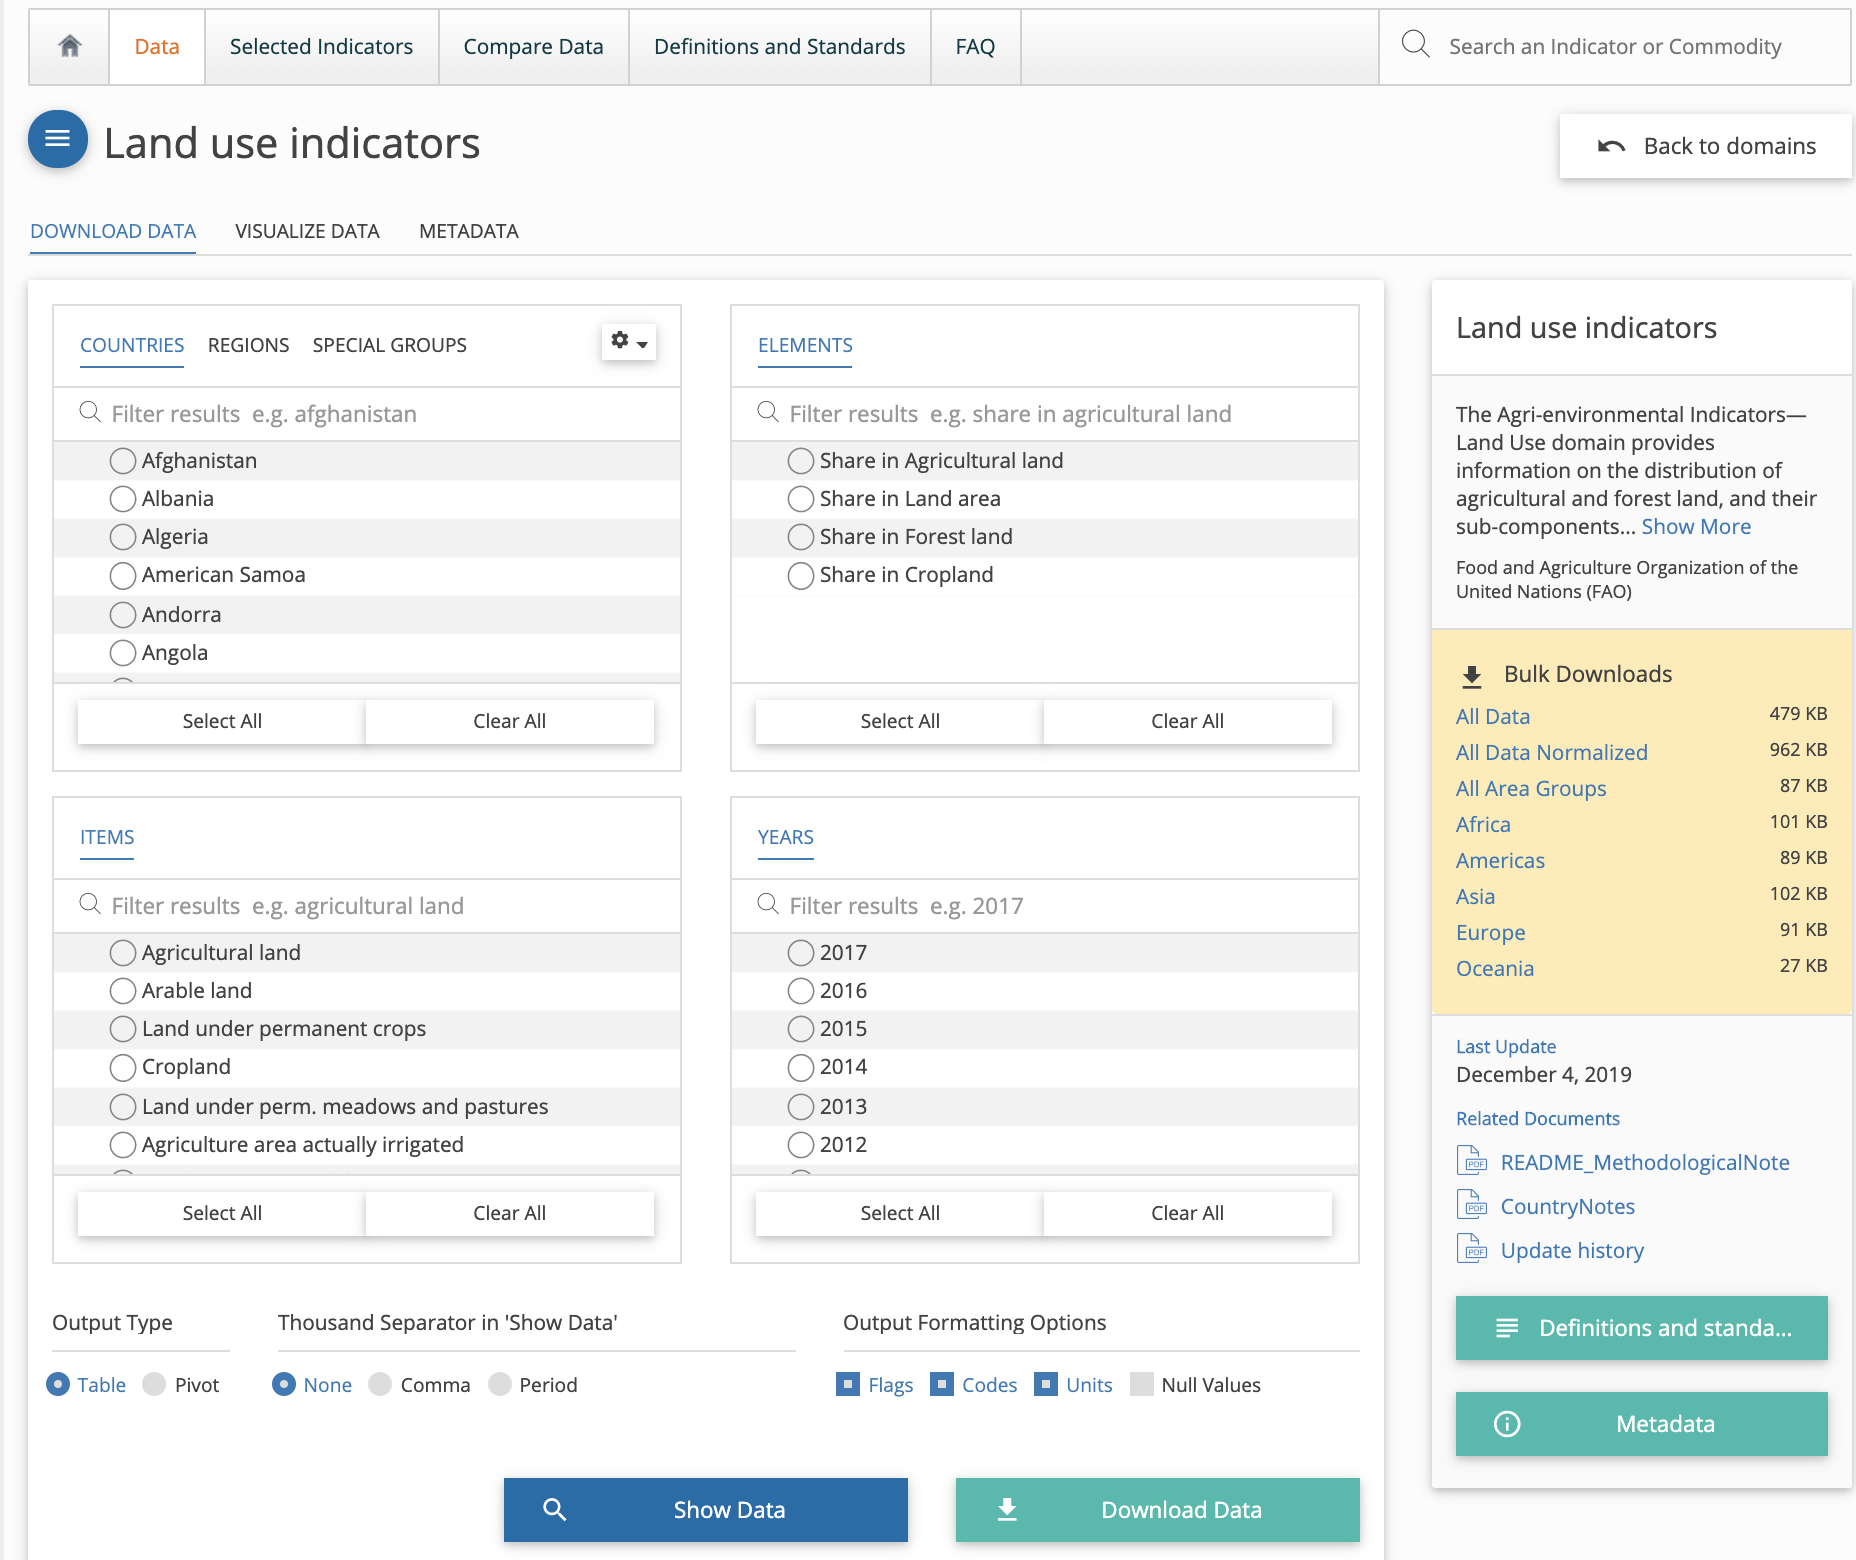
Figure 9.3: Environmental indicators data interface.
- First, we will extract the amount of forest land in Brazil. Do so by requesting data for:
- “Brazil” (in the top left panel).
- “Share in Land Area” (in the top right panel).
- “Forest Land” (in the bottom left panel).
- Select years from 1995-2017 (in the bottom right panel; please note you have to select these years manually, by clicking/ highlighting each year individually).
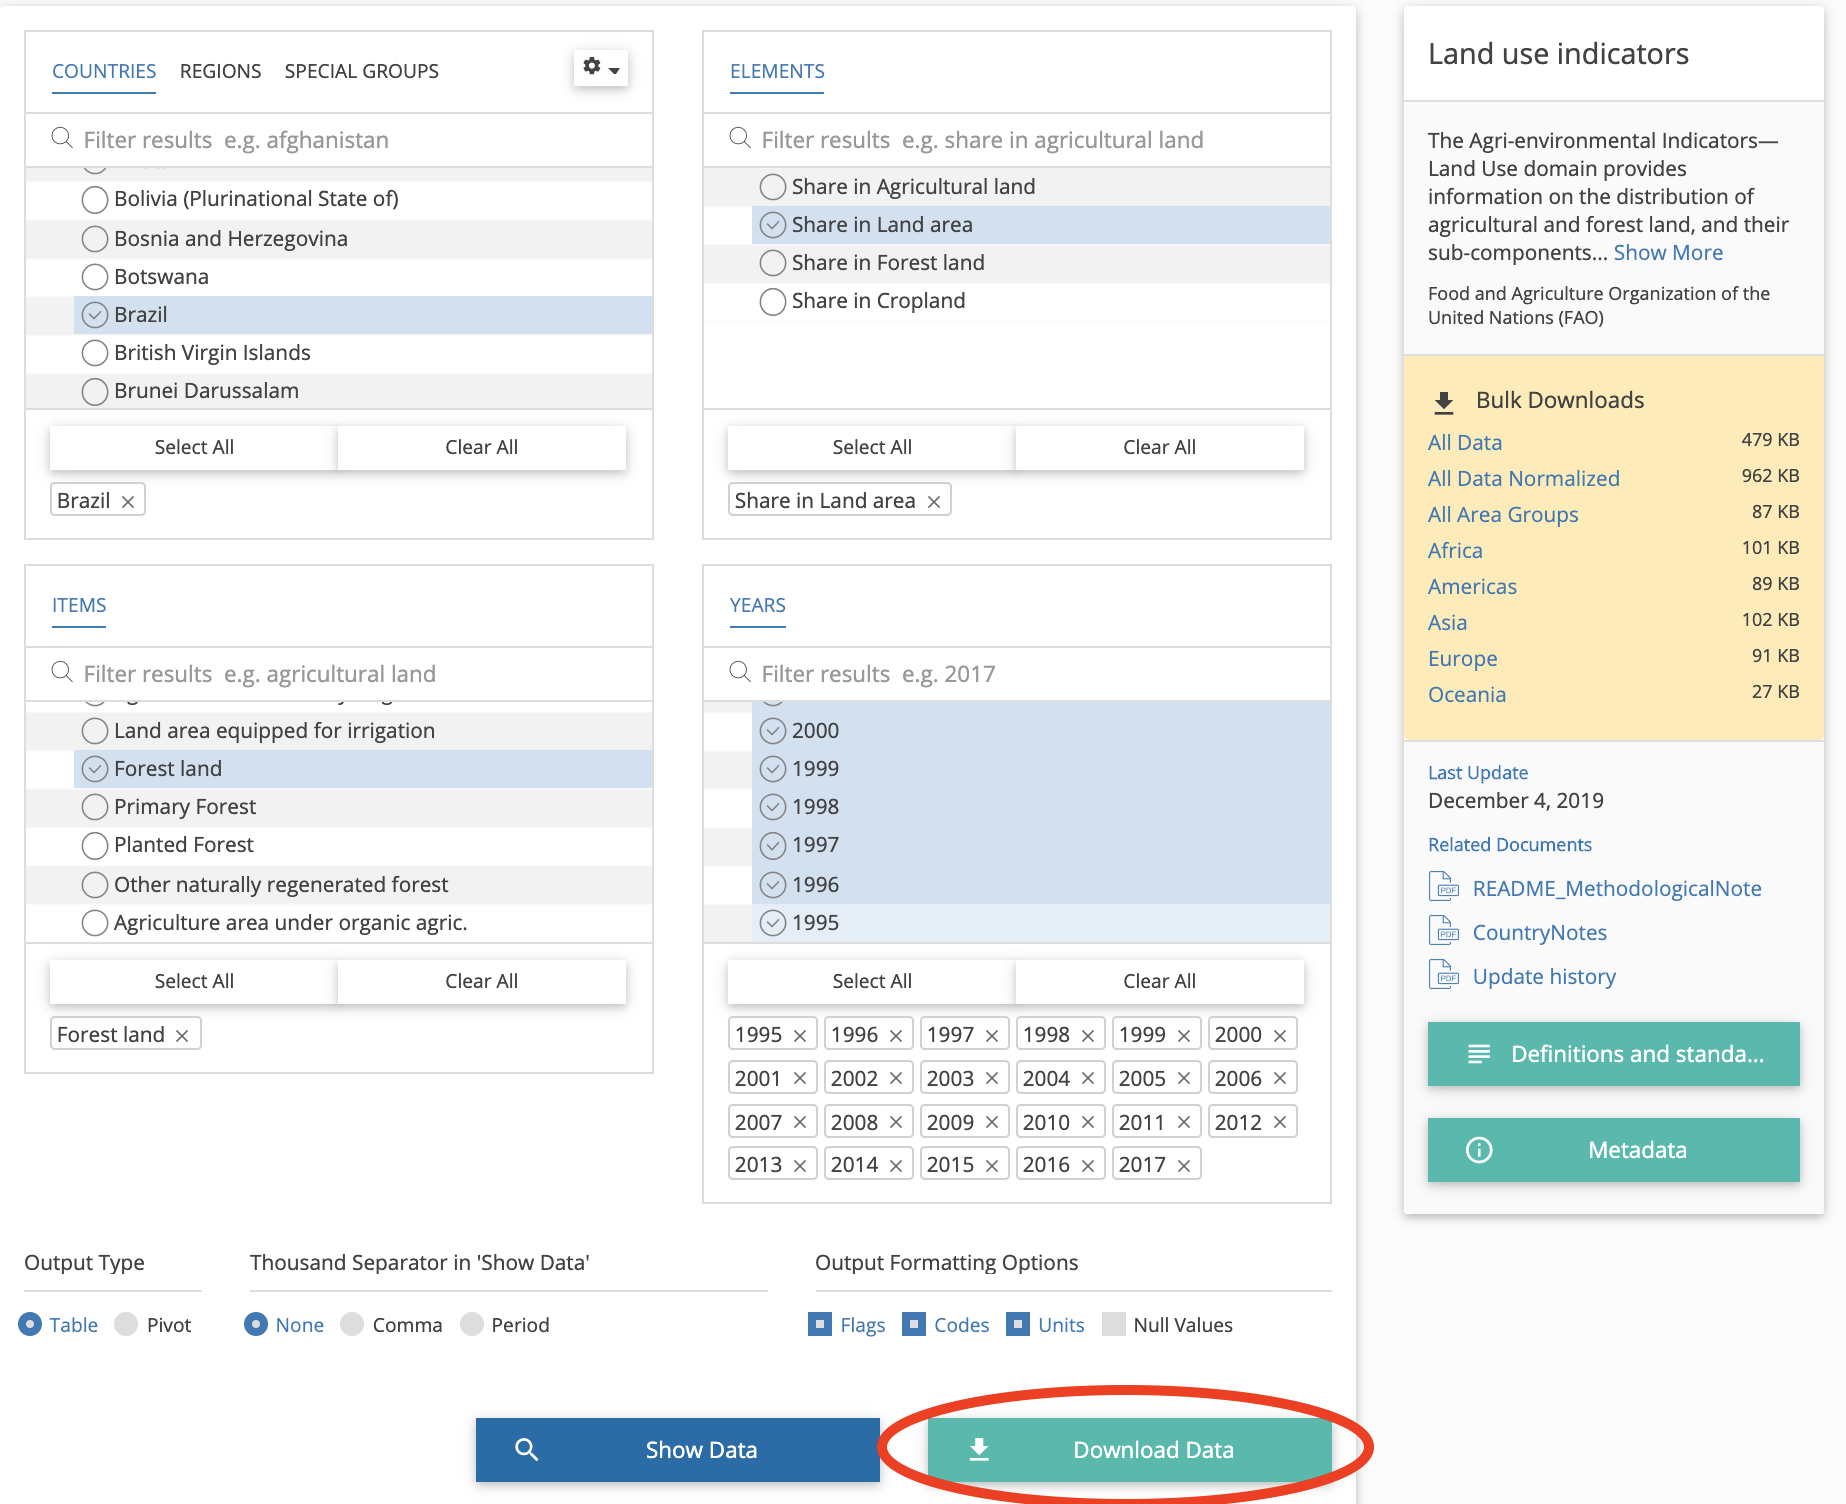
Figure 9.4: Please fill in the required fields as seen above’.
Download the data and open it in Excel. Note the data will be downloaded as a comma separated file (“.csv”), but should open in Excel when you click on it.
From this “forest land” dataset, you will only need the columns entitled “Year” and “Value”; rename the “Value” column to “Percent Forest Land.” Take note of the unit. This is your first dataset.
- Follow steps 2-5 above again. Except this time:
- In step 4C select “Agricultural Land”.
From this “agricultural land” dataset, you will only need the columns entitled “Year” and “Value”; rename the “Value” column to “Percent Agricultural Land.” Take note of the unit. This is your second dataset.
Merge your first dataset and second dataset together into a single excel file, so that you have one file with the following column headers: “Year”, “Percent Forest Land”, “Percent Agricultural Land.” This is your working dataset for Part 1 questions, and will be expanded in Part 2, so save it carefully.
9.3 Part 1 Assignment Questions
Question 1.1: Create a table in Microsoft Word that shows your data. This data table also should include a brief (i.e., one- or two sentence) title. (1 mark)
Question 1.2: Create a graph (namely, an XY Scatter Graph) that shows how forest area (on the Y-axis) has changed through time (on the X-axis) in Brazil. Include a main title, axes labels, and a linear trend line in your graph. In two or three sentences, explain what this graph is telling us. This explanation should explicitly identify which is the independent variable, and which is the dependent variable. (3 marks)
Question 1.3: Create a new graph (again, an XY Scatter Graph) that shows how agricultural area (on the Y-axis) has changed through time (on the X-axis) in Brazil. Include a title, axes labels, and a linear trend line in your graph. In two or three sentences, explain what this graph is telling us. This explanation should explicitly identify which is the independent variable, and which is the dependent variable. (3 marks)
9.4 Procedure for Laboratory 4 - Part 2/3: The role of cattle and soy production in driving land-use change in Brazil since 1995.
Part 2 data instructions:
Again, visit the Food and Agricultural Organization of the United Nations data portal by clicking here: FAOSTAT website.
Here, click on the “Data” tab, and locate the “Production” section. Once here, click on the “Livestock primary” data tab.
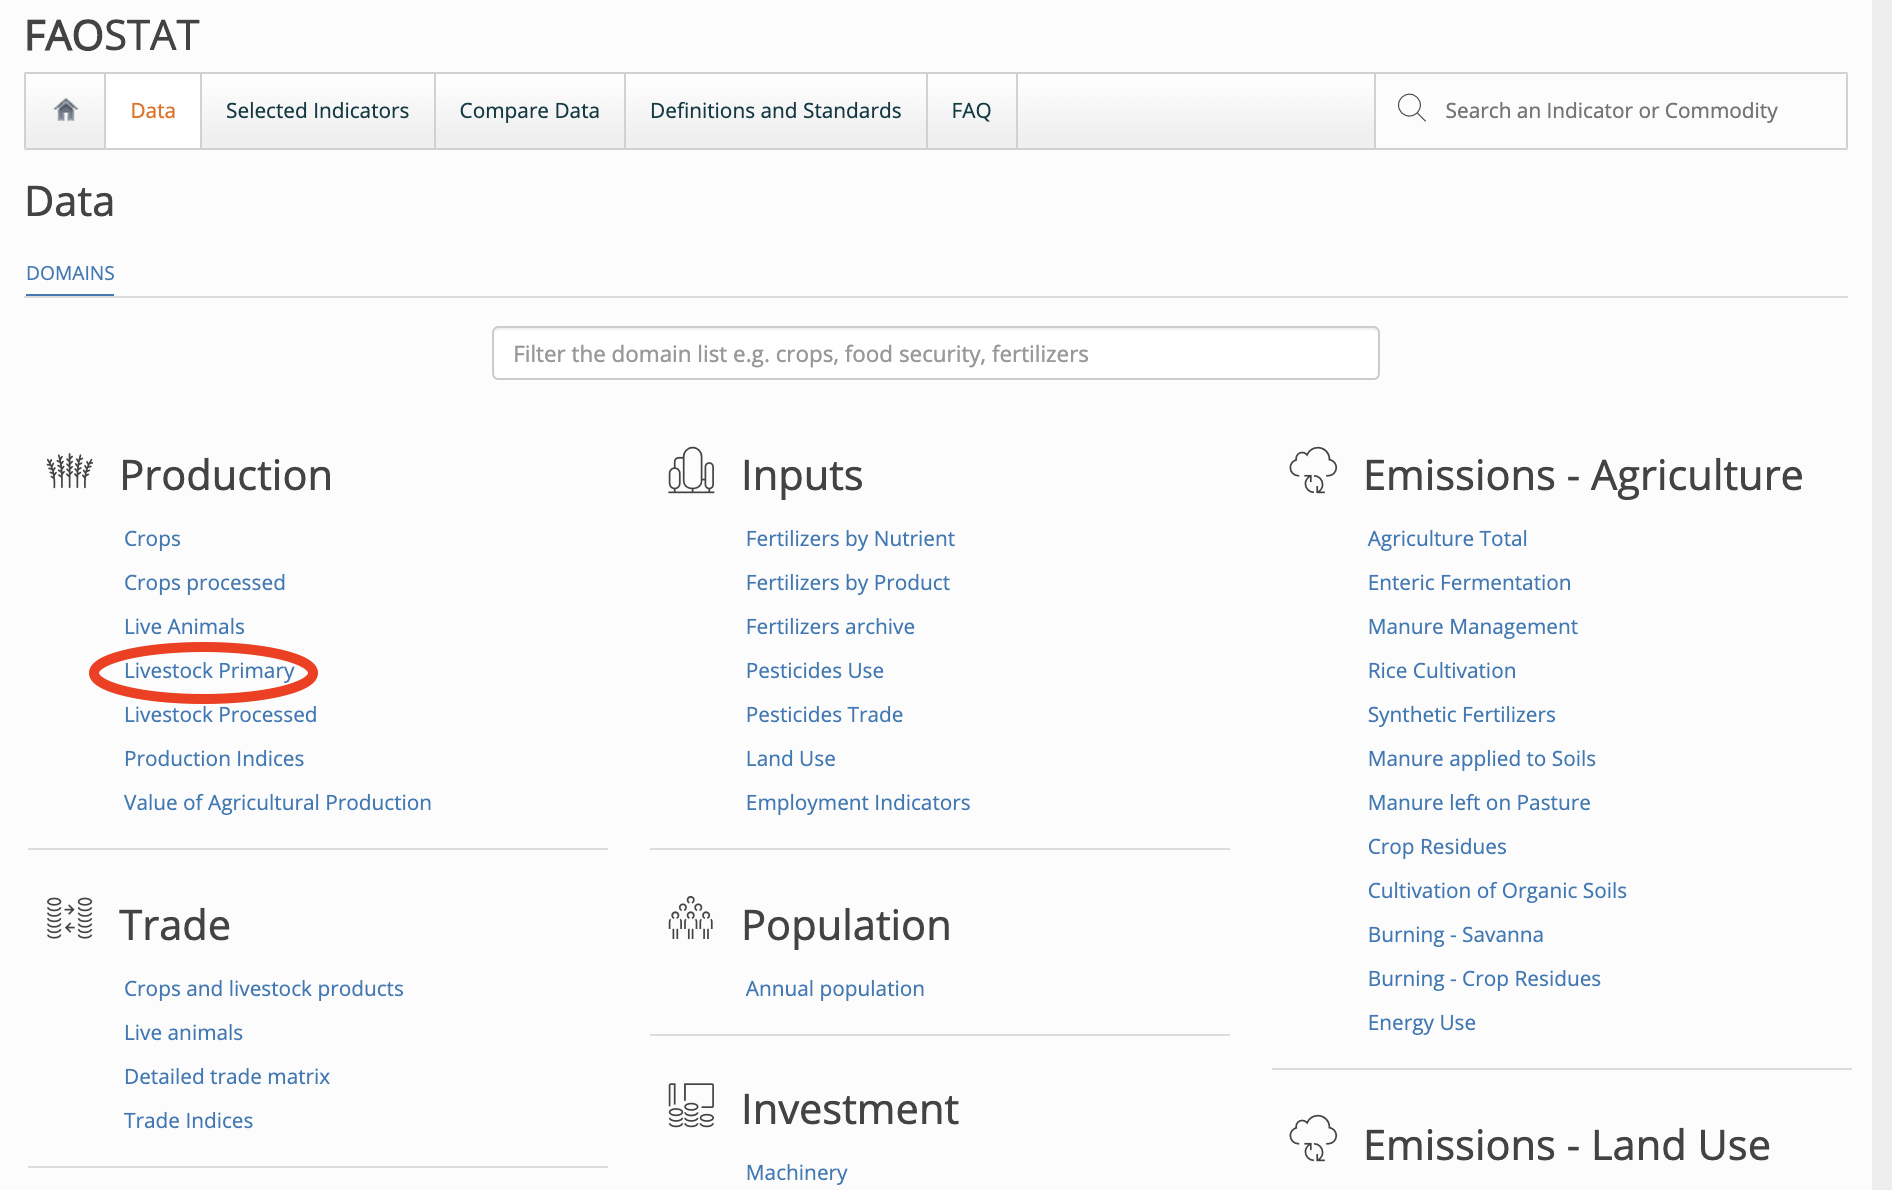
Figure 9.5: Please click ‘Livestock primary’.
- Download the data for:
- “Brazil” (in the top left panel).
- “Production quantity” (in the top right panel).
- “Meat, cattle” (in the bottom left panel).
- Select years from 1995-2017 (in the bottom right panel; please note you have to select these years manually, by clicking/ highlighting each year individually).
Download the data, and open it in Excel. Note the data will be downloaded as a comma separated file (“.csv”), but should open in Excel when you click on it.
From this “cattle production” dataset, you will only need the columns entitled “Year” and “Value”; rename the “Value” column to “Cattle production.” Take note of the unit. This is your third dataset.
Add the data from your third dataset to your working dataset (i.e., Created in Part 1, Step 9). Now you have one file with the following column headers: “Year”, “Percent Forest Land”, “Percent Agricultural Land”, and “Cattle production”.
Go back to step 2 in part 2. However, this time, locate and click on the “Crops” tab under the “Production” section.
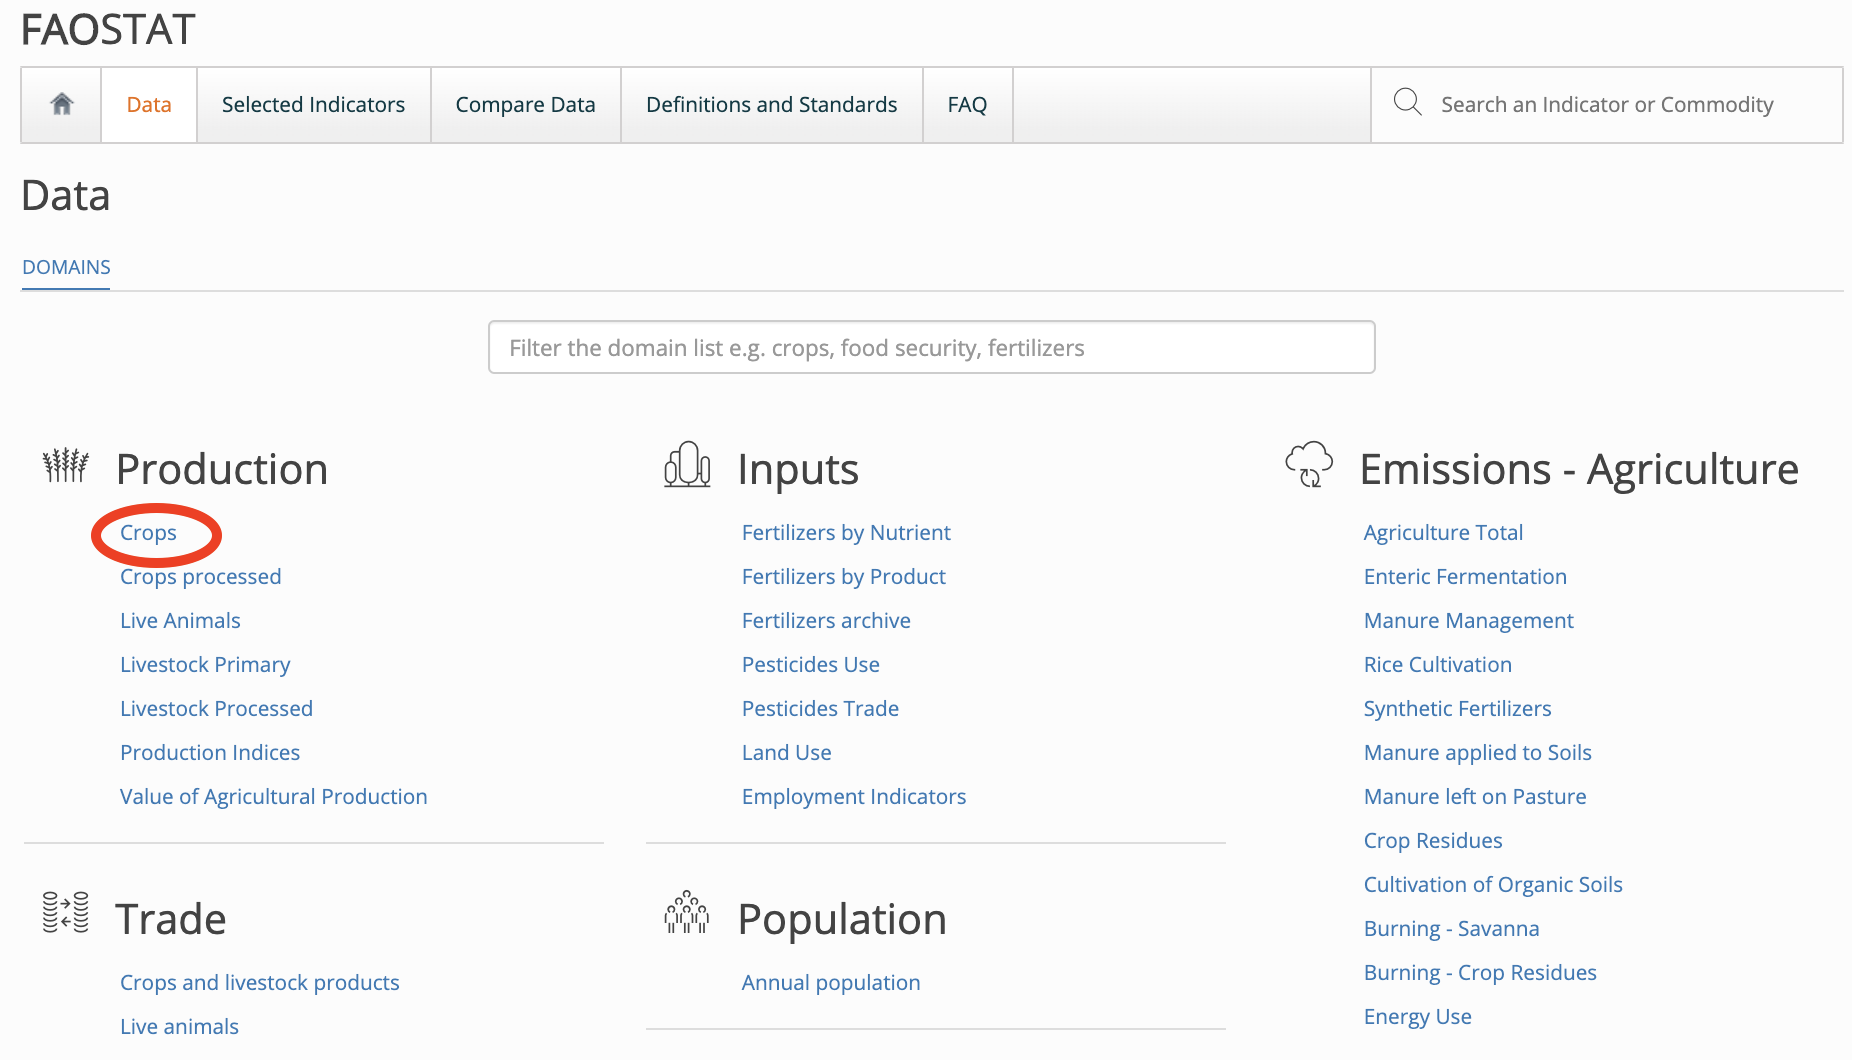
Figure 9.6: Please click ‘Crops’.
- Download the data for:
- “Brazil” (in the top left panel).
- “Area harvested” (in the top right panel).
- “Soybeans” (in the bottom left panel).
- Select years from 1995-2017 (in the bottom right panel; please note you have to select these years manually, by clicking/ highlighting each year individually).
Download the data, and open it in Excel. Note the data will be downloaded as a comma separated file (“.csv”), but should open in Excel when you click on it.
From this “soy production” dataset, you will only need the columns entitled “Year” and “Value”; rename the “Value” column to “Soybean area.” Take note of the unit. This is your fourth dataset.
Add the data from your fourth dataset to your working dataset (i.e., Created in Part 1, Step 9, and last updated in part 2 step 6). Now you have one file with the following column headers: “Year”, “Percent Forest Land”, “Percent Agricultural Land”, “Cattle production” and “Soybean area”. Use this working dataset to answer the questions for part 1 and part 2.
9.5 Part 2 Assignment Questions
Question 2.1: Create a table in Microsoft Word that shows your final dataset created in part 2, step 11. This data table also should include a brief (i.e., one- or two sentence) title. (1 mark).
Question 2.2: Create a graph that shows how cattle production has changed through time in Brazil. Include a title, axes labels, and a linear trend line in your graph. In two or three sentences, explain what this graph is telling us. This explanation should explicitly identify which is the independent variable, and which is the dependent variable. (3 marks)
Question 2.3: Create a graph that shows how soybean production has changed through time in Brazil. Include a title, axes labels, and a linear trend line in your graph. In two or three sentences, explain what this graph is telling us. This explanation should explicitly identify which is the independent variable, and which is the dependent variable. (3 marks)
Question 2.4: Create a graph that shows how forest land has changed in relation to cattle production through time in Brazil. Include a title, axes labels, and a linear trend line in your graph. In two or three sentences, explain what this graph is telling us. This explanation should explicitly identify which is the independent variable, and which is the dependent variable. (3 marks)
Question 2.5: Create a graph that shows how forest land has changed in relation to soybean area through time in Brazil. Include a title, axes labels, and a linear trend line in your graph. In two or three sentences, explain what this graph is telling us. This explanation should explicitly identify which is the independent variable, and which is the dependent variable. (3 marks)
Question 2.6: Based on the graphs created in Questions 2.4 and 2.5, which agricultural factor appears to have a more pronounced relationship with deforestation in Brazil. (2 marks)
9.6 Procedure for Laboratory 4 - Part 3/3: Interpreting your results with scientific literature.
Part 3 data instructions: In this part of the lab, you will do a quick search of the scientific literature to answer one final question on the implications of your findings. Specifically:
Visit University of Toronto Libraries or Google Scholar, an online scientific literature search engine. For either website, you may be asked to log in using your University of Toronto credentials in order to have FREE access to scientific literature. You are not restriced to the above two literature search engines. Feel free to use whichever literature search engines you are most comfortable with.
In the search bar, enter a combination of terms that are relevant to the overall theme of this lab (e.g., “deforestation”, “Brazil”, “agriculture”, “agricultural conversion”, “cattle”, “soy”, etc.). Individual search terms can be linked by including a “+” sign between them.
Refine the search to include only papers that have been published since 2010.
Note that for certain articles, to access these articles you will have to set up remote access through your UofT accounts. Information on this is accessible here: Off campus access
Look through the paper titles, keeping in mind the following question:
9.7 Part 3 Assignment Questions
Question 3.1: What are the likely short- and long-term environmental consequences of converting forest lands to either soybean/cattle production. Specifically, if Brazil’s forests continue to be converted/ lost, how can we expect biodiversity, climate, or other ecosystem services (such as freshwater provisioning) to change?
To answer this question then, choose two papers from your search that address this question (note: these papers do not have to cover all the environmental consequences of land-use change, just one or two aspects is sufficient). Provide a full citation for these two papers, and use the findings from those papers to answer Question 3.1 in detail. Your answer should be roughly 8-10 sentences (+ the two references;). (5 marks)