- Preface
- 1 Introduction to Stats
- I Introduction to
R - 2 Day one of R and RStudio
- II Describing and visualizing data
- 3 Visualizing data in R – An intro to ggplot
- 4 Handling data in
R - References
2.8 Loading, installing, and using packages
FIGURE 2.12: Watch this video about using functions in R (6 min and 35 sec). Note this is part of an intro to R series I am developing for CBS – comments appreciated
In Section 2.2.2 we introduced the idea that people have developed packages to extend R to do a bunch of stuff, and in Section 3.2.3, we saw that we install an R package with the install.packages() function.
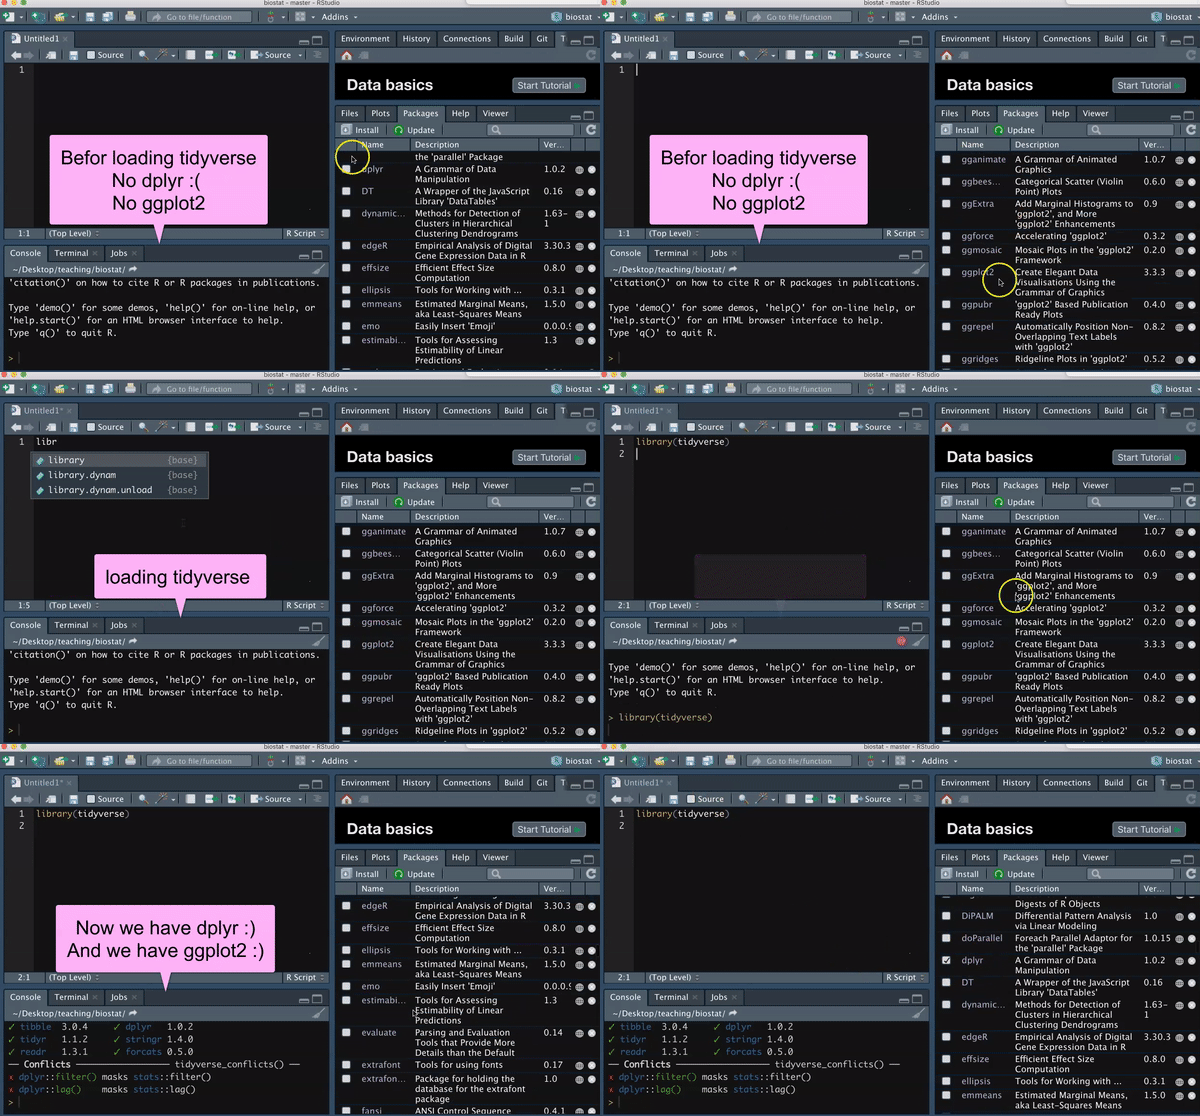
We only need to install a package once, but we need to load all packages we are using every time we open a new R session. Use the library() function to do so.
So, for example, type the following to load the tidyverse package

You should see messages like I did upon loading the tidyverse library. You should also see in the Packages tab, that you now have a check next to dplyr, forcats, ggplot2, purrr, readr tibble, and tidyr, as these are all loaded with tidyverse.
2.8.1 Reading data into R
FIGURE 2.13: Watch this video about getting data into R (4 min and 05 sec). Note this is part of an intro to R series I am developing for CBS – comments appreciated
One of the most important functions we’ll use is readr::read_csv() from the readr package. (note its good practice to specify the package a function comes from followed by two colons and then the function name - although this is not always needed). readr::read_csv() takes the argument file which directs R to the file location. For now we’ll deal with files located on the internet.
library(readr)
data_link <- "https://raw.githubusercontent.com/ybrandvain/datasets/master/FlowerColourVisits.csv"
flower_visits  <- readr::read_csv(file = data_link) # get the data into R and assign it to flower visits
## Rows: 50 Columns: 3
## ── Column specification ───────────────────────────────
## Delimiter: ","
## chr (2): flower, colour
## dbl (1): number.of.visits
##
## ℹ Use `spec()` to retrieve the full column specification for this data.
## ℹ Specify the column types or set `show_col_types = FALSE` to quiet this message.2.8.2 Vectors and Tibbles in R
FIGURE 2.14: Watch this video about data types and using the glimpse() function to figure out your data types (4 min and 49 sec). Note this is part of an intro to R series I am developing for CBS – comments appreciated
Most of what we do in R starts with a vectors – a combination of simple entities. We already came across a few simple vectors of length one – for example, the number, 1 and my_name, above.
Vectors are often longer than length one, for example, we could store the names of all students in the vector student_names.
Usually vectors come linked together each as columns in a tibble (a special type of data frame). When data are tidy, each column (aka vector) is a varble, and each row describes an observation.
Classes of Vectors in R
All entries in a vector must be of the same class. The three most relevant classes are:
numeric– Contains numbers which can take any value. For examplec(1, 2, 3)returns1, 2, 3.
logical– Contains logical statements. For example,c(TRUE, FALSE, FALSE)returnsTRUE, FALSE, FALSE.
character– Contains letters, words, and/or phrases. For examplec("The dog", "jumped", "over", "the moon")returnsThe dog, jumped, over, the moon.
You may also come across two other classes of vectors:
factor– This is a lot like a character, with the caveat that they are coded by numbers in R’s brain (see below). This can sometimes make things tough, so be careful, and consider when things are not working right that maybe you have factor when you thought you had a character.
integer– A number that must take an integer value. For exampleas.integer(c(1, 2.1, 3))returns1, 2, 3.
The dplyr::glimpse() function takes a tibble as an argument and shows us the data type of each column, as well as the first few values for that variable.
dplyr::glimpse(flower_visits)## Rows: 50
## Columns: 3
## $ flower <chr> "F1", "F2", "F3", "F4", "F5"…
## $ colour <chr> "red", "white", "yellow", "o…
## $ number.of.visits <dbl> 48, 16, 29, 21, 5, 68, 20, 9…2.8.3 Writing R scripts and beyond
FIGURE 2.15: Watch this video about writing scripts in R (7 min and 34 sec). Note this is part of an intro to R series I am developing for CBS – comments appreciated
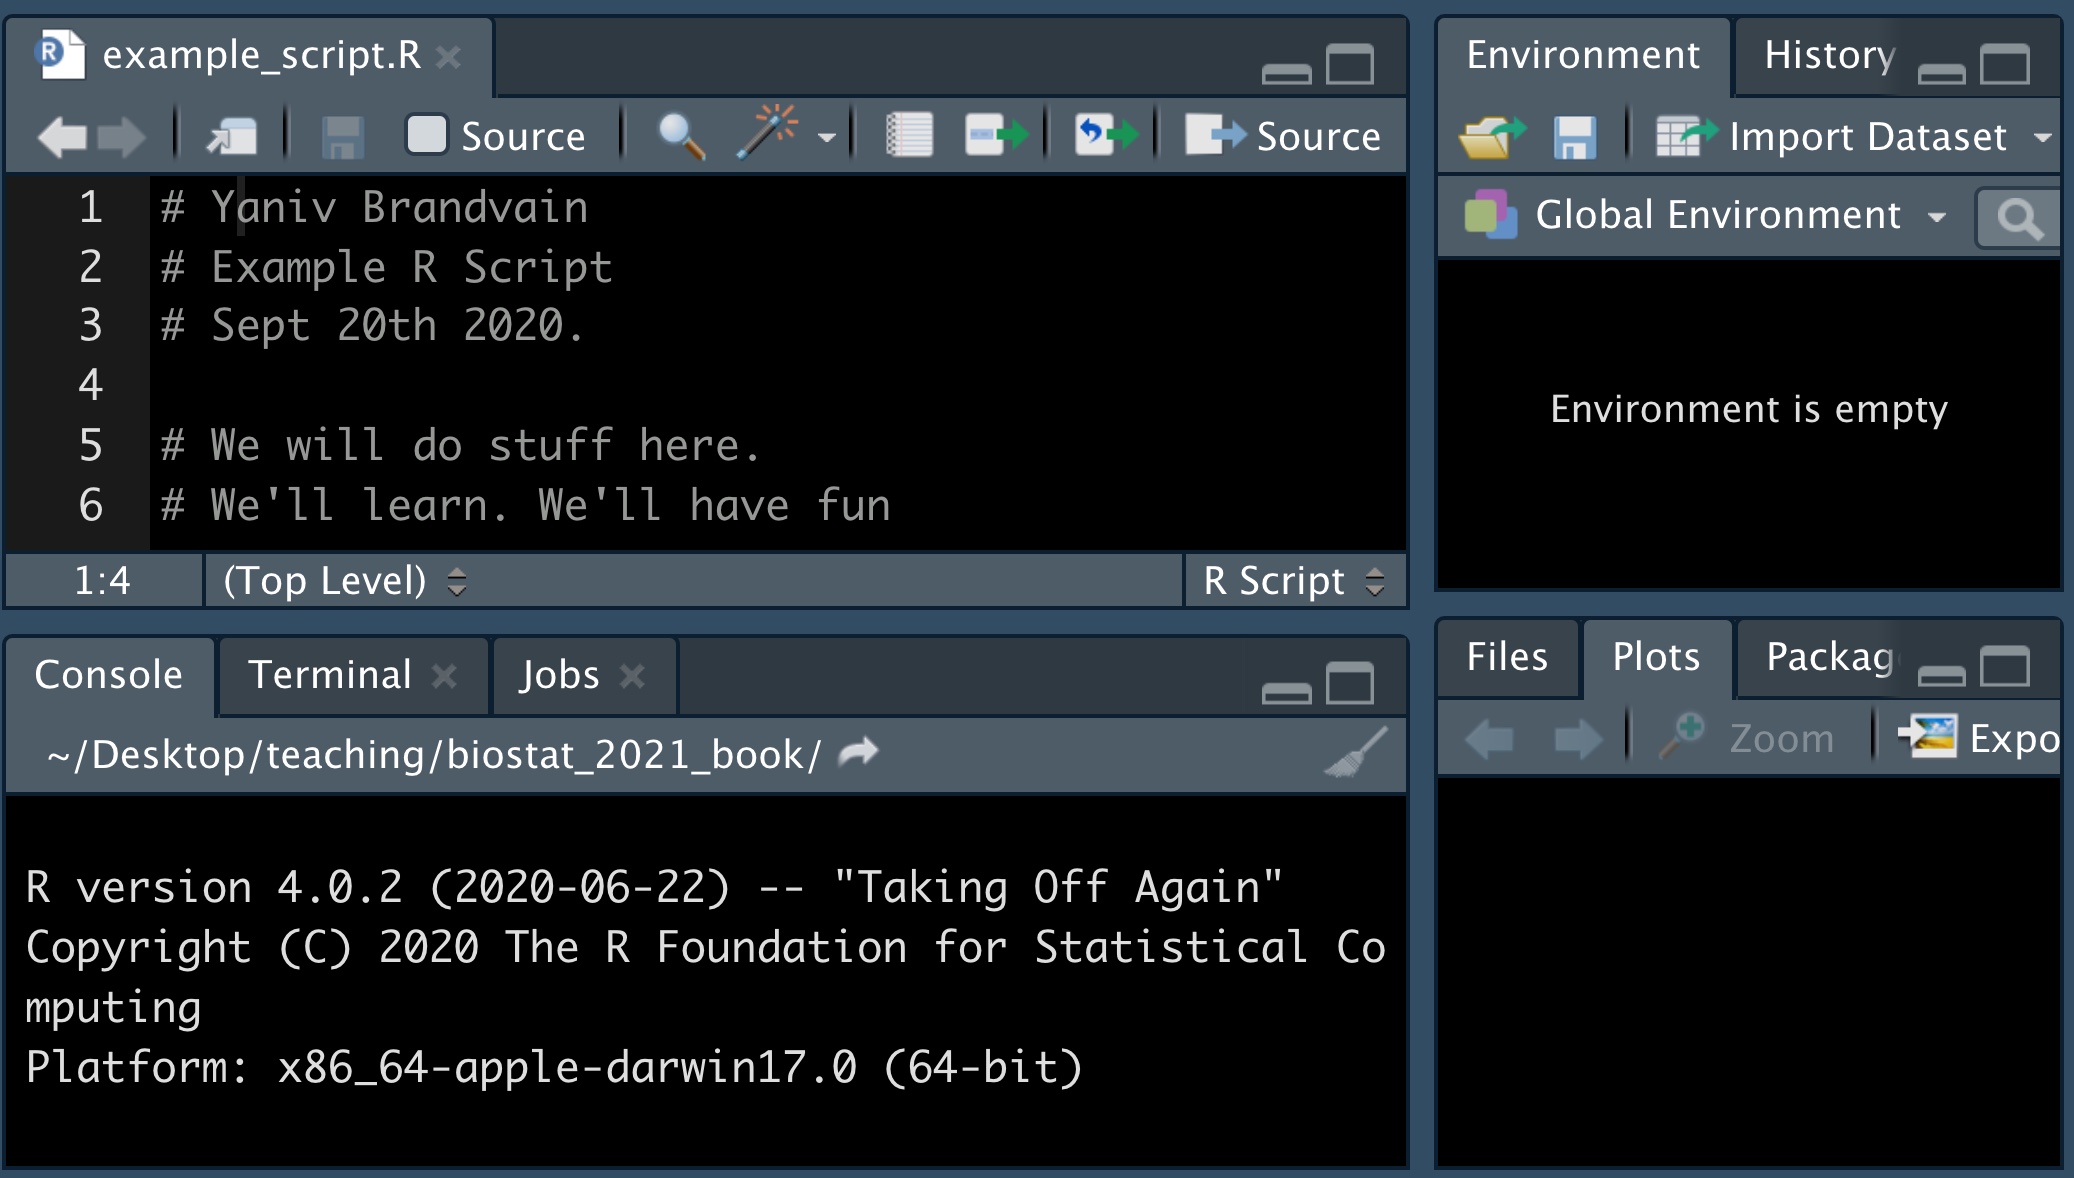
A great thing about R is that you can remember and share exactly what you have done by saving your work as a script. In doing so it’s best practice to type your name, date and the goal of the analysis at the top (with a # to tell R this isn’t code), plus a description of your goals. Regular comments throughout, help make your code more usable.
To make a new R Script, click on File, then New File, and then R Script.
