# faithful 添加二维核密度估计 density 列
library(KernSmooth)
den <- bkde2D(x = faithful, bandwidth = c(0.7, 7), gridsize = c(51L, 51L))
faithful2d <- expand.grid(eruptions = den$x1, waiting = den$x2) |>
transform(density = as.vector(den$fhat))
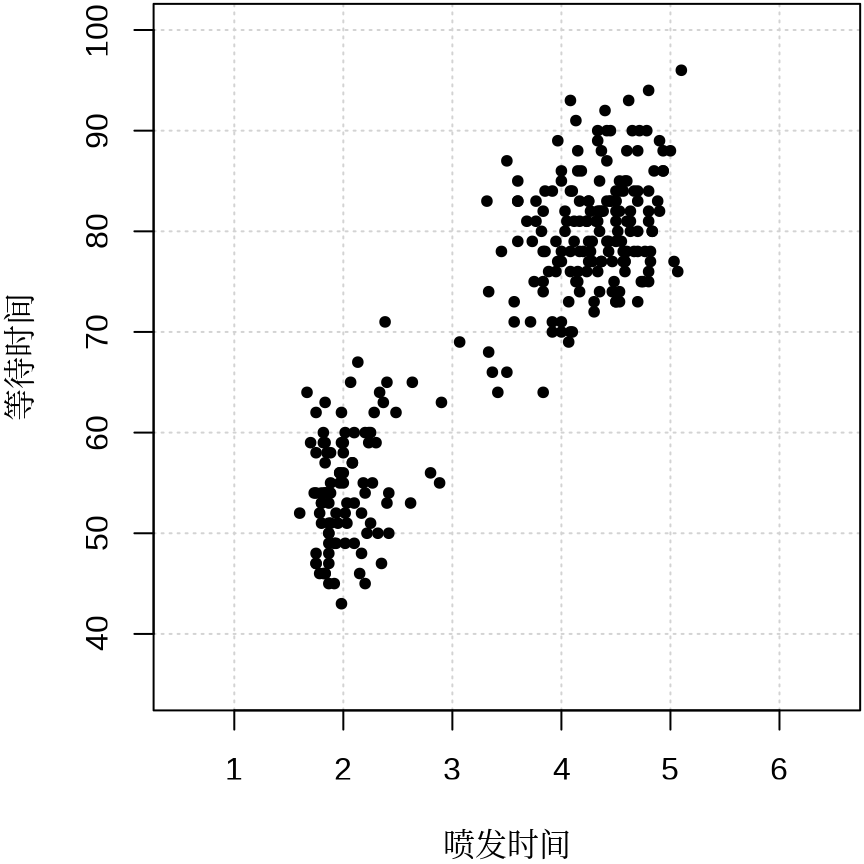
plot(faithful,
pch = 20, panel.first = grid(), cex = 1, ann = FALSE,
xlim = c(0.5, 6.5),
ylim = c(35, 100)
)
title(xlab = "喷发时间", ylab = "等待时间", family = "Noto Serif CJK SC")
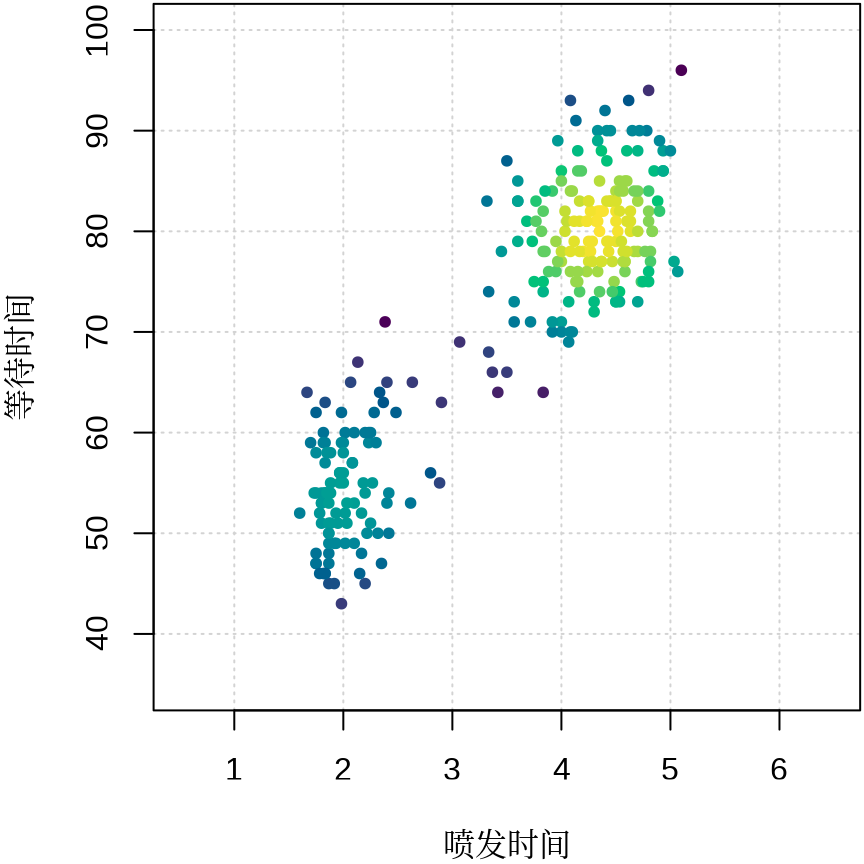
plot(faithful,
pch = 20, panel.first = grid(), cex = 1, ann = FALSE,
xlim = c(0.5, 6.5),
ylim = c(35, 100),
col = densCols(faithful,
bandwidth = c(0.7, 7),
nbin = c(51L, 51L), colramp = hcl.colors
)
)
title(xlab = "喷发时间", ylab = "等待时间", family = "Noto Serif CJK SC")
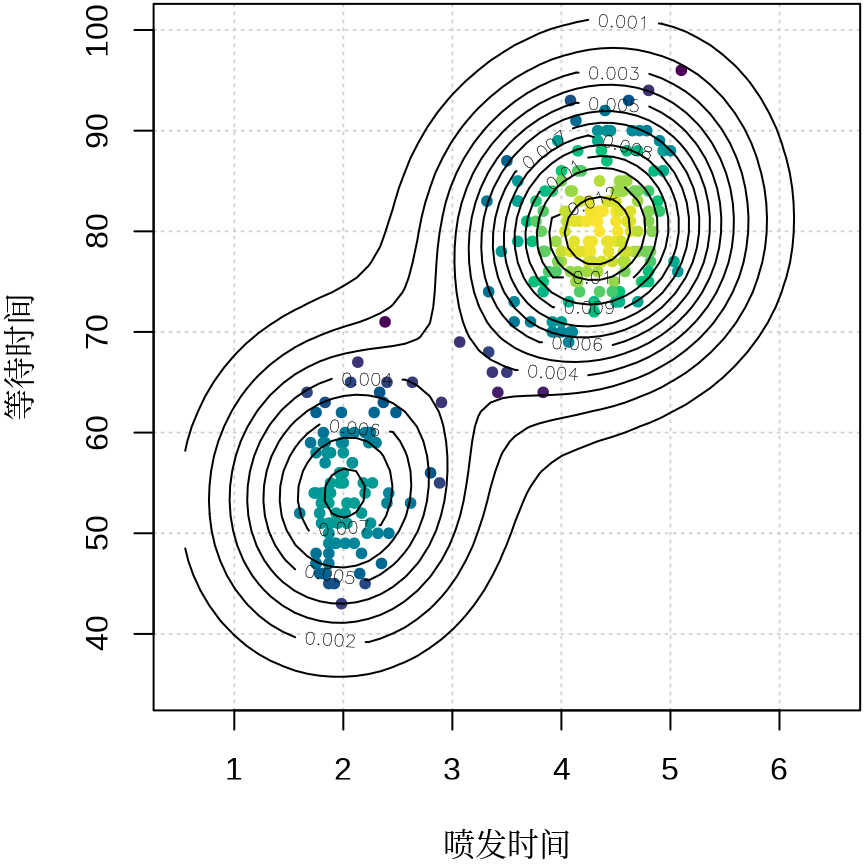
plot(faithful,
pch = 20, panel.first = grid(), cex = 1, ann = FALSE,
xlim = c(0.5, 6.5),
ylim = c(35, 100),
col = densCols(faithful,
bandwidth = c(0.7, 7),
nbin = c(51L, 51L), colramp = hcl.colors
)
)
contour(den$x1, den$x2, den$fhat, nlevels = 10, add = TRUE, family = "sans")
title(xlab = "喷发时间", ylab = "等待时间", family = "Noto Serif CJK SC")
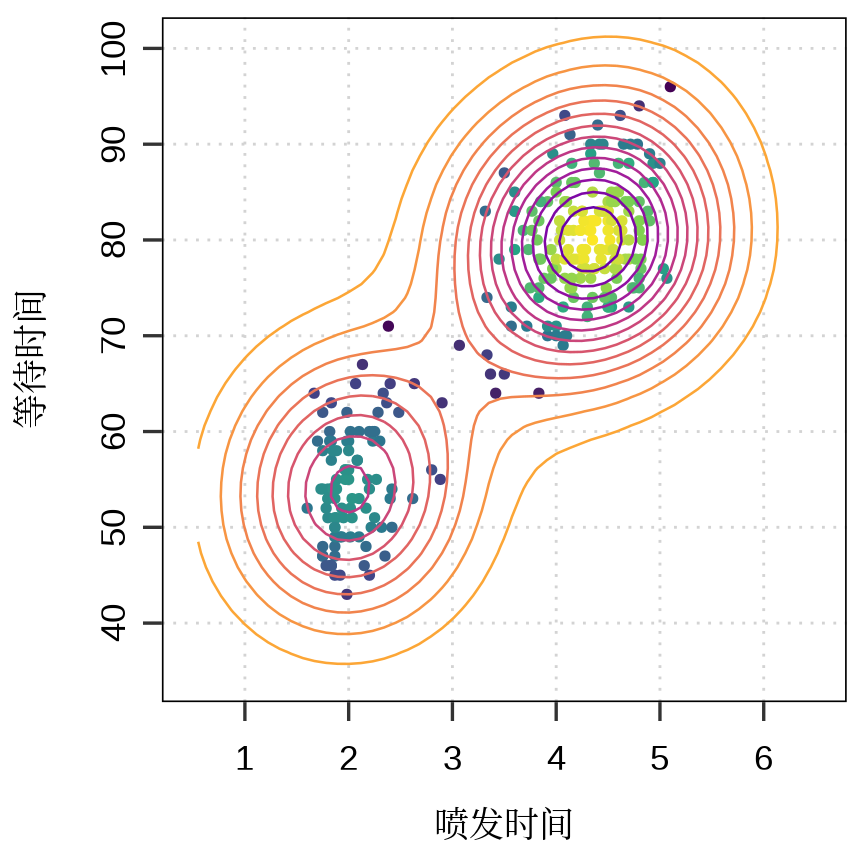
# 散点添加颜色
mkBreaks <- function(u) u - diff(range(u)) / (length(u) - 1) / 2
# faithful 划入网格内
xbin <- cut(faithful[, 1], mkBreaks(den$x1), labels = FALSE)
ybin <- cut(faithful[, 2], mkBreaks(den$x2), labels = FALSE)
# 网格对应的核密度估计值即为 faithful 对应的核密度估计值
faithful$dens <- den$fhat[cbind(xbin, ybin)]
# 若是 faithful 数据点没有划分,则置为 0
faithful$dens[is.na(faithful$dens)] <- 0
library(ggplot2)
library(ggnewscale)
ggplot() +
geom_point(
data = faithful, aes(x = eruptions, y = waiting, color = dens),
shape = 20, size = 2, show.legend = FALSE
) +
scale_colour_viridis_c(option = "D") +
new_scale_color() +
geom_contour(data = faithful2d, aes(
x = eruptions, y = waiting,
z = density, colour = after_stat(level)
), bins = 14, linewidth = 0.45, show.legend = FALSE) +
scale_colour_viridis_c(option = "C", direction = -1, begin = 0.2, end = 0.8) +
# colorspace::scale_color_continuous_sequential(palette = "Grays") +
scale_x_continuous(breaks = 1:6) +
scale_y_continuous(breaks = 10 * 4:10) +
coord_cartesian(xlim = c(0.5, 6.5), ylim = c(35, 100)) +
labs(x = "喷发时间", y = "等待时间", colour = "密度") +
theme_bw(base_size = 13) +
theme(
legend.title = element_text(family = "Noto Serif CJK SC"),
axis.title = element_text(family = "Noto Serif CJK SC"),
axis.title.x = element_text(
margin = margin(b = 0, l = 0, t = 20, r = 0)
),
axis.title.y = element_text(
margin = margin(b = 0, l = 0, t = 0, r = 20)
),
panel.border = element_rect(color = "black"),
panel.grid = element_blank(),
panel.grid.major = element_line(
color = "lightgray",
linetype = 3, linewidth = 0.5
),
axis.ticks.length = unit(0.25, "cm"),
axis.text.x = element_text(
family = "sans", color = "black",
vjust = -1.5, size = rel(1.25)
),
axis.text.y = element_text(
family = "sans", color = "black",
angle = 90, vjust = 1.5, hjust = 0.5,
size = rel(1.25)
)
)