4 Generate the report
After carefully setting your parameters, you can now generate your report!
There are three ways to generate/knit reports:
Generate one report for one measure using the default settings
render_report()Generate one report for one measure using customized settings by the users
render_report_manual()Generate multiple separate reports for multiple measures using default settings
render_report_multiple()
After generating the report, make sure to rename it and manually edit the sections that are text-heavy. The renaming is necessary because you may accidentally overwrite your manual edits if you regenerate the report in R.
Rmarkdown is not powerful yet to allow back-translation from Word to R codes, so your manual changes in Word will NOT be reflected in the R codes when you regenerate the report for some reasons (e.g. wrong file names). Therefore, we recommend finalizing the tables and plots before you write texts in the Word document (or you can just store the texts in another and move them over to the master report whenever you feel ready). If you’ve already written extensively in a knitted report and want to fix certain small sections/add some numbers, you can run the individual functions in R and manually make the changes.
Note. Error messages are shown in the knitted document in their corresponding section. They are usually about certain parameters not being specified. Other error messages should also be pretty understandable.
Note. Warning messages are not shown in the knitted document. They are usually okay to ignore as they often come from the MplusAutomation package failing to read certain bits of the Mplus output that are not quite important to generating the reports. They may also come from that WRMR is reported instead of SRMR due to Mplus version conflict. If it’s telling you an error related to xxx_fscores.csv, simply ignore it (see this GitHub issue for an explanation). You can also set printwarning = TRUE in rendering the reports (see the functions below) to have warnings printed in the documents too, or run warnings() in R to get all warning messages.
4.1 render_report()
This function renders one report for the specified measure.
Run ?render_report() to see what each argument represents. parameters allows you to specify a list of parameters to control the params section in the Rmarkdown template, you can omit this argument to use the default settings. See the bottom of this page for explanations on these parameters.
Example:
render_report(output_dir = "/Users/michaelfive/Google Drive/NYU/3EA/test",
              output_file = "Report_lebanon_cs.docx",
              parameters = list(
                       # set R code print options
                       printcode = FALSE,
                       printwarning = FALSE,
                       storecache = FALSE,

                       # set report overall parameters
                       template = "/Users/michaelfive/Google Drive/NYU/3EA/test/input_template_lebanon_cs.xlsx",
                       set_title = "Lebanon Year 1 (2016-2017)",
                       set_author = "Jane Doe",

                       # select report sections
                       item = TRUE,
                       descriptive = TRUE,
                       ds_plot = TRUE,
                       correlation_matrix_lg = TRUE,
                       correlation_matrix_bivar = TRUE,
                       correlation_matrix_item = FALSE, # BE CAREFUL! This might crash the document.
                       efa_screeplot = TRUE,
                       cfa_model_fit = TRUE,
                       cfa_model_plot = TRUE,
                       cfa_model_parameters = TRUE,
                       cfa_model_thresholds = FALSE, # default is to mute the thresholds as the table can get very long
                       cfa_r2 = TRUE,
                       internal_reliability = TRUE,
                       summary_item_statistics = TRUE,
                       item_total_statistics = TRUE,
                       inv_tx = TRUE,
                       inv_gender = TRUE,
                       inv_age = TRUE,
                       inv_lg = TRUE
                       ))
4.2 render_report_manual()
Run ?render_report_manual() to see what each argument represents.
Example:
render_report_manual(output_file = "Report_lebanon_cs.docx",
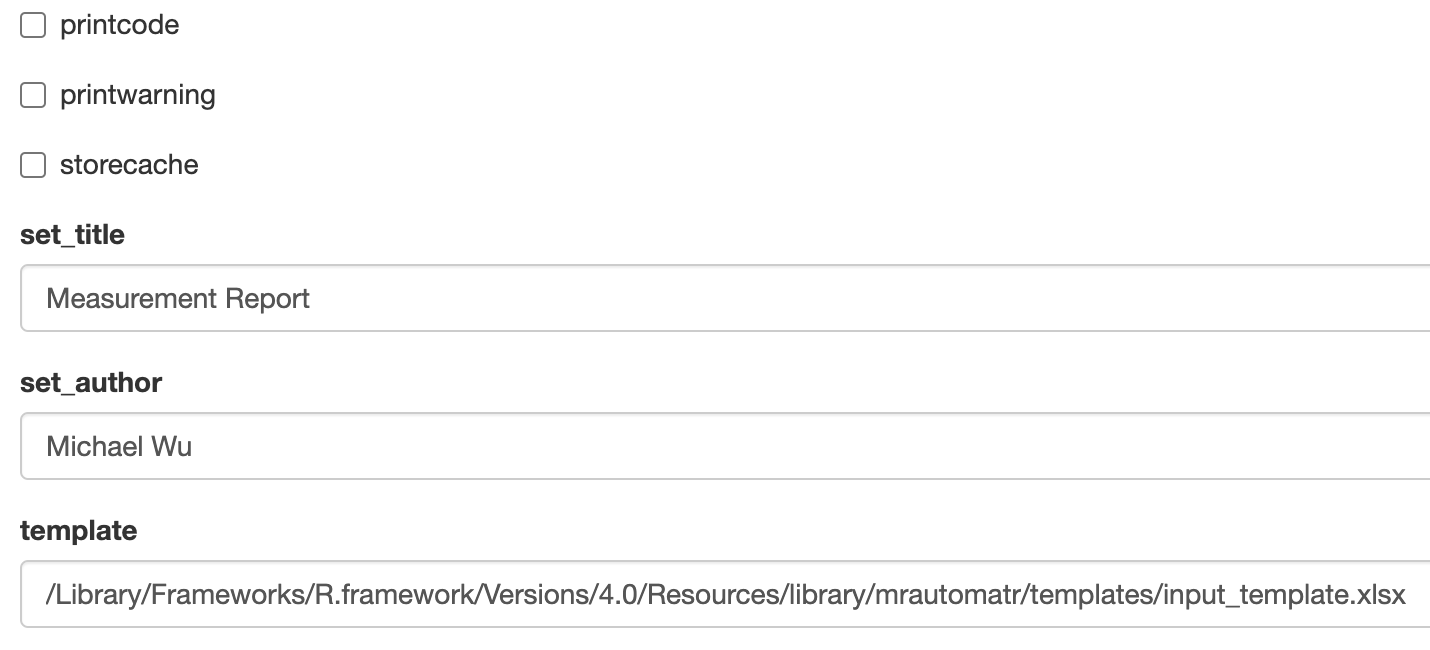
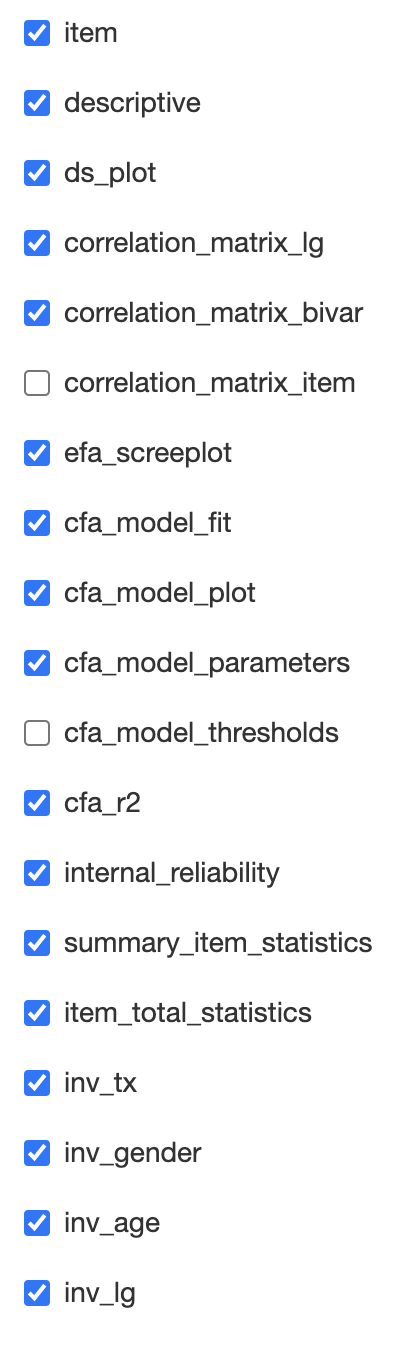
output_dir = "/Users/michaelfive/Google Drive/NYU/3EA/test")This function opens a Shiny web page where you can click/unclick sections you’d like to include/exclude in the report (see descriptions below). It also renders one report for the specified measure.
Click Save to start rendering the report, click Cancel to stop the web app and go back to R and hit the Esc button to exit the Shiny web session.
4.3 render_report_multiple()
Run ?render_report_multiple() to see what each argument represents. This function renders multiple reports at the same time with parameters globally set for all reports.
Example:
render_report_multiple(input_dir = "/Users/michaelfive/Google Drive/NYU/3EA/test",
                       templates = c("input_template_lebanon_cs.xlsx",
                                     "input_template_niger_psra.xlsx"),
                       output_dir = "/Users/michaelfive/Google Drive/NYU/3EA/test",
                       # set parameters globally for all documents
                       parameters = list(
                       # set R code print options
                       printcode = FALSE,
                       printwarning = FALSE,
                       storecache = FALSE,

                       # set report overall parameters
                       set_author = "Jane Doe",
                       # report title comes from the `year` tab in each excel template

                       # select report sections
                       item = TRUE,
                       descriptive = TRUE,
                       ds_plot = TRUE,
                       correlation_matrix_lg = TRUE,
                       correlation_matrix_bivar = TRUE,
                       correlation_matrix_item = FALSE, # BE CAREFUL! This might crash the document.
                       efa_screeplot = TRUE,
                       cfa_model_fit = TRUE,
                       cfa_model_plot = TRUE,
                       cfa_model_parameters = TRUE,
                       cfa_model_thresholds = FALSE, # default is to mute the thresholds as the table can get very long
                       cfa_r2 = TRUE,
                       internal_reliability = TRUE,
                       summary_item_statistics = TRUE,
                       item_total_statistics = TRUE,
                       inv_tx = TRUE,
                       inv_gender = TRUE,
                       inv_age = TRUE,
                       inv_lg = TRUE
))| Parameters | Description |
|---|---|
printcode |
whether you’d like R codes to be printed in your document |
printwarning |
whether you’d like to print warnings in running the codes |
storecache |
whether you’d like to store knitr cache (only for programming purposes, see here) |
set_title |
title |
set_author |
author |
template |
parameter template file path |
item |
print item descriptions |
descriptive |
print descriptive statistics table |
ds_plot |
print descriptive statistics histograms |
correlation_matrix_lg |
print factor-level correlation matrix from longitudinal invariance model |
correlation_matrix_bivar |
print factor-level correlation matrix from master dataset |
correlation_matrix_item |
print item-level correlation matrix from master dataset (set to FALSE because correlations among dozens of items may be unnecessary) |
efa_screeplot |
print EFA screeplot at all waves |
cfa_model_fit |
print CFA model fits at all waves |
cfa_model_plot |
print CFA model path diagram (for the first specified CFA model; i.e. Time 1; assuming factor structure does not change) |
cfa_model_parameters |
print CFA model parameters at all waves (factor loadings) |
cfa_model_thresholds |
print the thresholds in CFA model parameters at all waves; default is FALSE in order to mute the thresholds as the table can get very long |
cfa_r2 |
print CFA model R-squared at all wave |
internal_reliability |
print estimates of internal reliability (Cronbach’s Alpha and McDonald’s Omega, descriptions of the other indices can be found here) |
summary_item_statistics |
print summary item statistics (descriptions of the other indices can be found here) |
item_total_statistics |
print total item statistics (descriptions of the other indices can be found here) |
inv_tx |
print model fits for treatment invariance models at all waves |
inv_gender |
print model fits for gender invariance models at all waves |
inv_age |
print model fits for age invariance models at all waves |
inv_lg |
print model fit for the longitudinal invariance model |