A quick analysis my portofio holdings 2020
today = Sys.time()
last_year = today - years(1)
tickers = c("ASIA.AX", "XRO.AX", "APX.AX", "BRK-B","CBA.AX","BHP.AX", "AGL.AX", "KGN.AX","NDQ.AX","AMD","APT.AX")
prices %>% group_by(symbol) %>% slice(1)
## # A tibble: 11 x 8
## # Groups:   symbol [11]
##    symbol  date         open   high    low  close   volume adjusted
##    <chr>   <date>      <dbl>  <dbl>  <dbl>  <dbl>    <dbl>    <dbl>
##  1 AGL.AX  2019-10-16  19.4   19.5   19.3   19.5   1521437    18.4
##  2 AMD     2019-10-16  30.6   31.4   30.5   30.8  42804400    30.8
##  3 APT.AX  2019-10-16  36.1   36.1   33.5   33.9   4824840    33.9
##  4 APX.AX  2019-10-16  22.7   22.9   22.5   22.8    897485    22.8
##  5 ASIA.AX 2019-10-16   6.48   6.52   6.48   6.52    28847     6.49
##  6 BHP.AX  2019-10-16  36.1   36.3   35.9   36.0   5716652    34.3
##  7 BRK-B   2019-10-16 208.   210.   208.   209.    3233900   209.
##  8 CBA.AX  2019-10-16  79.8   80.5   79.7   80.4   2907048    77.6
##  9 KGN.AX  2019-10-16   6.04   6.55   6.04   6.55  1159868     6.41
## 10 NDQ.AX  2019-10-16  20.0   20     19.9   20.0     56111    19.9
## 11 XRO.AX  2019-10-16  69     70.5   69     70.1    524000    70.1
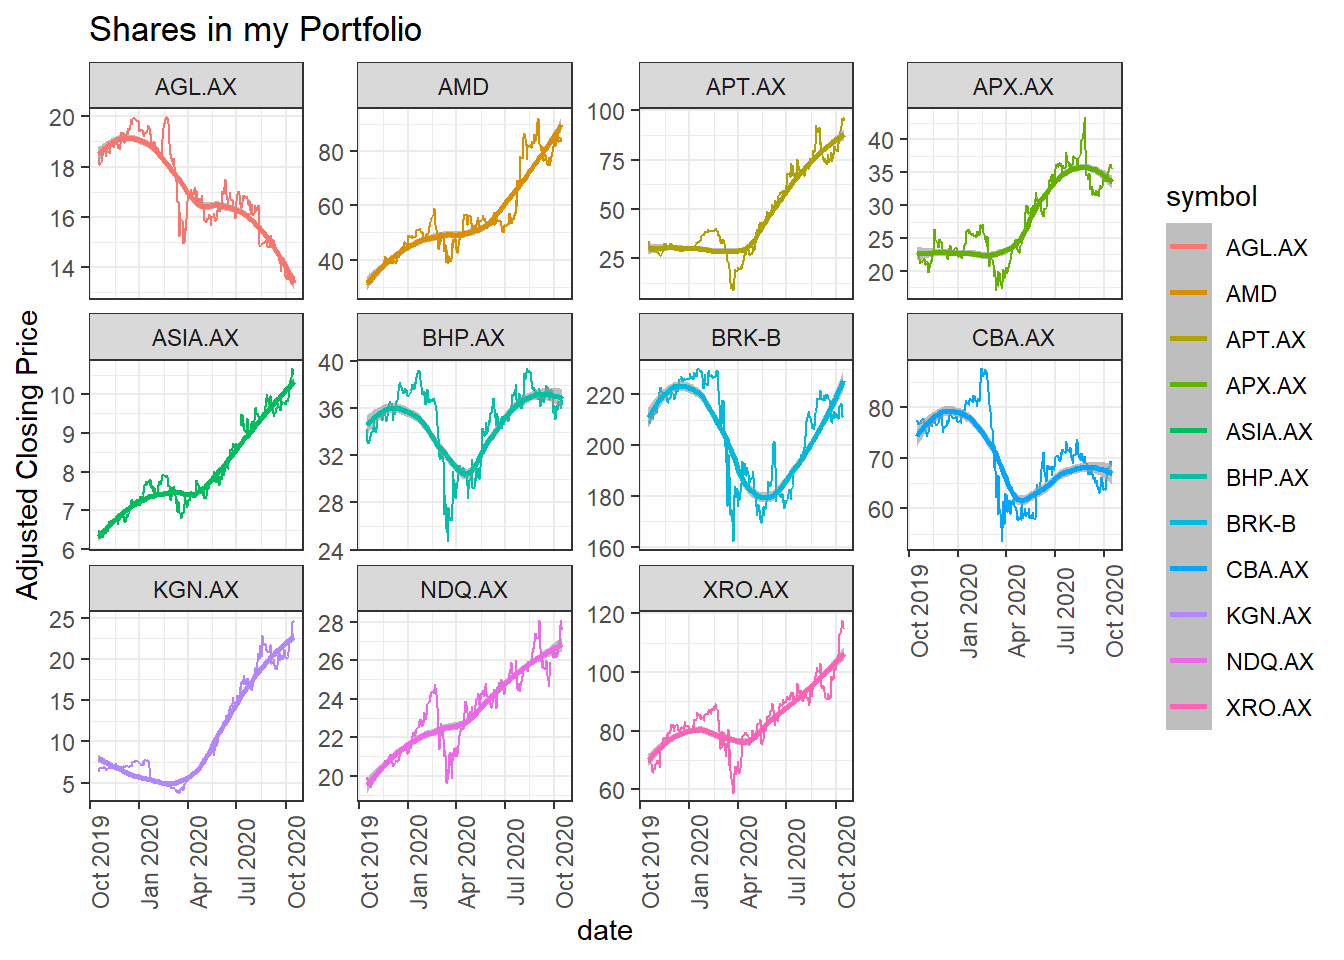
prices %>% ggplot() + aes(x = date, y = adjusted, color = symbol) +
  geom_line() + facet_wrap(~symbol, scales = "free") + geom_smooth(method= "loess") + ylab("Adjusted Closing Price") +
  facet_wrap(~symbol,scales = 'free_y') + theme_bw() +geom_smooth(formula = y~x, method = loess) + ggtitle("Shares in my Portfolio")+
  theme(axis.text.x = element_text(angle = 90))