2 Exploratory Data Analysis
2.1 Airbnb Dataset
2.1.1 What are the most popular property and room types in Los Angeles?
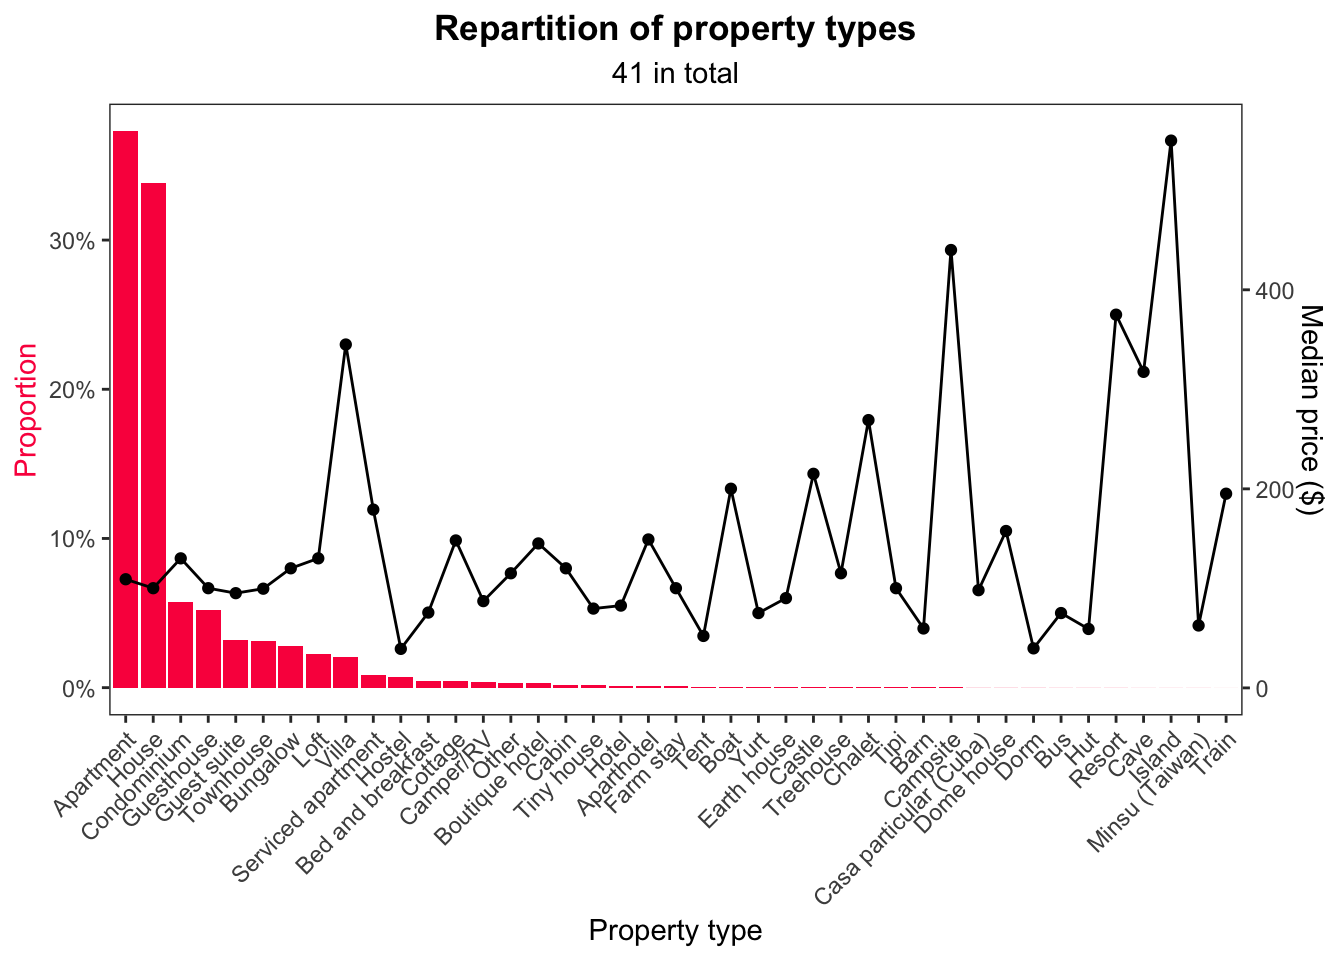
First of all, it is essential to note that the types of property listed on Airbnb in Los Angeles are very varied. Indeed, there are 41 in total. It goes from the simple apartment to the Castle. Even more surprising, you can find an island for rent.
Among all this variety, two categories, “Apartment” and “House” stand out from the crowd and alone represent around 70% of the listing.
Regarding the median price, it is relatively stable for the major property types, which is obviously not the case with less “classic” categories.
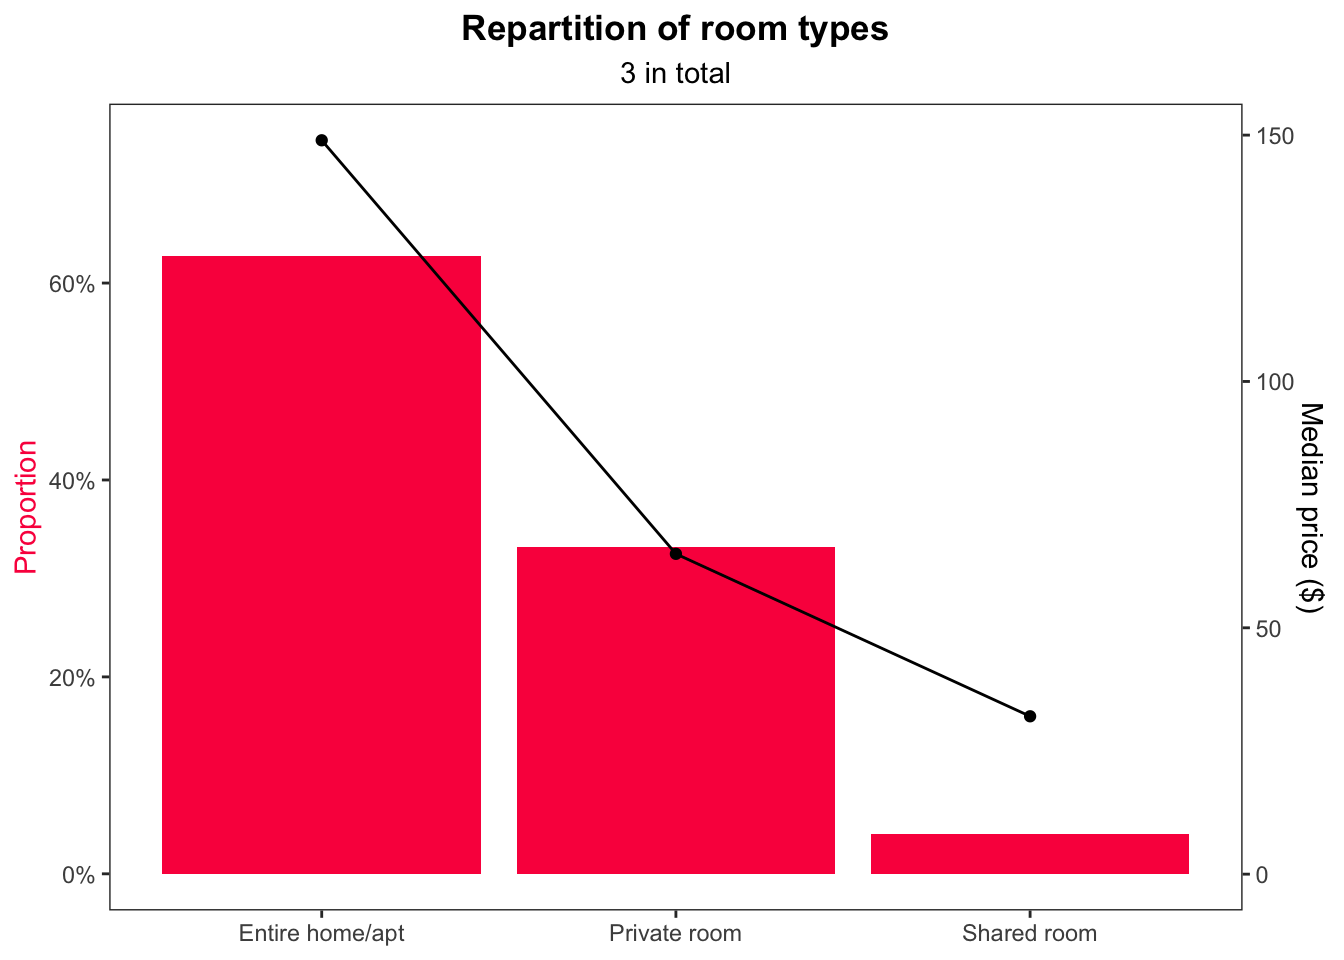
These property types are divided into 3 room categories; entire home/apartment, private room and shared room. Not surprisingly, entire room/apartment is the most represented category with a percentage rising to over 60%. The median price follows the logic we expect.
2.1.2 What is the distribution of properties according to the number of people they can accommodate?
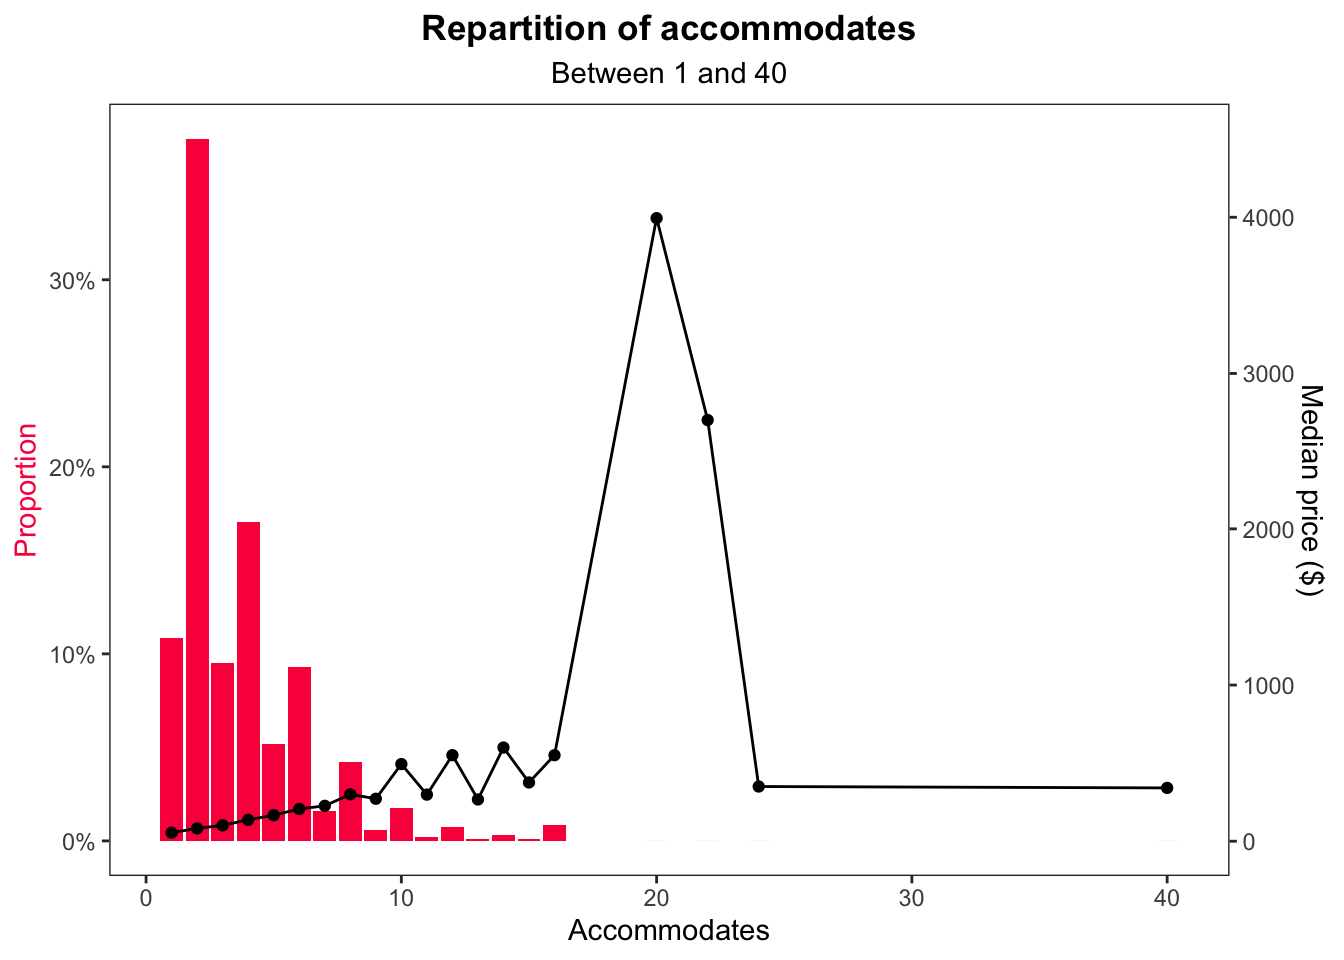
Goods that can accommodate 2 people are the most common in Los Angeles (> 40%). In general, these include only one bedroom (30.45%).
Conversely, goods that can accommodate more than 6 people represent less than 11% of the entire listing.
If we are now interested in the price, we find without surprise that it is correlated with the number of accommodates up to a certain point. Beyond that, it is difficult to draw any conclusions since these categories are only very rarely represented.
2.1.3 Which neighbourhoods in Los Angeles have the highest median price?
We can see from this map that the neighbourhoods with the most property listed on Airbnb are not the ones with the highest median price. Indeed, these are more popular with tourists including Hollywood (for its Walk of Fame for example), Venice, Santa Monica or Downtown which is the historical, financial and administrative heart of Los Angeles.
Among the most expensive districts, there is in particular Bel-Air. This is not surprising when you know that in this area, the most expensive house in the United States has been built. In the Top 5, we also find Bradbury, Beverly Crest, Unincorporated Catalina Island and Malibu (with 322 properties listed!)
2.1.4 Bedrooms, Bathrooms and beds
2.1.5 What influence do amenities have?
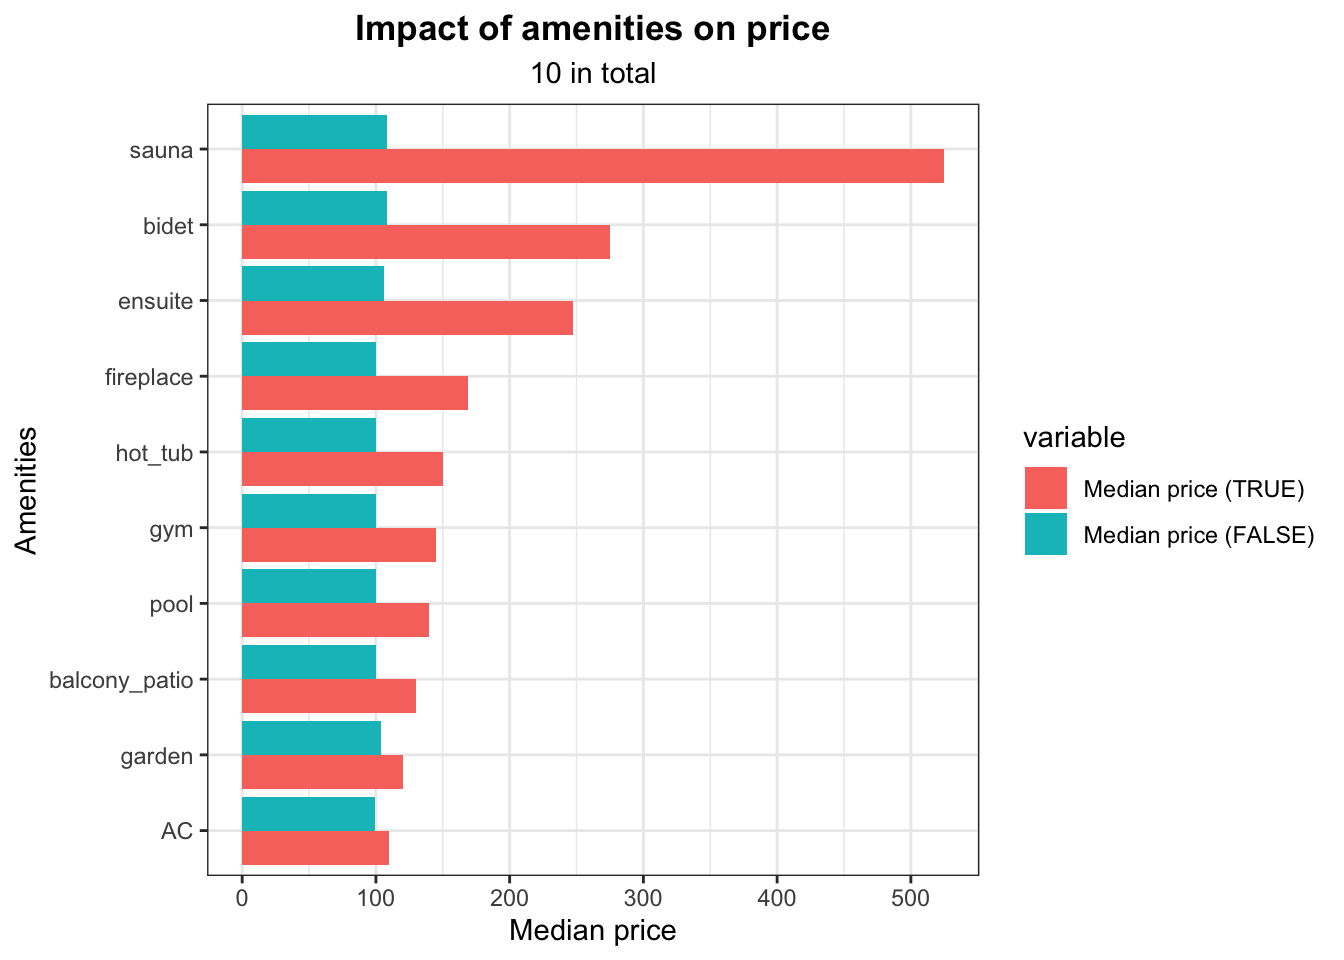
To understand the impact of the different amenities, we decided to focus on 10 of them. To extract them, we had to take into account each different spelling which explains why we had to restrict our choice.
Our selection is meant to be varied: the idea was not to take those that necessarily had the most impact on the price.
Looking at the graph we can see that the sauna is by far the most influencing feature of the price. Indeed, we can see a difference of more than $ 400 between a property with a sauna and a property without a sauna.
There are also some surprising results such as the bidet where the difference is just over $ 150. This can be explained, among other things, by the fact that there are only 12 properties with a bidet. It should also be taken into account that the price difference is not necessarily linked to the amenity in question. It is merely the difference (median price) between goods with the facility in question and those without it.
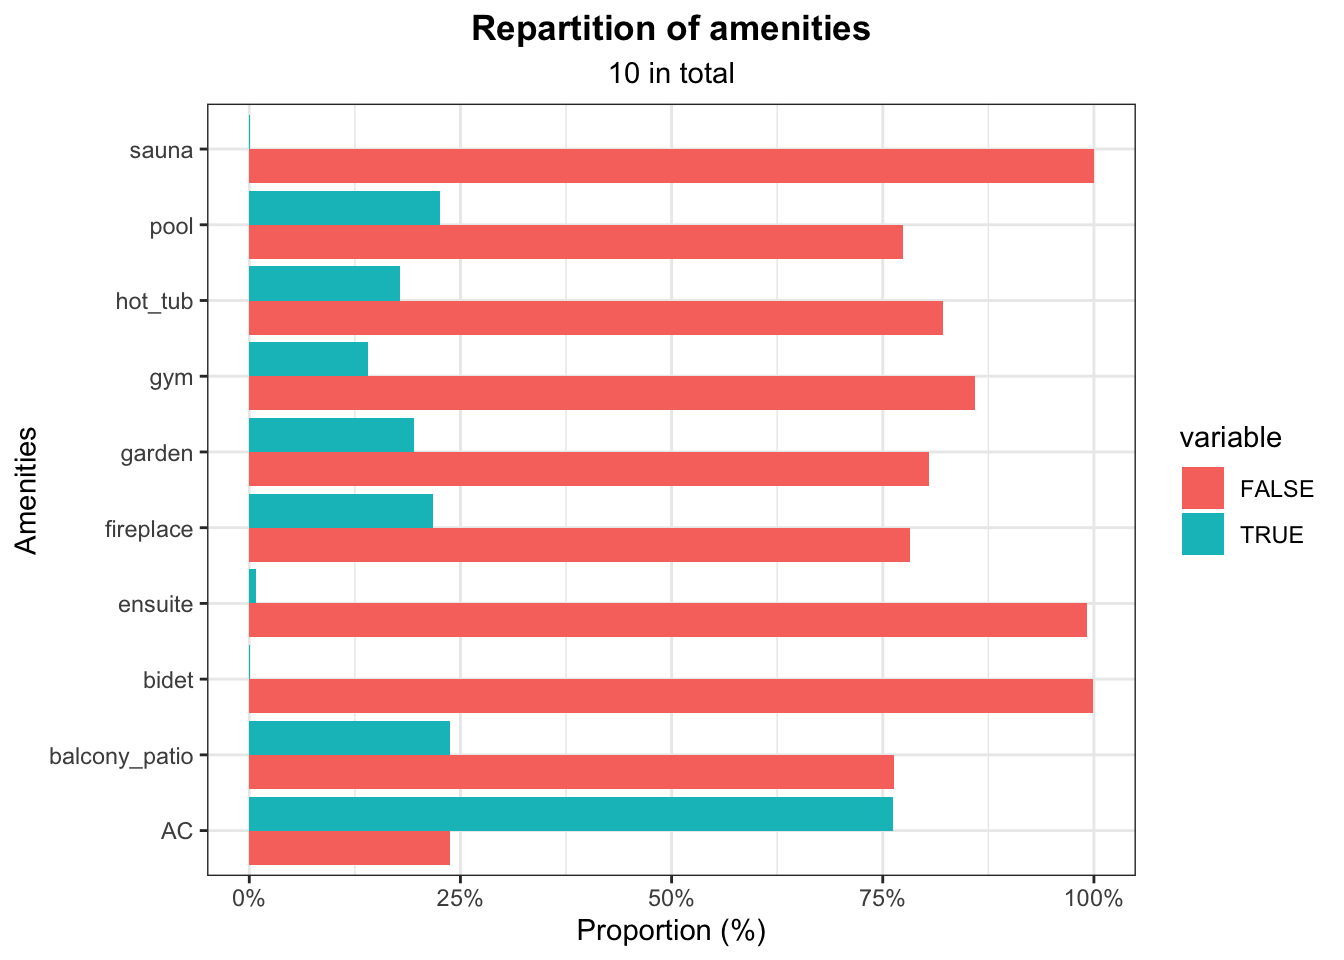
The graph above allows us to see if the amenities that we have selected are current or not.
One can, for example, note that the saunas, the ensuites and bidet are very rare. Conversely, a property with AC seems to be the norm in Los Angeles (> 75%). As for the rest, we are around 20 to 25%.
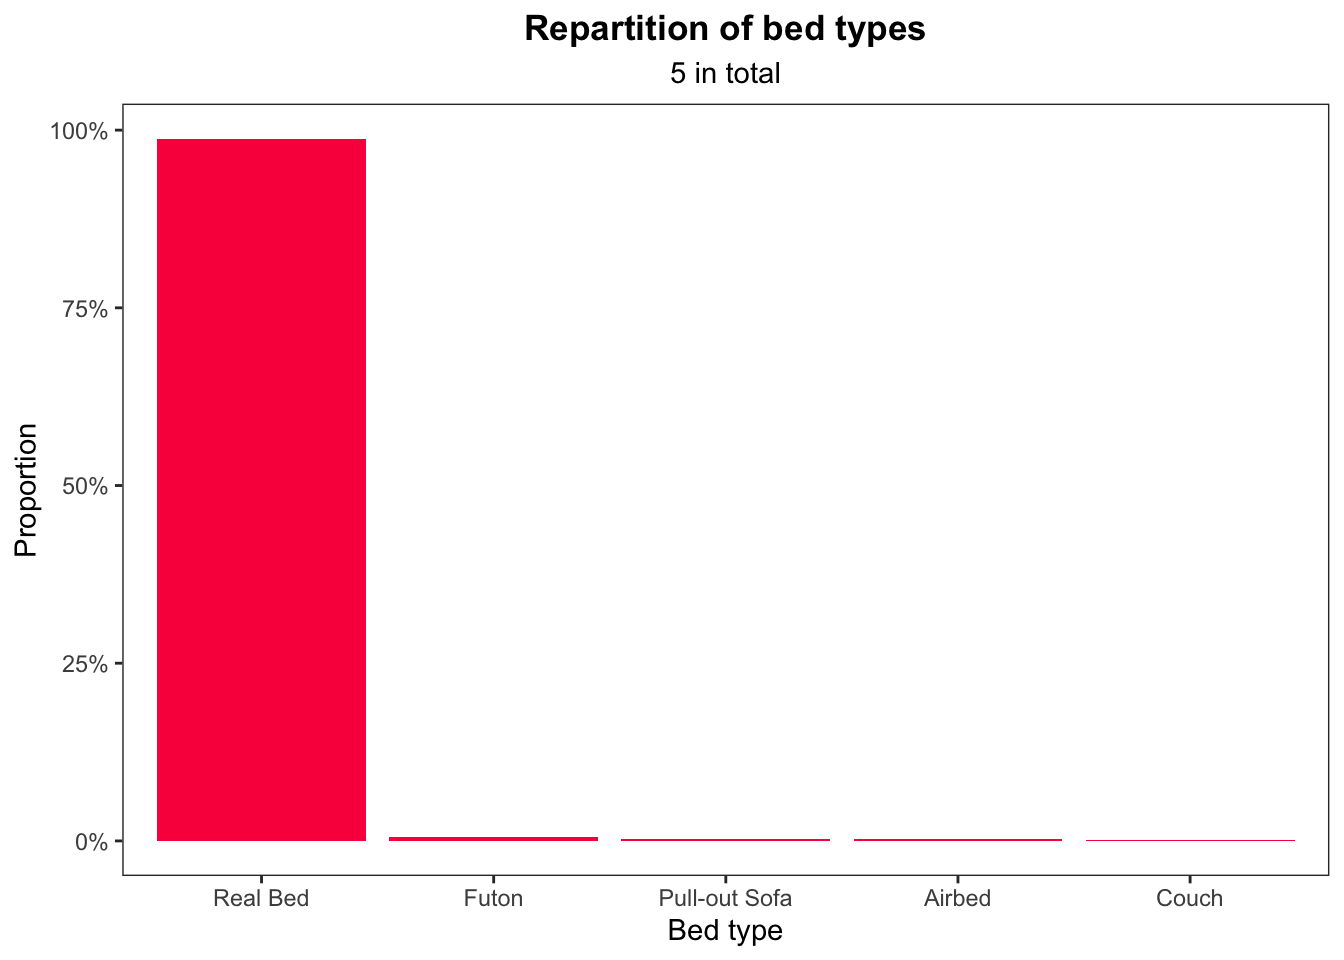
With this graph we can very clearly realize that the vast majority of goods are equipped with real beds.
2.2 Crime Dataset
Firstly, it is important to note that the crimes that we are going to analyze are only accounting for those reported to the LAPD between 2010 and 2020 (non-included).In order to observe the effect and evolution of certain type of crimes, we decided to follow the COMPSTAT standards to categorize the crimes into 6 categories: violent crimes, property crimes, murders & rapes, robberies, burglaries and vehicle crimes.
2.2.1 What are the most frequent crimes?
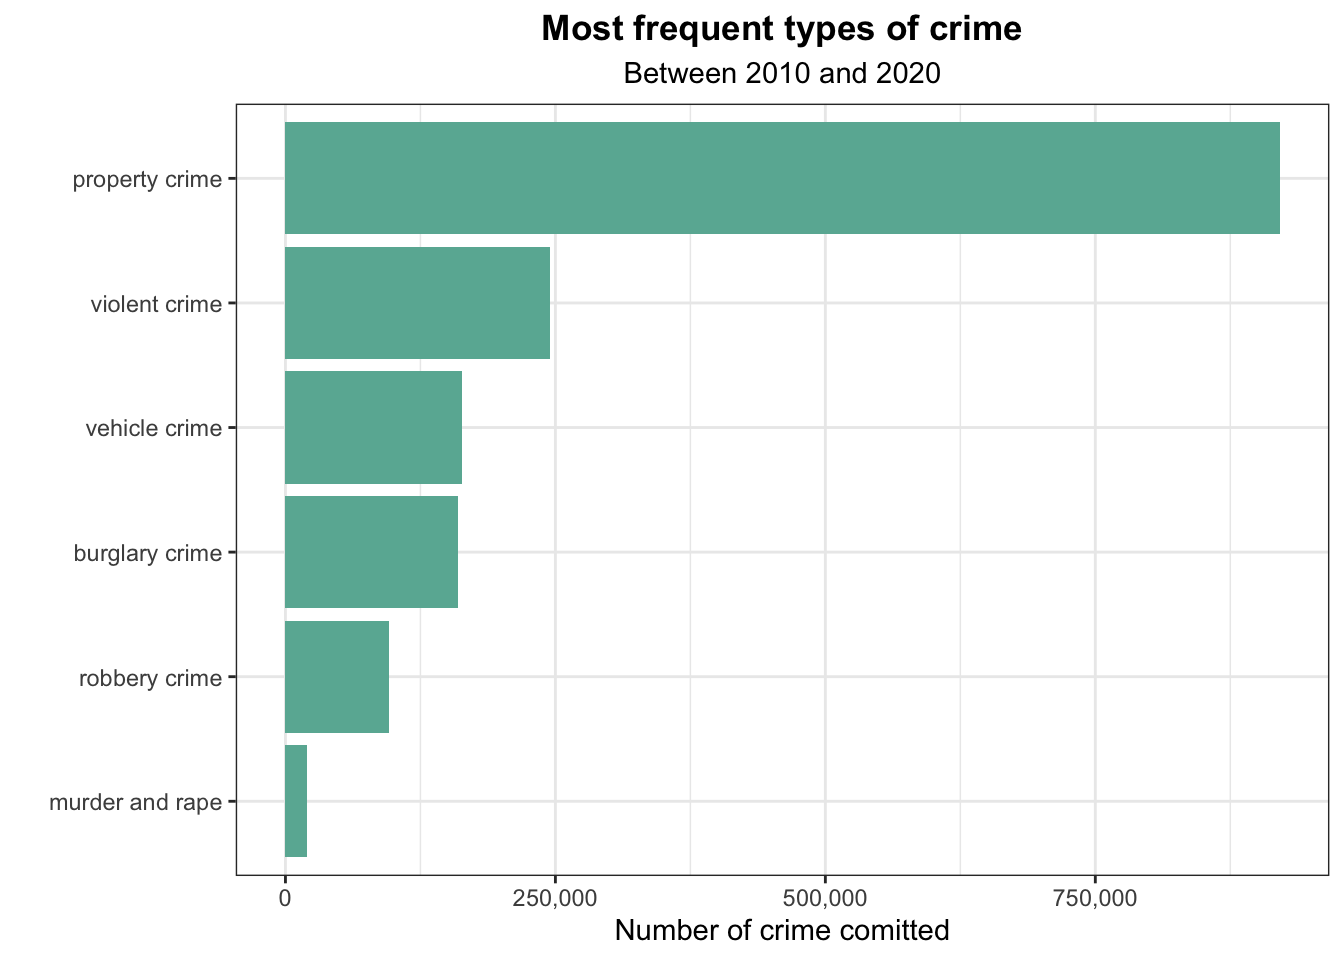
First, we decided to take a look at the frequency of each type of crime. Unsurprisingly, we can notice that the category “property crime” is the most common type of crimes. This makes sense as most crimes are small thief and are reported in this category. Then, we can note that the violent crimes are very present making nearly a quarter of a million violent crimes within 10 years.
As, we wanted to have a deeper understanding of the most frquent crimes, we decided to look at the frequency of occurence of each crime.
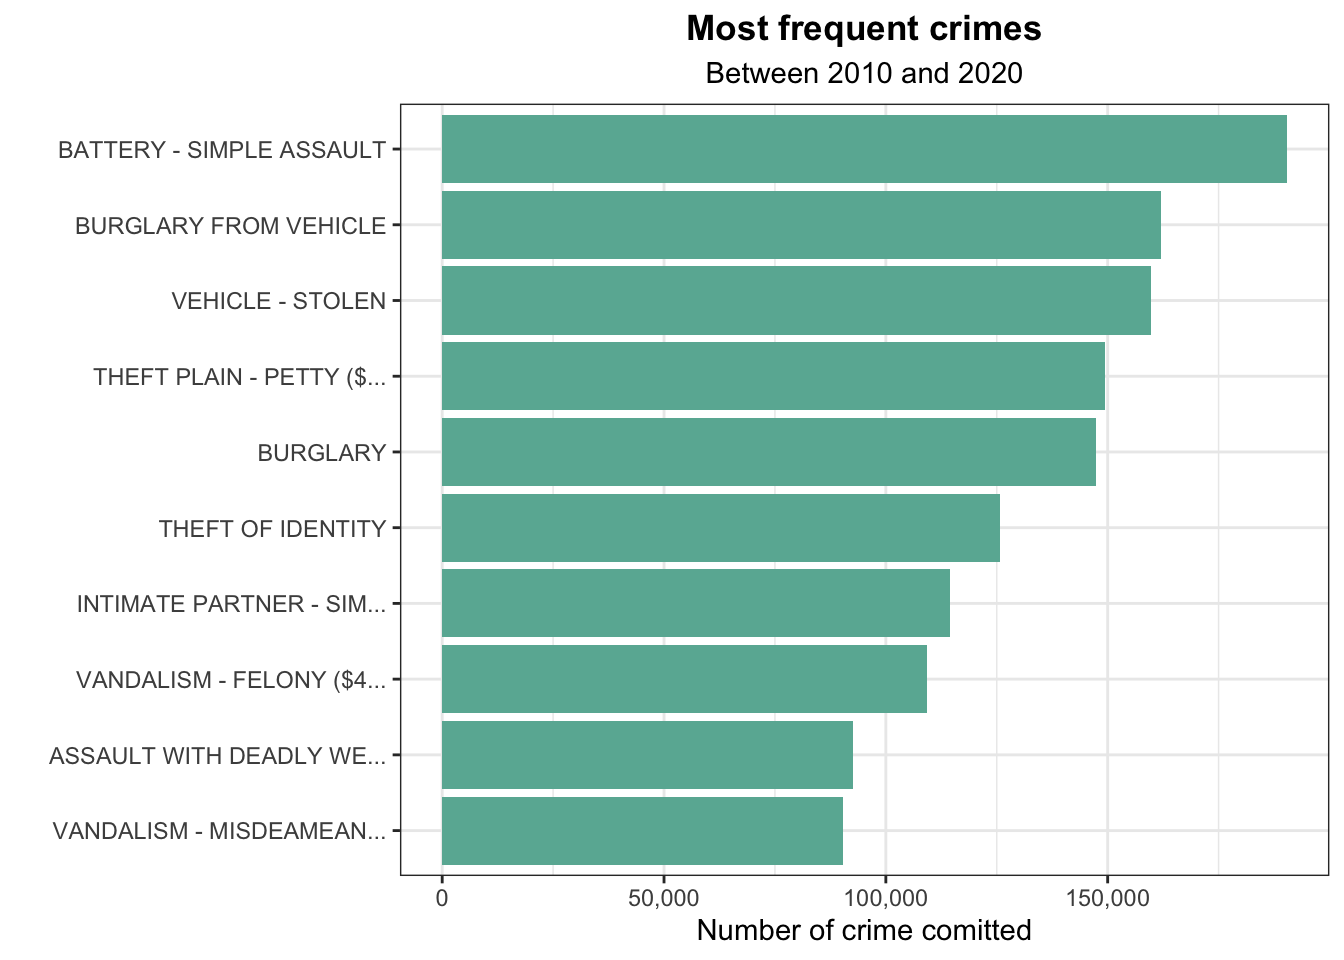
Surprisingly, the most common crime is not a crime classified as a property crime but as a violent crime. Moreover, it can be noted that violent crimes make for three out of the top ten crimes. Concerning the other crimes on this list, none of them is surprising except the burglaries which are the 4th most frequent type of crimes but the fifth in term of crimes. This can be explained by the fact that the burglary type of crime is only made of 2 different crimes compared to 38 for property crimes.
2.2.2 In which premise are crimes happening?
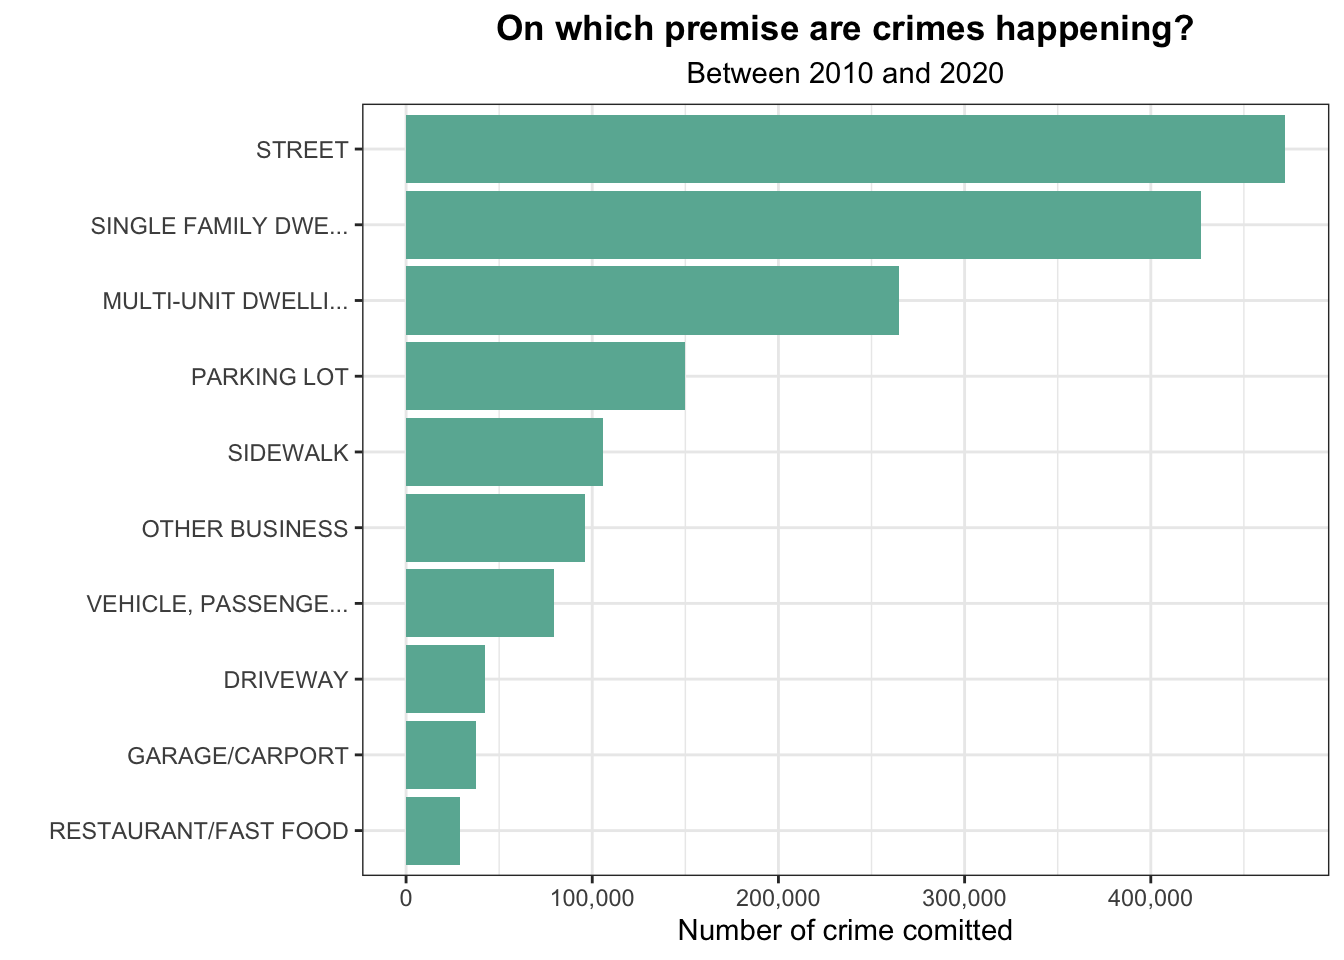
The street dominates the ranking with more than 450,000 crimes identified. This is important information because what matters to a traveler is not only whether he is safe inside but also whether the environment in which he is located is safe.
2.2.3 Are crimes seasonal?
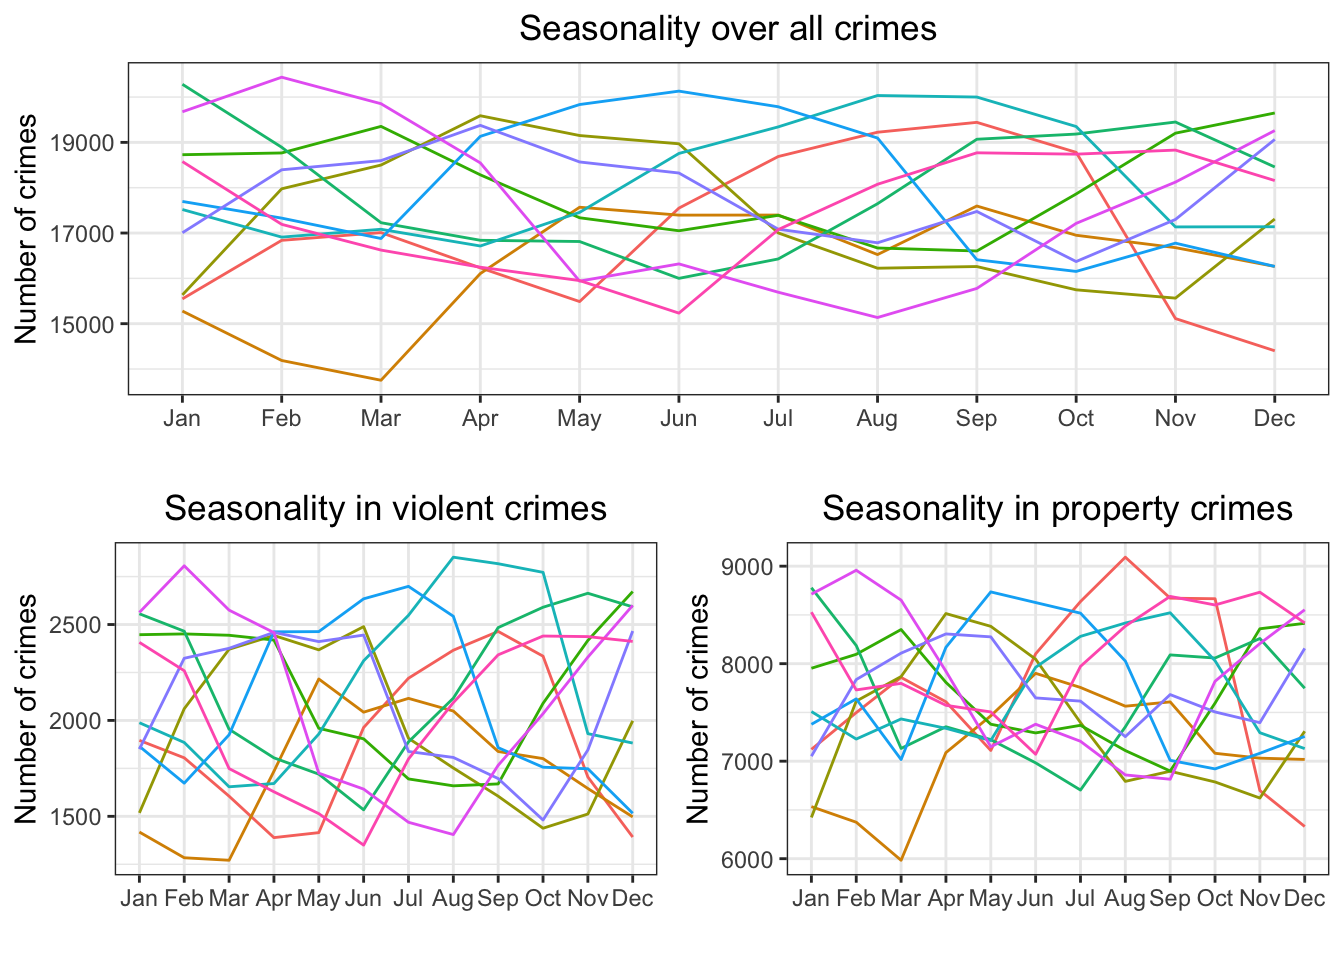
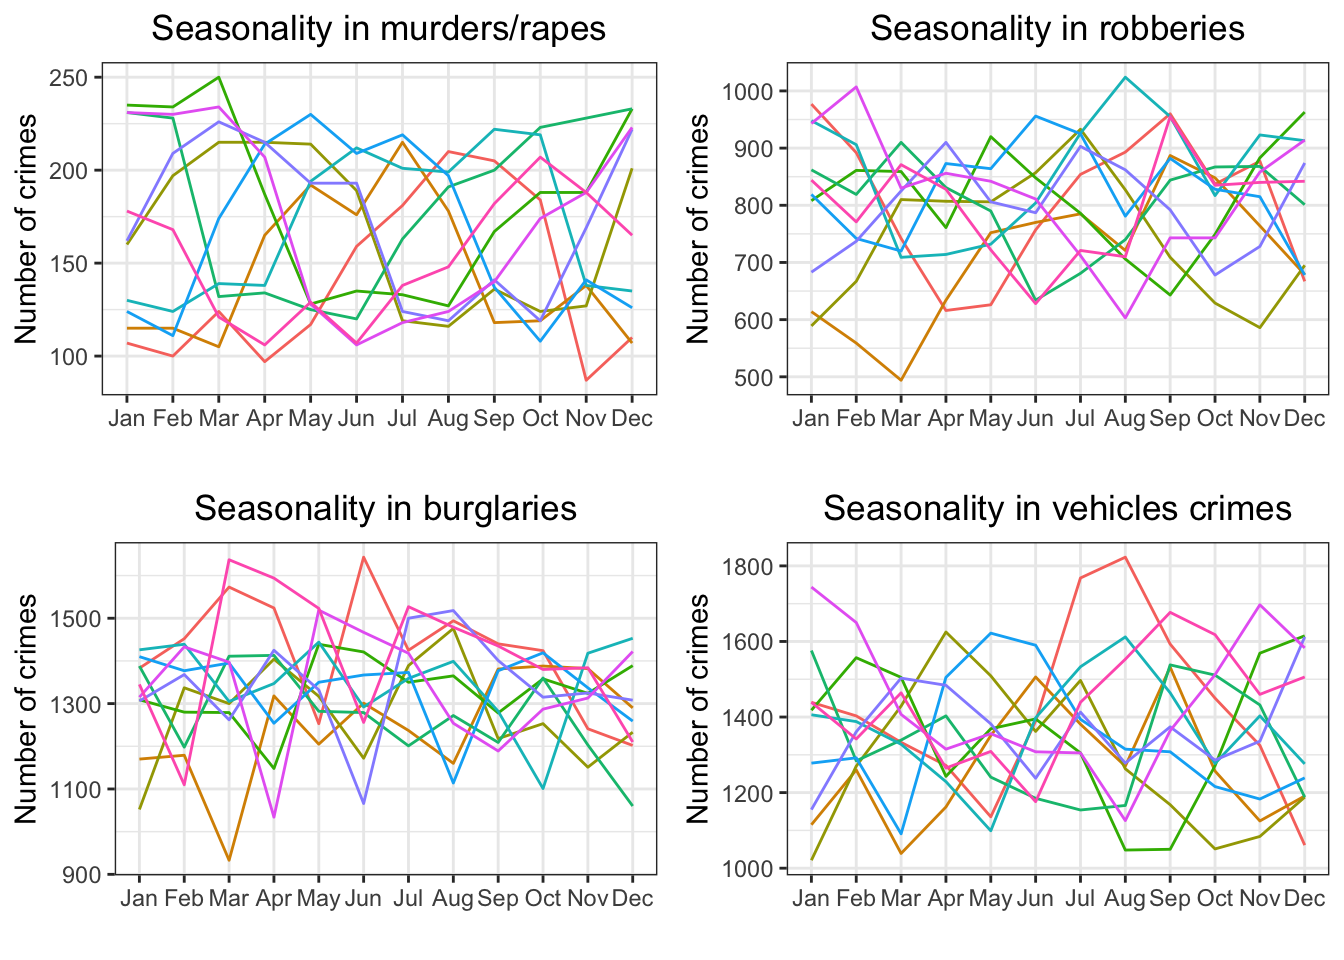
Looking at the previous graphs, it cannot be concluded that there is a clear form of seasonality happening in the overall crimes as well as within each category.
2.2.4 Are crimes following a trend?
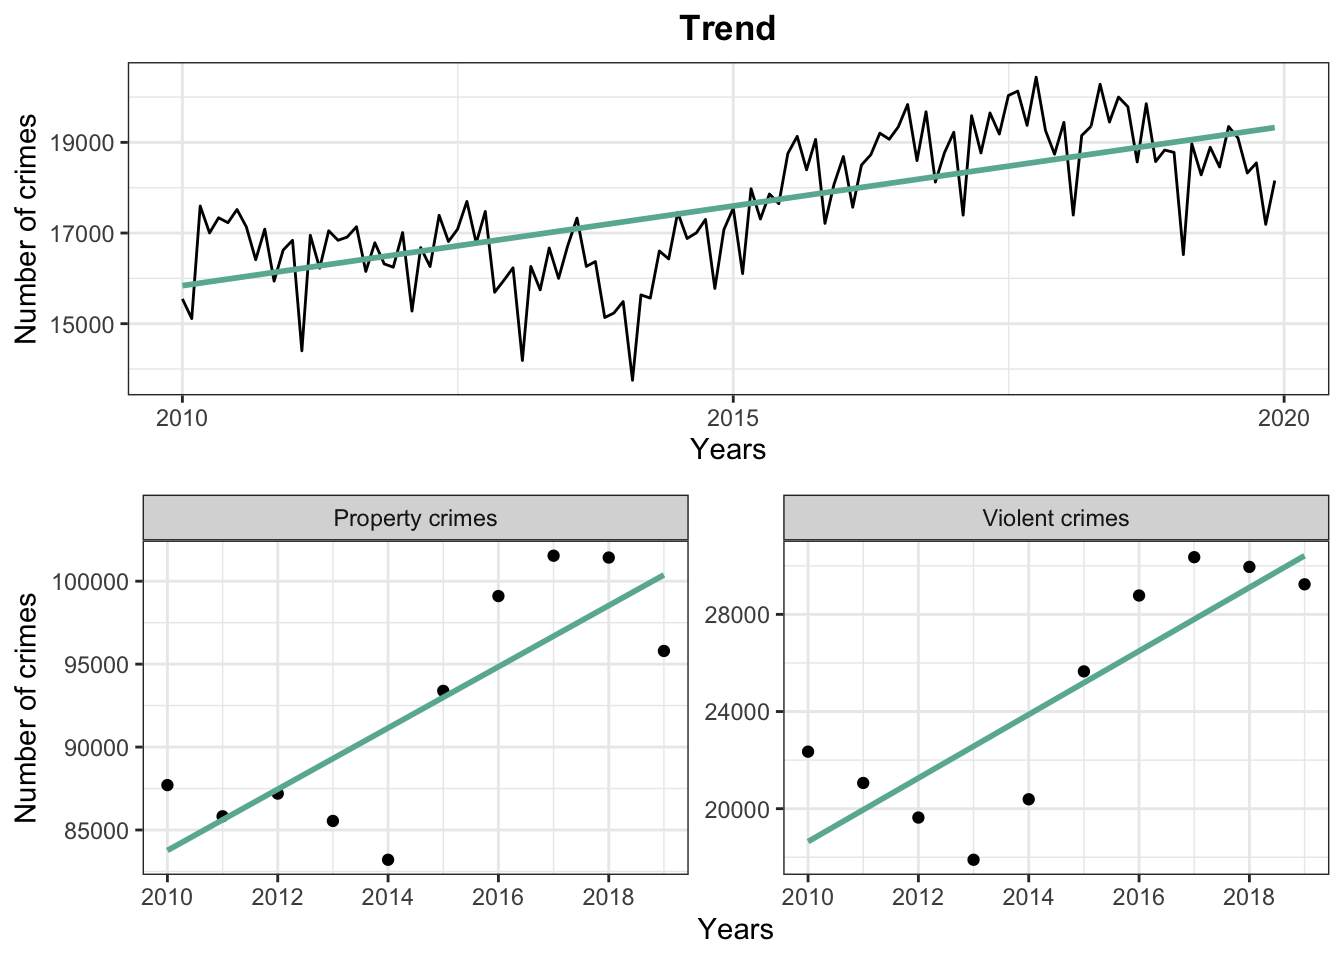
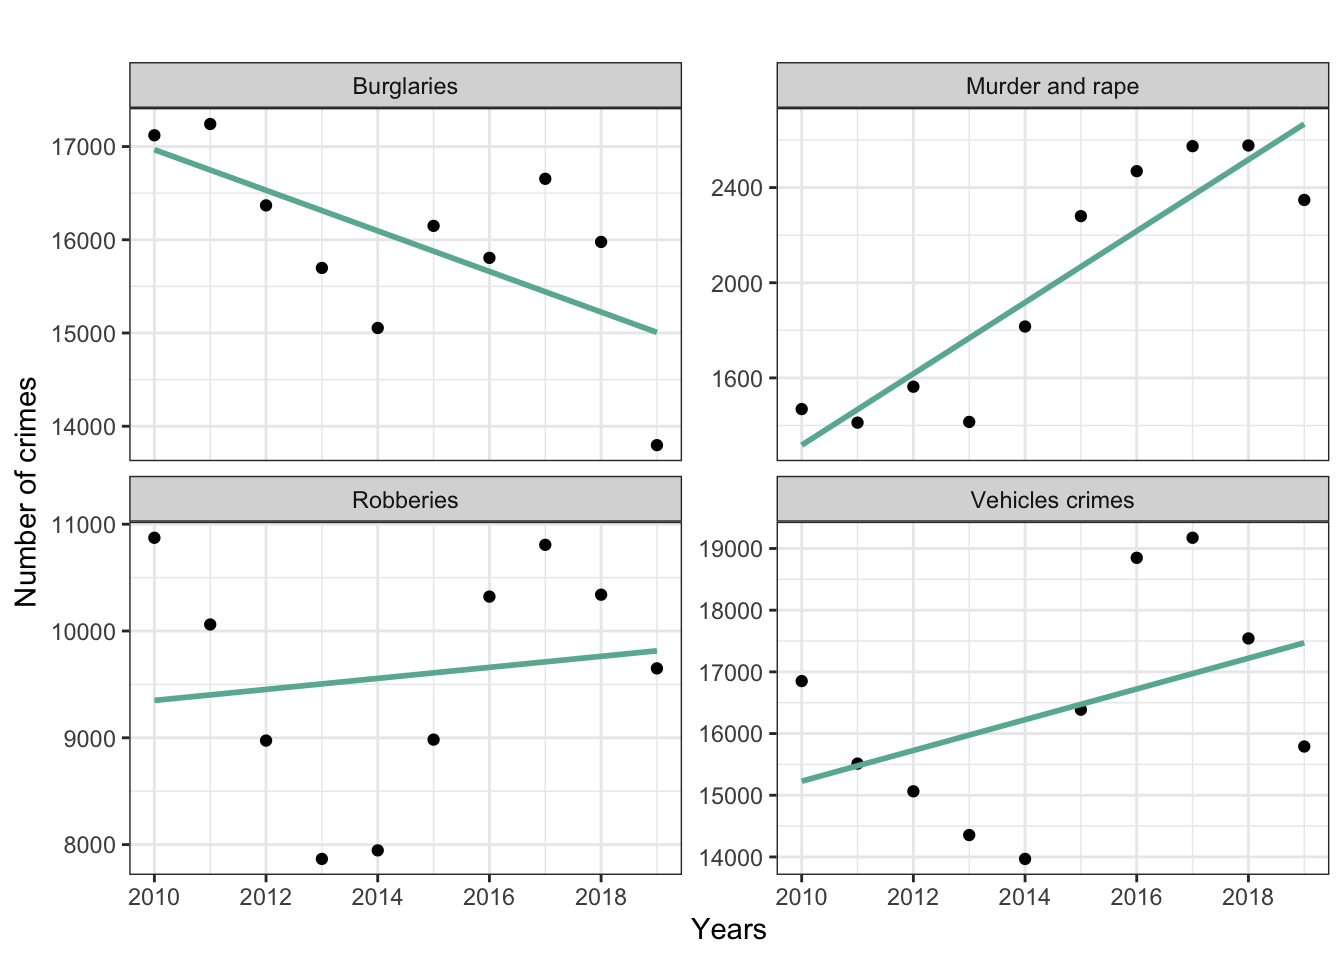
Regarding the trend, we notice that the overall criminality is following an upward trend. The same follows in each crime category except for one category: burglaries. Indeed, the burglaries are significantly decreasing over the past 10 years and reaching the minimum in at least ten years in 2019. Moreover, we notice that crimes all the other types of crimes are following a common pattern. They are decreasing until 2013 and increasing from this date. The only major event that happened during those years was the election of a new major at Los Angeles. The raise in criminality could be linked to this event as there is often a correlation between the election of a new mayor and a change in the criminality.
2.2.5 What is the level of crime by neighbourhood?
Interestingly, we notice that crimes are mostly occuring in the center of Los Angeles as well as the biggest part of the San Fernando Valley (northern part of the city) and San Pedro. After some researches, we found out that the part of the San Fernando Valley highlighted are mostly so-called “ghetto”, San Pedo is considered by many as a dangerous Blue-Collar city. In light of those informations, we notice that the data is reflecting the general opinion. Regarding the city center area, this could be explained by the touristic attraction, various commerces and business.
In order to have a better understanding of the situation, it is interesting to look at it with a graph:
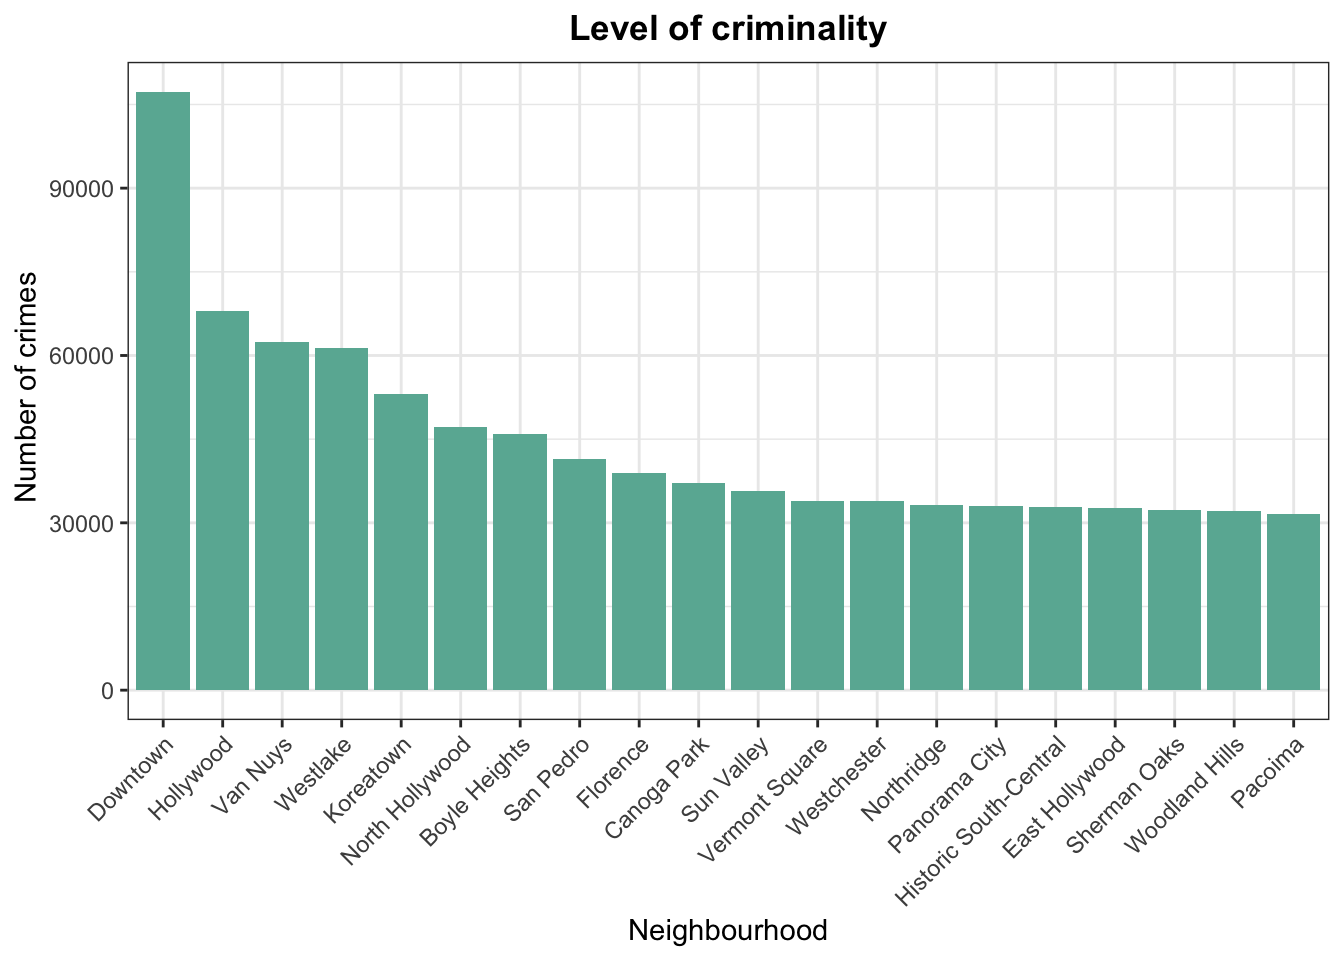
The neighbourhoods that we could define as “rich” have the highest number of crimes. This is an interesting observation that could be explained by the apparent wealth that drives criminals to act in their neighbourhoods in the hope of better payoffs. The first “low income” neighbourhood is Van Nuys, part of the San Fernando “ghetto”, located “only” at the third place.
2.2.6 What is the number of crime per 100’000 inhabitants in each category per neighbourhood?
Note: you can click on the upper right square to select which type of crime you wish to diplay.
Firstly, It can be noted that Angeles Crest is often in a relatively high class, this is due to the very small population leading to a fast increase in those scores.
Secondly, we can notice that the center of Los Angeles has the highest number of crimes in all the category, this is probably linked to the previous comment we made. We can notice that San Pedro and the few neighbourhood in the San Fernando Valley have mainly crimes linked to Property and burglaries. These types of crimes are typical of poor neighborhoods.
We thought that it might be a good idea to look at this criminality in another way. Thus, we created for each class a score based on the quantiles. We split the criminality in 4 or 5 quantiles depending on the repartition of criminality per 100’000 inhabitant.
This map is more interesting than the previous one as it allows to have a better vision of the locations were the majority of each type of crime is happening. Additionally, we note that most of the area with a high score are the one we identified earlier.