Section 4 March 2, 2023
Welcome to our first meeting of 2023! It’s been a while, so let’s reorient. Our goal is to move through each of the following tasks, which range from beginner, to advanced user. Your goal is to work together or alone and progress through. You must draw on the internet as a resource, but always feel free to me. :)
Becoming familiar with a new language is hard. It takes patience and problem-solving. If at any point you are lost, use Google or the help feature. If a function isn’t working, run “?function”. For example, to know more about the mean() function, I can type ?mean. Try it.
4.1 Creating Objects and Simple Functions
- Copy, paste, and run the following code into your R script:
x <- 20You have created an object called x, who’s value is 20. Create another object called
ywho’s value is 5.Add x and y. What do you get?
Copy, paste, and run (CPR) the following:
a <- c(5, 6, 4, 5, 8)This is a concatenated (c()!!) list of numbers. Create a new list of numbers called “my_numbers” that contain two numbers: the year you were born and the current year.
You can call on a specific item in a list by putting square brackets at the end of an object calling on the item you want to pull from the list. For example, running my_numbers[1] should return the year you were born.
Subtract the second item in mynumbers with the first item. What you do get (note: it’s only March, so it will probably be off by 1)?
4.1.1 Basic Functions
- CPR the following code:
your_data <- data.frame(x = c(6,5,7,8,4,5,5,8),
                        y = c(8,9,8,7,7,6,10,11))
Function do many things. Some do simple things like calculate sums or means, others can run ANOVAs and correlations, others make nice figures, and some post Tweets on Twitter (yes). They are very versatile. Many exist for almost anything you can think of. If not, you can make your own.
Let’s use a couple of simple functions: mean() and sd(). You call on a function by typing it, and you specify arguments in the brackets. mean() requires a list of numbers. Above you create an object called ‘a’, that was a list of numbers. Run the following: mean(a). What do you get?
Try to calculate the standard deviation of “a”.
4.1.2 Calling variables within data frames
- You can call variables in data frames in many ways. For now we will use one method. You can call the data frame, then put a ‘\(', then the variable's name (R will nicely show all teh variables once you type '\)’). For example, type ‘your_data$’. ‘x’ and ‘y’ should pop up. Try to calculate the mean and standard deviation of both x and y in the data frame.
4.2 Installing and loading packages.
Packages contain functions. Many are built into R (like mean(), etc). Many are not and you must install them. You can install packages using the install.packages() function. The package name needs to be in ” “. Otherwise, you can use the window on teh bottom right. It has ‘Packages’. From there you can ‘Install’. Common packages will pop up as you type.
- Try to install the “faux” package.
Once installed, you need to load it. You will need to do this every time you open R. You load packages using library(), with the package name NOT in ” ” in the brackets. You will need a new library() for each package you want to load.
- Load the tidyverse and the faux package.
4.3 Basic Data Stuff
CPR the following code (must have loaded the tidyverse and faux packages):
set.seed(20)
dat <- rnorm_multi(n=50, vars=3,
                   mu = c(10, 10, 10),
                   sd = c(2, 3, 2),
                   r = c(.3, .2, .1),
                   varnames = c('x', 'y', 'z')) %>%
  mutate(Group=rep(c("A", "B"), each=25))
Install and load the skimr package. Run the skim() function on “dat”. What are the means and standard deviations? Notice how this function combines many things to make it more streamlined (calculate mean and sd for all vars in a data frame versus the way you did above; e.g., mean(dat$x)).
Review the past week’s material, use Google, and think critically to do the following.
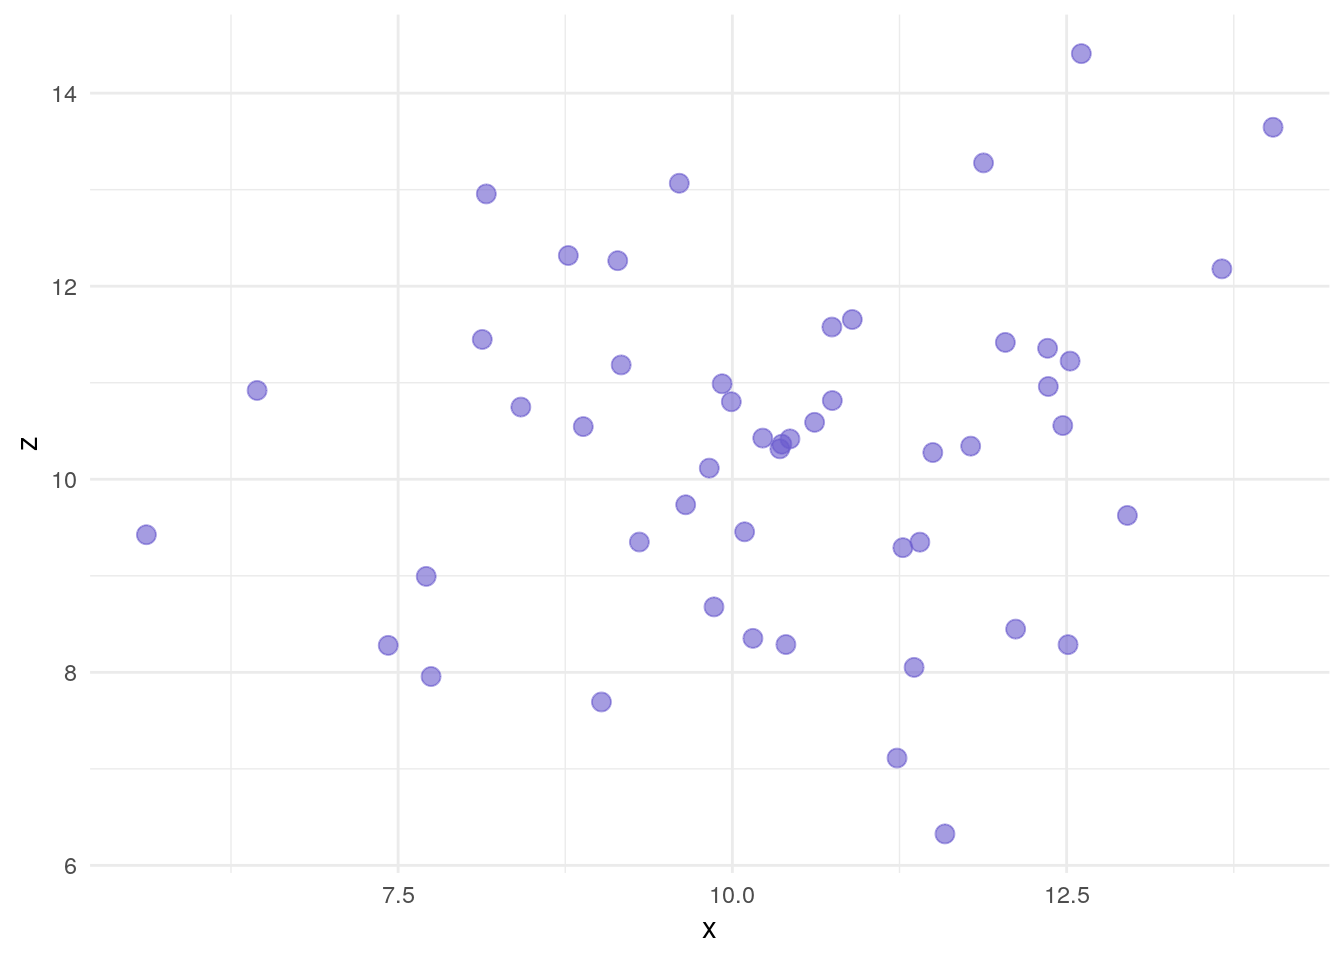
Using ggplot, create a scatterplot of x and y.Just make any old scatterplot.
Way to go. Now try to reproduce the following:
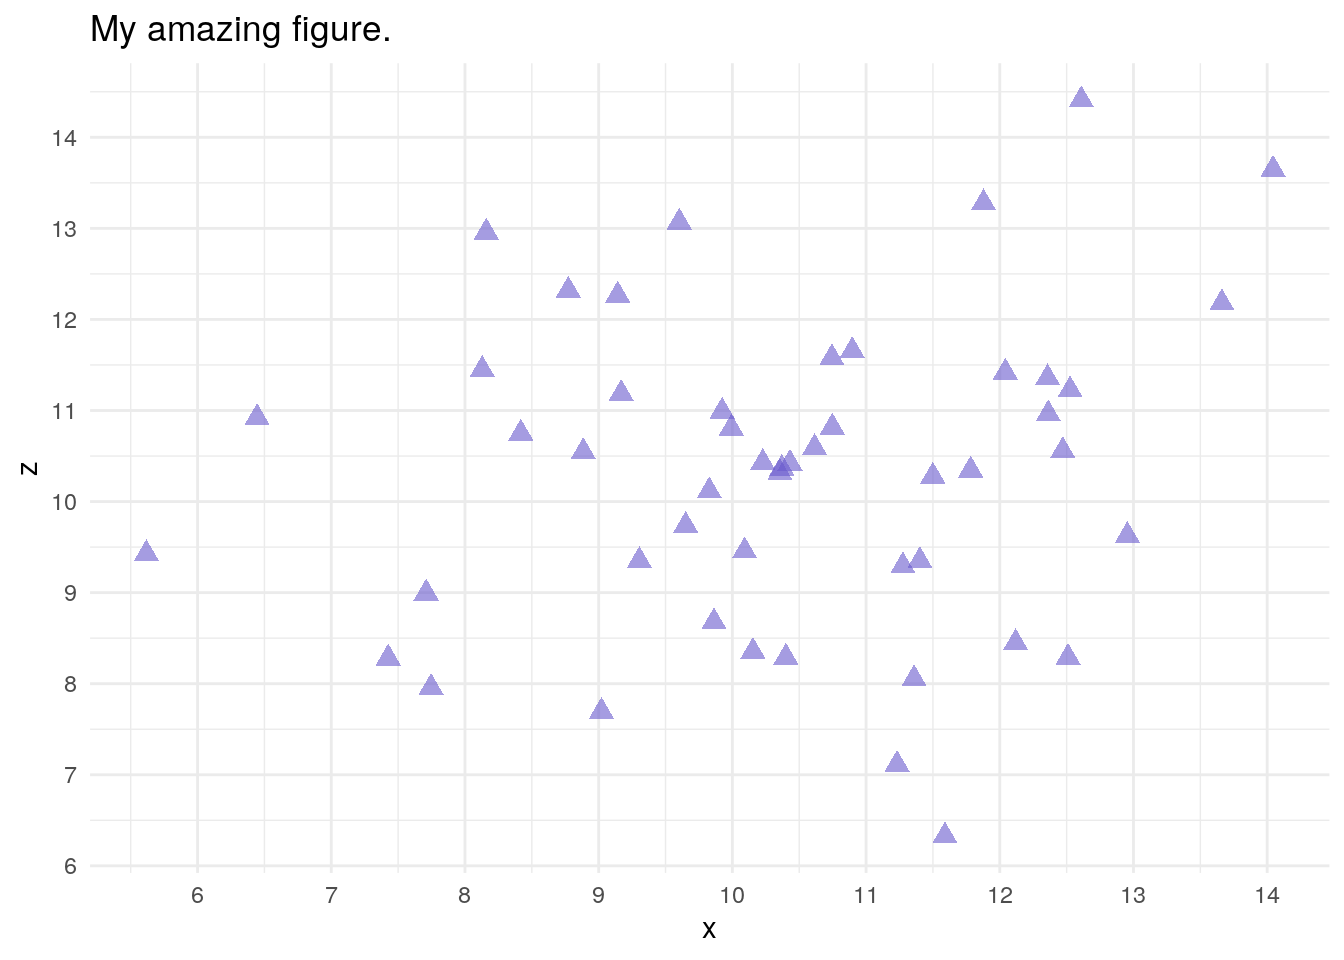
- If you really want to test your reproduce-ability, make this:
Run a correlation on x and y.
What is the squared correlation (coefficient of determination)?
What other variables are in the ‘dat’ data frame?
Run a t-test using “Group” as a IV and ‘x’ as a DV.
Calculate Cohen’s d for the test in #15.
Make a boxplot showing the distribution of ‘x’ for both Groups.
Make a histogram showing the distribution of ‘x’ for both Groups.
4.4 Additional Weekly Challenges
4.4.1 Making Functions
Make a function that calculates the mean three numbers.
Make a function that has two arguments, a and b. The function returns the sum of the square root of each.
4.4.2 Data Analysis
4.4.2.1 Are psych student more empathic?
CPR the following:
set.seed(932789)
dat_c <- data.frame(ID=1:40,
                    Group = rep(c("Psychology",
                                  "Math",
                                  "Chemistry",
                                  "Visual Arts"), each=10),
                    Empathy = round(c(rnorm(10, 15, 3),
                                      rnorm(10, 10, 3),
                                      rnorm(10, 8, 3),
                                      rnorm(10, 12, 3)), 0))
What is the total mean empathy?
What is the empathy of each group?
Run an ANOVA. Conduct post-hoc.
Plot the data.
4.4.2.2 Gotta catch ’em all!
Import the pokedex data set from Brightspace.
What Pokemon is the heaviest?
Which Pokemon that isn’t a ‘Legendary’ is teh heaviest?
Which generation has the most Pokemon?
Which has teh least?
Which ability_1 is the most common?
Which ability_2 is most common?
How many Pokemon don’t have a second ability?
Make a scatterplot of Pokemon’s speed and their attack.
Is attack significantly correlated with speed?