第 6 章 其他可用敘述函數
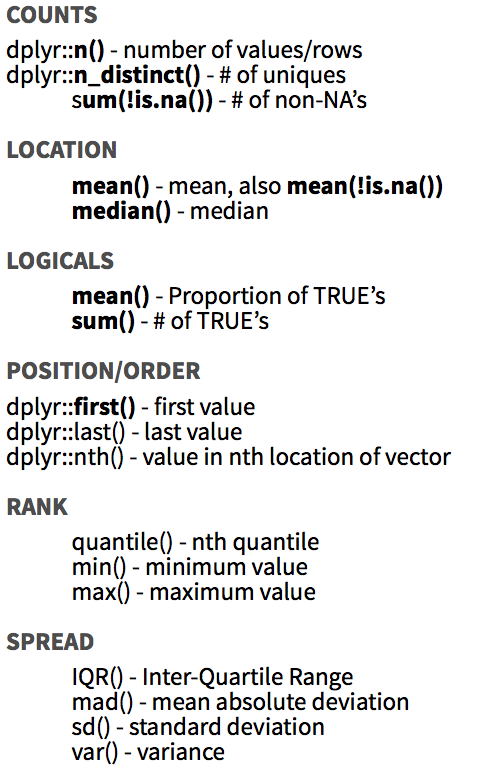
- n: 有多少個觀測值
- n_distinct: 有多少個不重覆觀測值
- sum(!is.na()): 有多少個「非遺漏」值
依不同航空公司(carrier)計算出發延遲平均、標準差 及計算所用樣本數
flights %>% group_by(carrier) %>%
  summarise(
    平均出發延遲=mean(dep_delay,na.rm=T),
    出發延遲SD=sd(dep_delay,na.rm=T),
    有效樣本數=sum(!is.na(dep_delay))
    )
## # A tibble: 16 x 4
## carrier 平均出發延遲 出發延遲SD 有效樣本數
## <chr> <dbl> <dbl> <int>
## 1 9E 16.726 45.91 17416
## 2 AA 8.586 37.35 32093
## 3 AS 5.805 31.36 712
## 4 B6 13.023 38.50 54169
## 5 DL 9.265 39.74 47761
## 6 EV 19.955 46.55 51356
## 7 F9 20.216 58.36 682
## 8 FL 18.726 52.66 3187
## 9 HA 4.901 74.11 342
## 10 MQ 10.552 39.18 25163
## 11 OO 12.586 43.07 29
## 12 UA 12.106 35.72 57979
## 13 US 3.782 28.06 19873
## 14 VX 12.869 44.82 5131
## 15 WN 17.712 43.34 12083
## 16 YV 18.996 49.17 545練習三: 算出不同入學年(入學年)成績資料(transcript.data.new2)中成績平均,標準差,及有效樣本數
transcript.data.new2 %>% group_by(入學年) %>%
  summarise(平均=mean(成績,na.rm=T),標準差=sd(成績,na.rm=T),有效樣本數=sum(!is.na(成績)))
## # A tibble: 5 x 4
## 入學年 平均 標準差 有效樣本數
## <fctr> <dbl> <dbl> <int>
## 1 097 76.92 14.55 1263
## 2 098 77.26 14.14 1099
## 3 099 76.06 13.89 954
## 4 100 70.78 15.72 600
## 5 101 76.87 15.02 214