library(ggplot2)
g1 <- ggplot(mpg,aes(hwy,fill = drv)) +
  geom_histogram(binwidth=1,alpha=0.5) +
  theme_minimal()
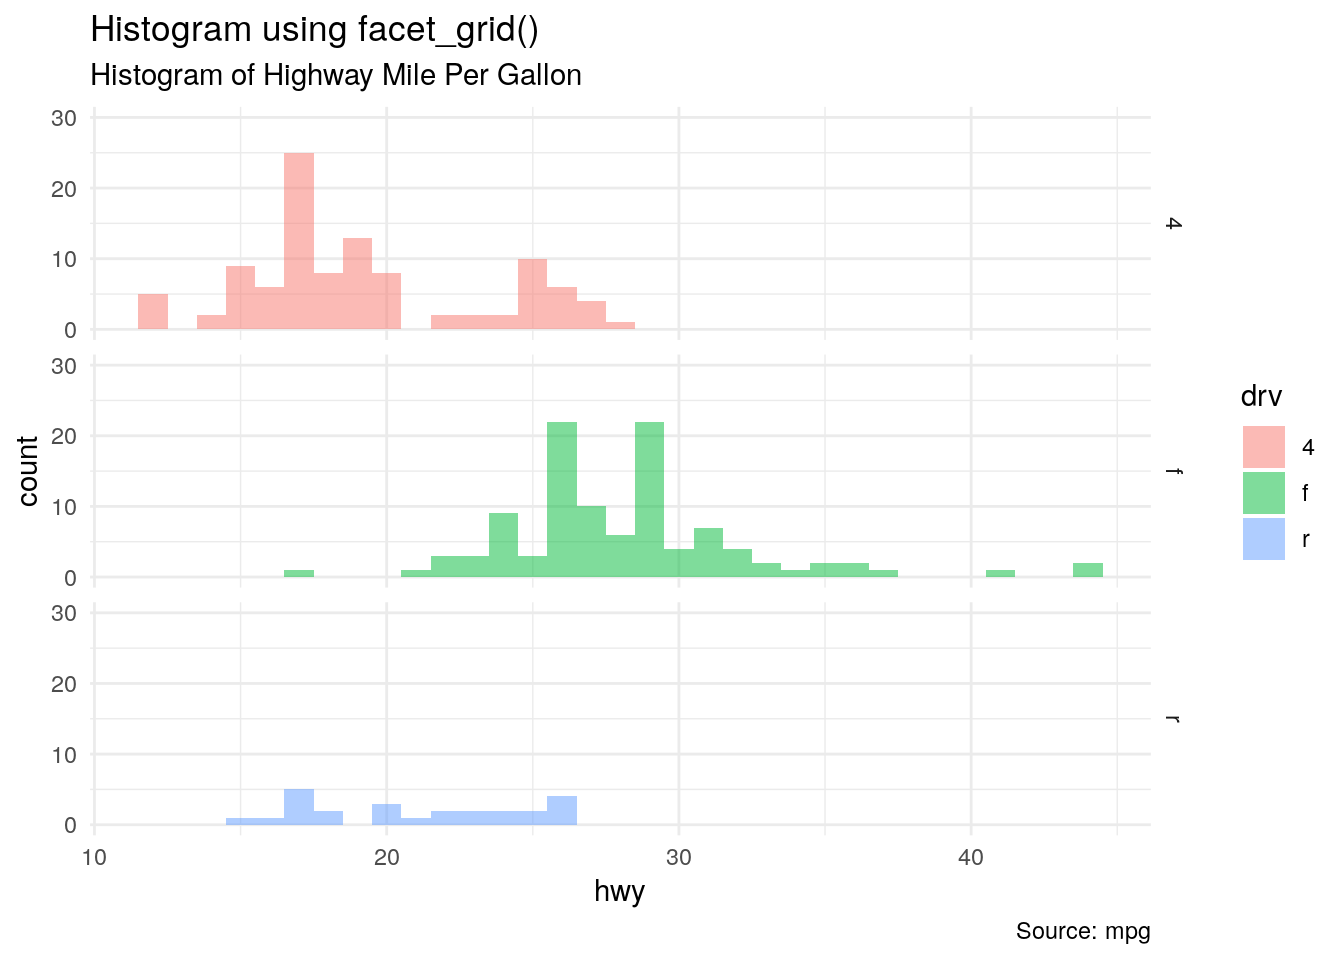
g2 <- g1 +
  ylim(0,30) +
  facet_grid(rows = vars(drv)) +
  labs(title="Histogram using facet_grid()",subtitle = "Histogram of Highway Mile Per Gallon",caption = "Source: mpg")
g2