Chapter 4 Simulation of Disease Loadings
For the disease loadings, we use different mean functions to simulate the progression of disease probabilities over time. We assume that diseases tend to be topic-specific and heavily loaded on a few topics.
library(ggplot2)
library(dplyr)
library(tidyr)
library(reshape2)
library(RColorBrewer)
library(MASS)
library(ggsci)
m=readRDS("samplediseasemerged.rds")
num_sample=K*V
samp=sample(1:nrow(m),num_sample)
sampled_disease=m$diag_icd10[samp]
sampled_pheno=ATM::disease_info_phecode_icd10$phenotype[ATM::disease_info_phecode_icd10$phecode%in%sampled_disease]
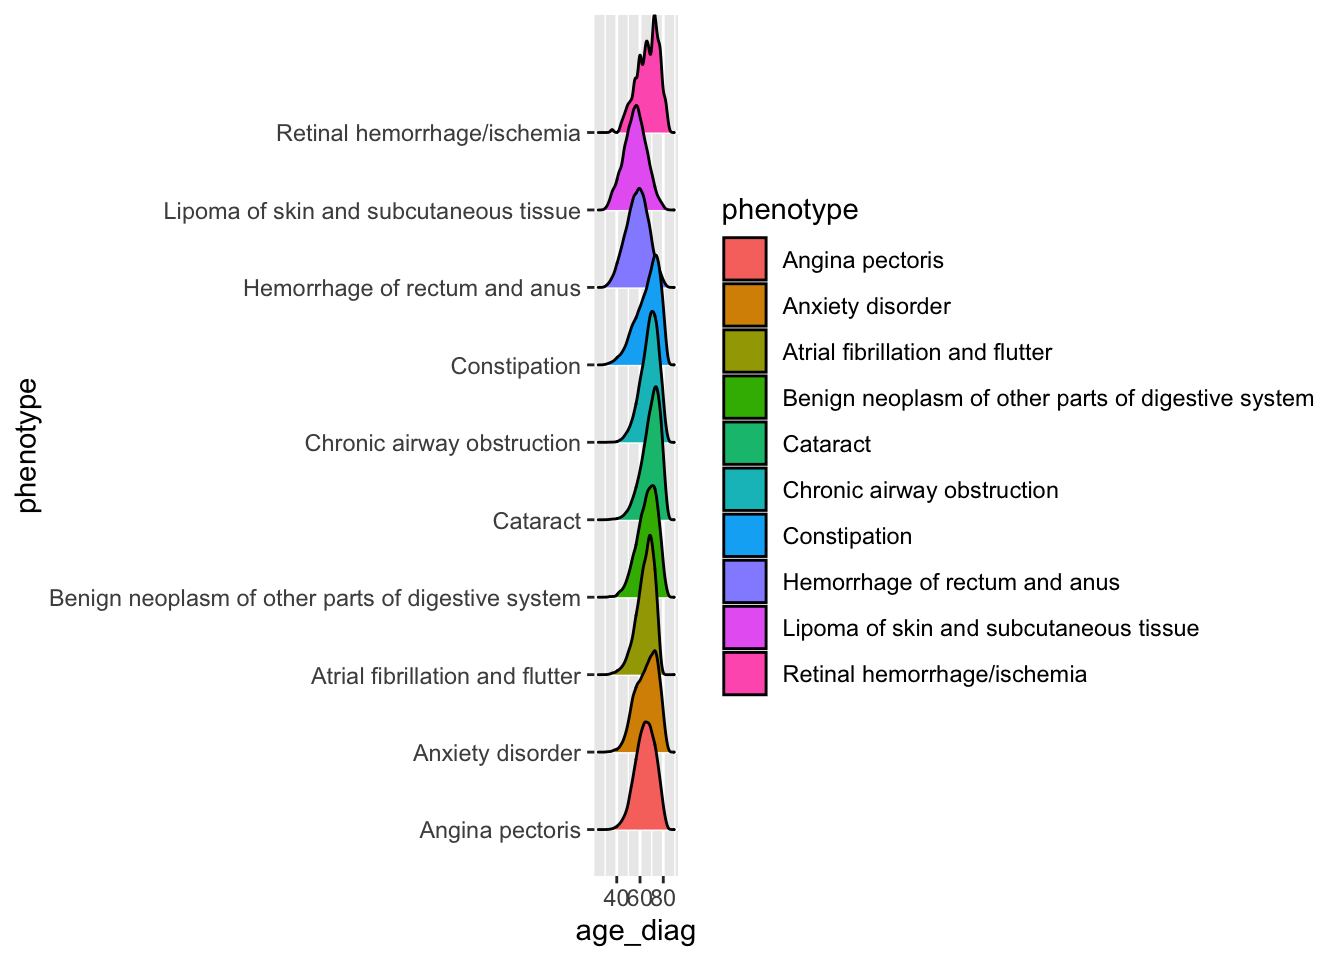
## plot a few sample diseases
ggplot(m[m$diag_icd10%in%sampled_disease[1:10],],aes(x=age_diag,y=phenotype,fill=phenotype))+
ggridges::geom_density_ridges()