1 Demographics
For this recruitment drive, DIME unit through twitter and other platforms encouraged people to submit their applications. We received a strong response on Twitter, with an engagement of more than 10,000 people. In particular, there were calls to applicants from under-represented backgrounds to apply to the 27 available positions. This sections contains information on the demographics of the pool of applicants.

1.1 Gender
In comparison to the current state of economics, which only around 30% of the total doctoral degrees in economics are awarded to women, our pool of applicants has relatively more woman applicants that we underwise would have expected. Nonetheless, we received more applicants from men, about 56.6% of the total (503), and 42.68% (379) from women. Figure 1.1 presents the breakdown by gender.
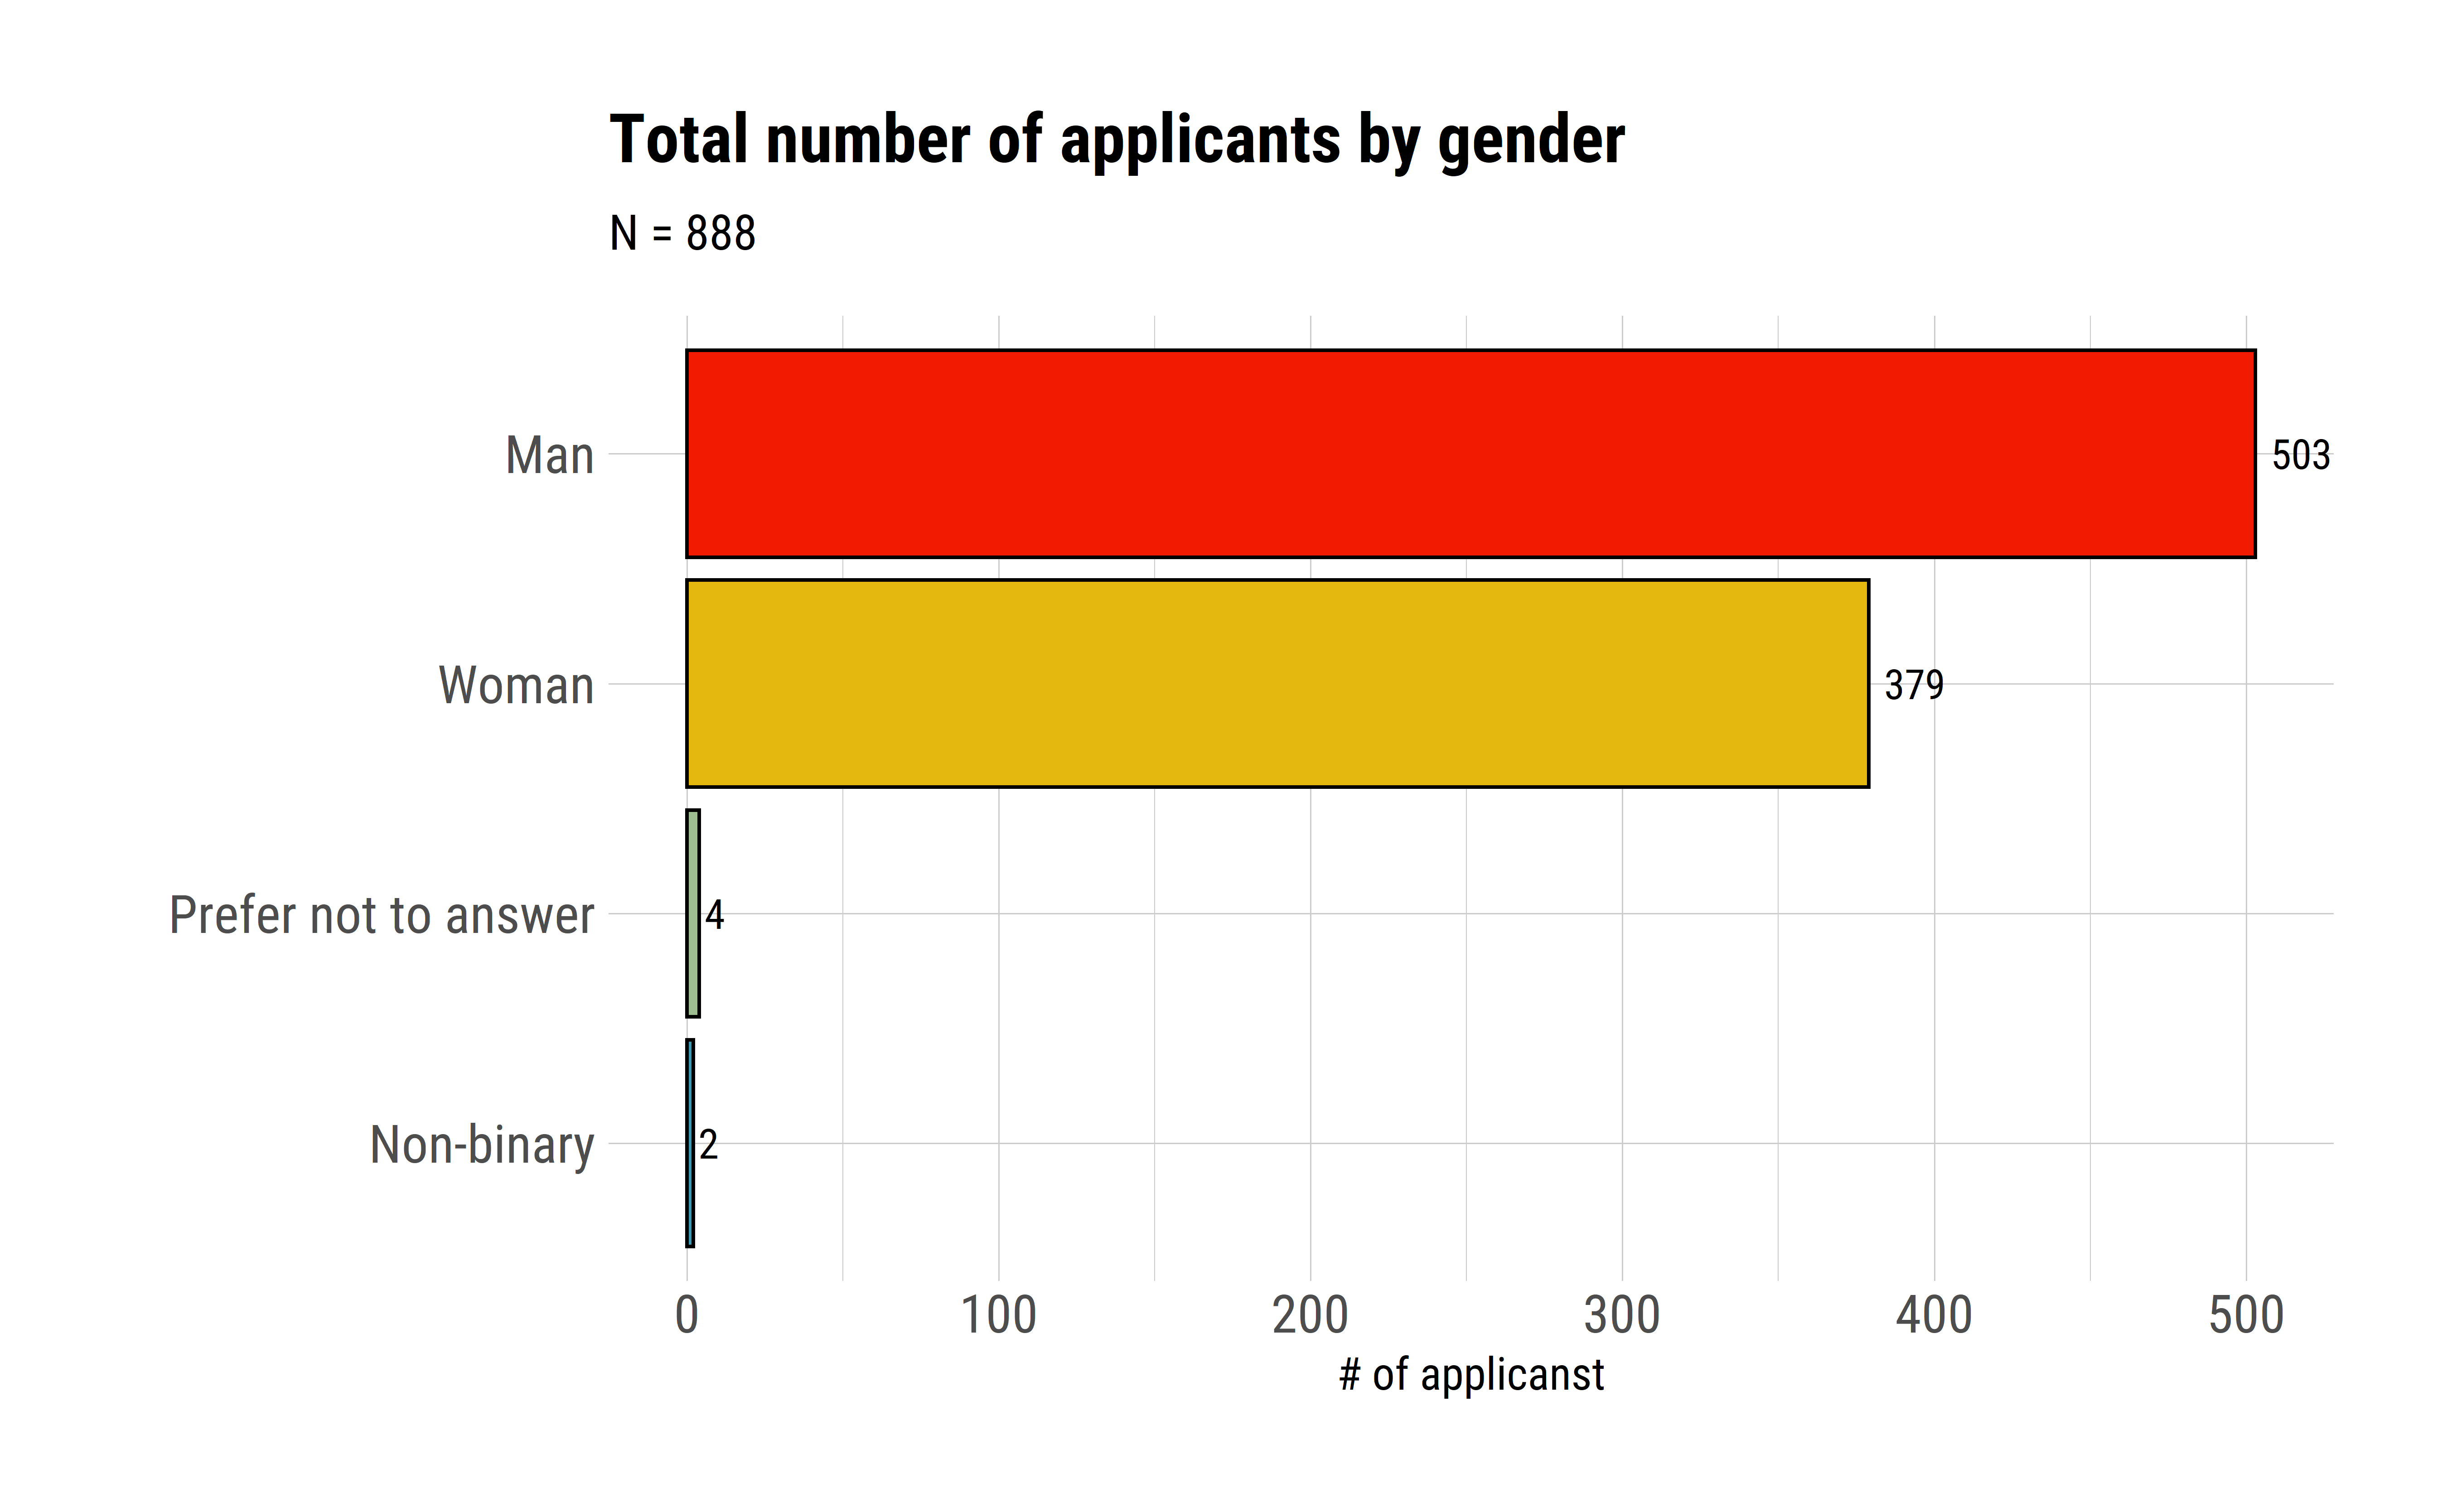
Figure 1.1: Total number of applicants by gender
1.2 Nationalities
1.2.1 Continents
Most of the current pool of projects that were offering positions are situated in Africa. So, we expected to receive more applicants from people from these locations. In fact, as presented in figure @ref{fig:continents}, about 34% of people that applied are from Africa, and around 33% from Asia. In this drive recruitment, as also is represented by current STCs at DIME, Oceania had the lowest number of applicants.
Highlights:
- Most of the applicants come from Africa and Asia.
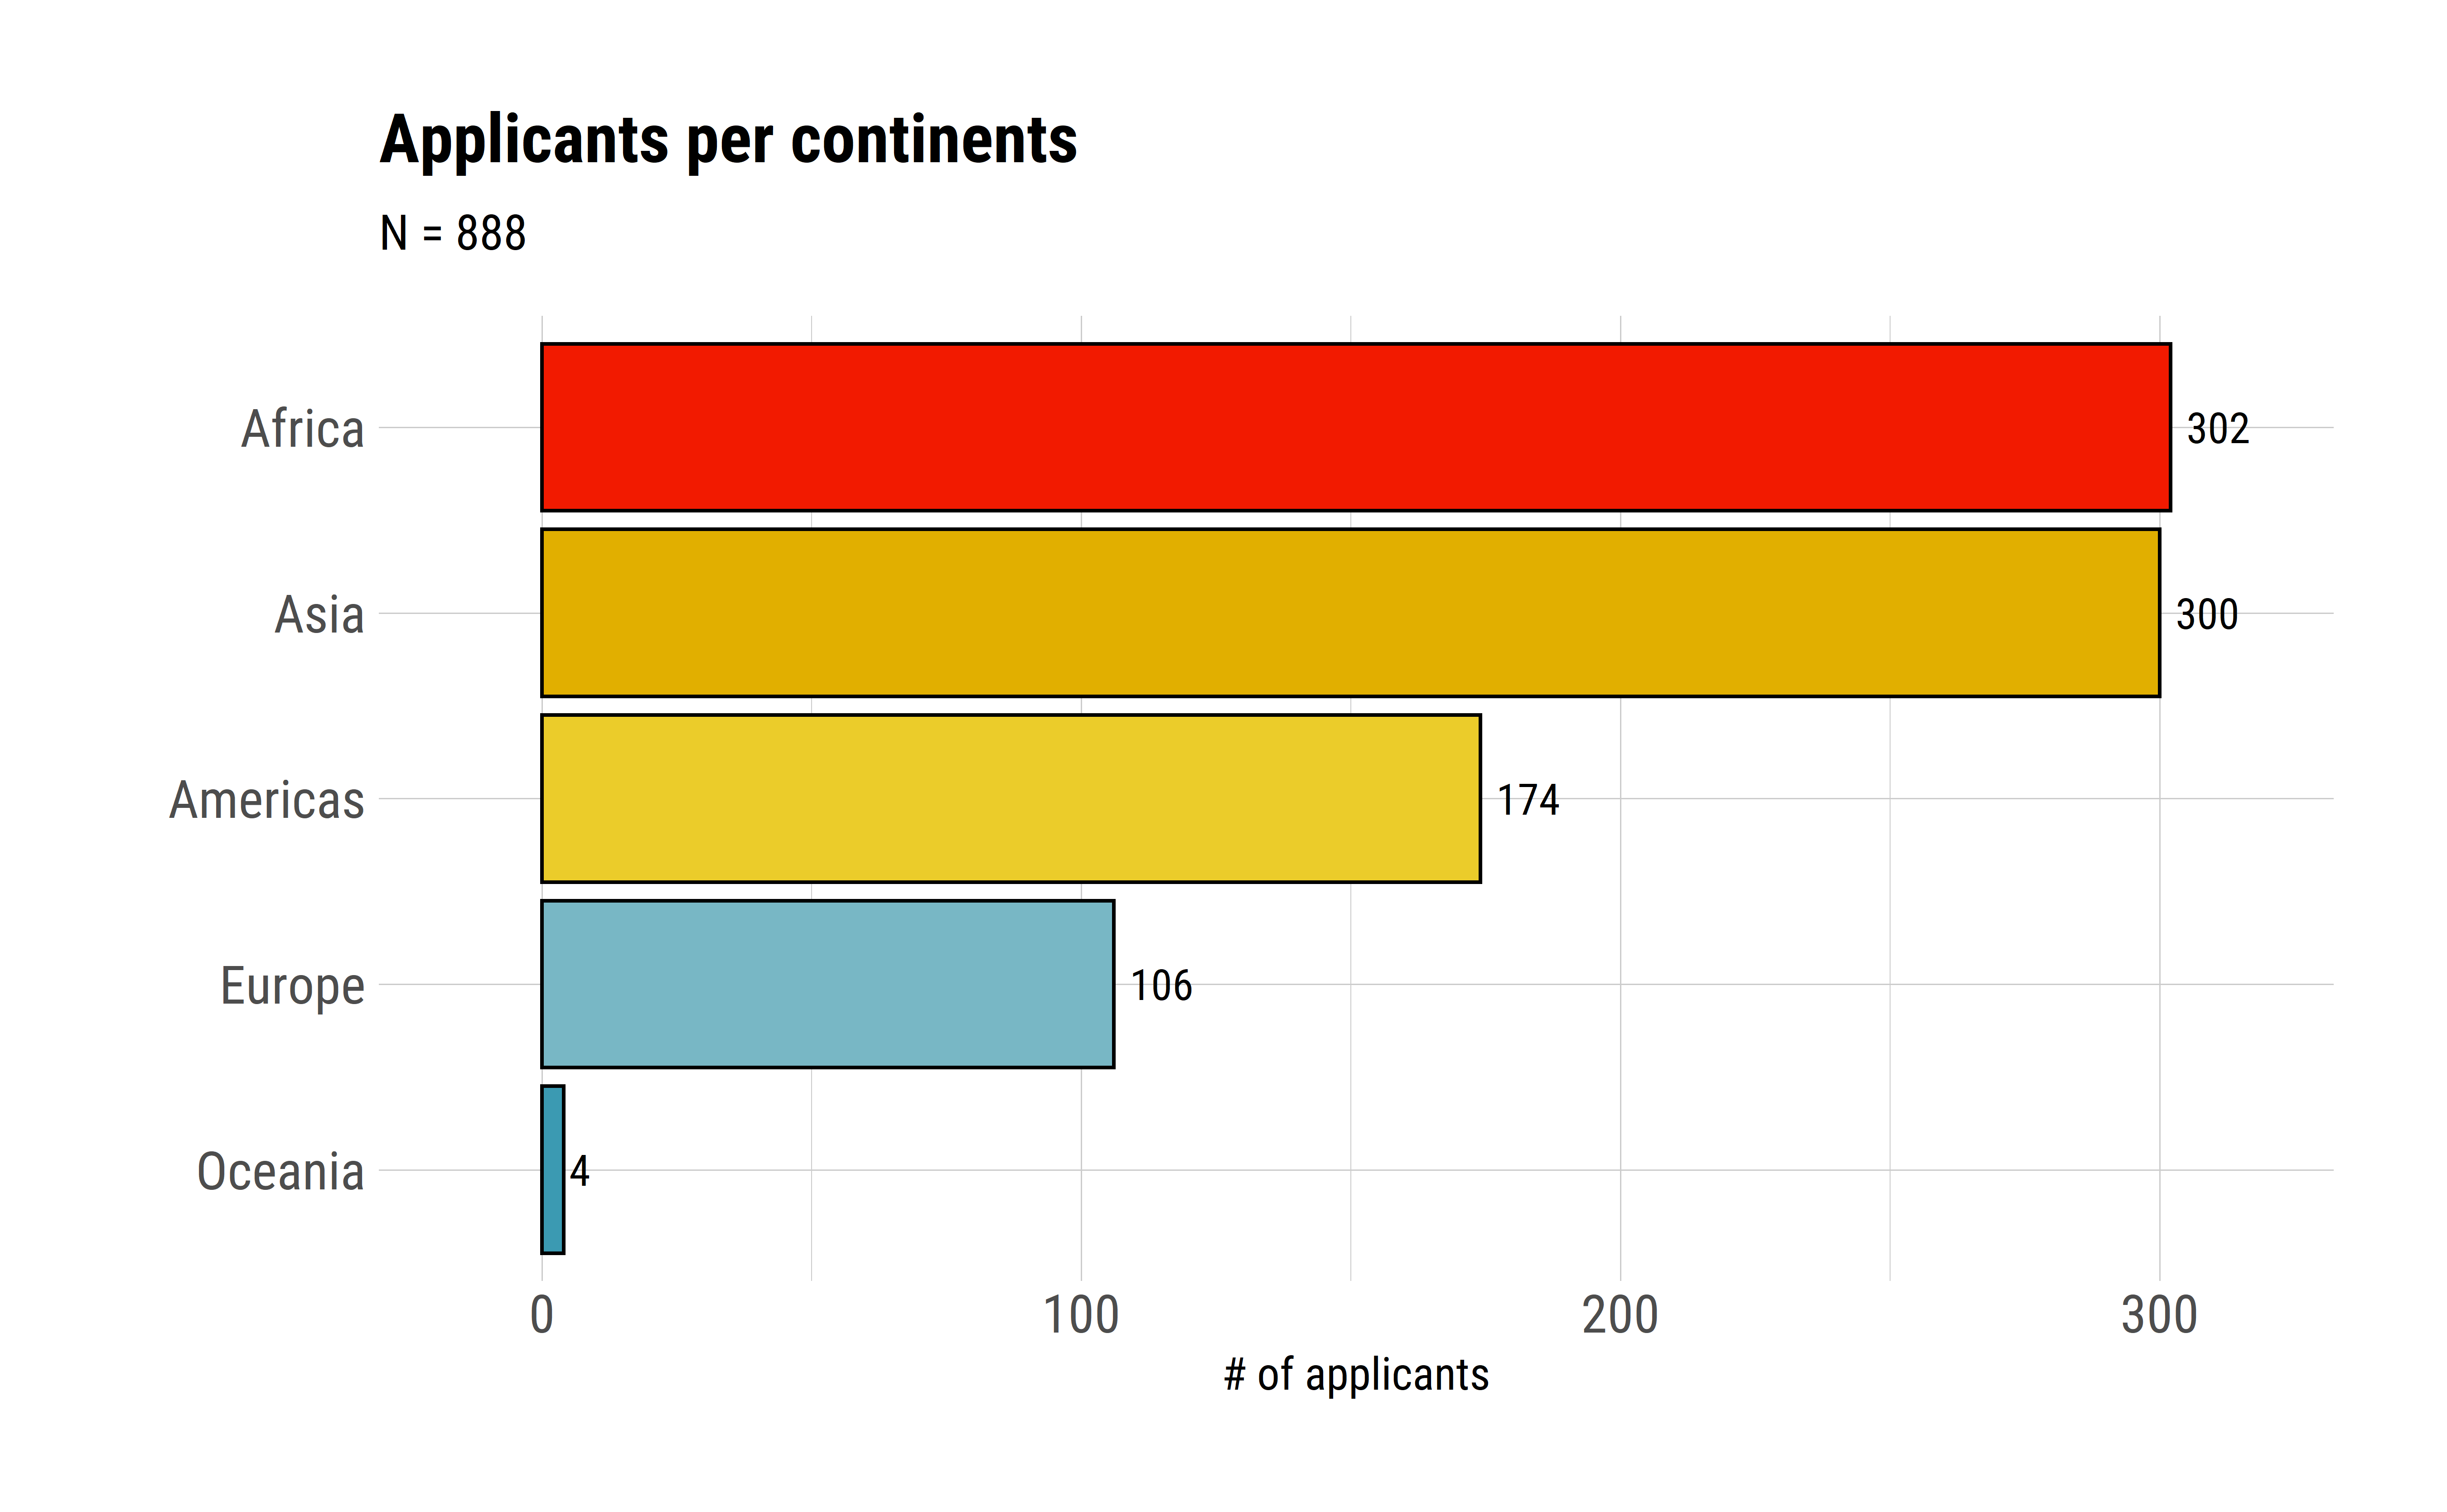
Figure 1.2: Applicants by continent
1.2.2 Countries with most applicants
On the other hand, if we look country of origin, most of the applicants come from India, followed by China, Pakistan, Kenya, and Colombia.
Highlights:
- Indian people represent 13% of all applications.
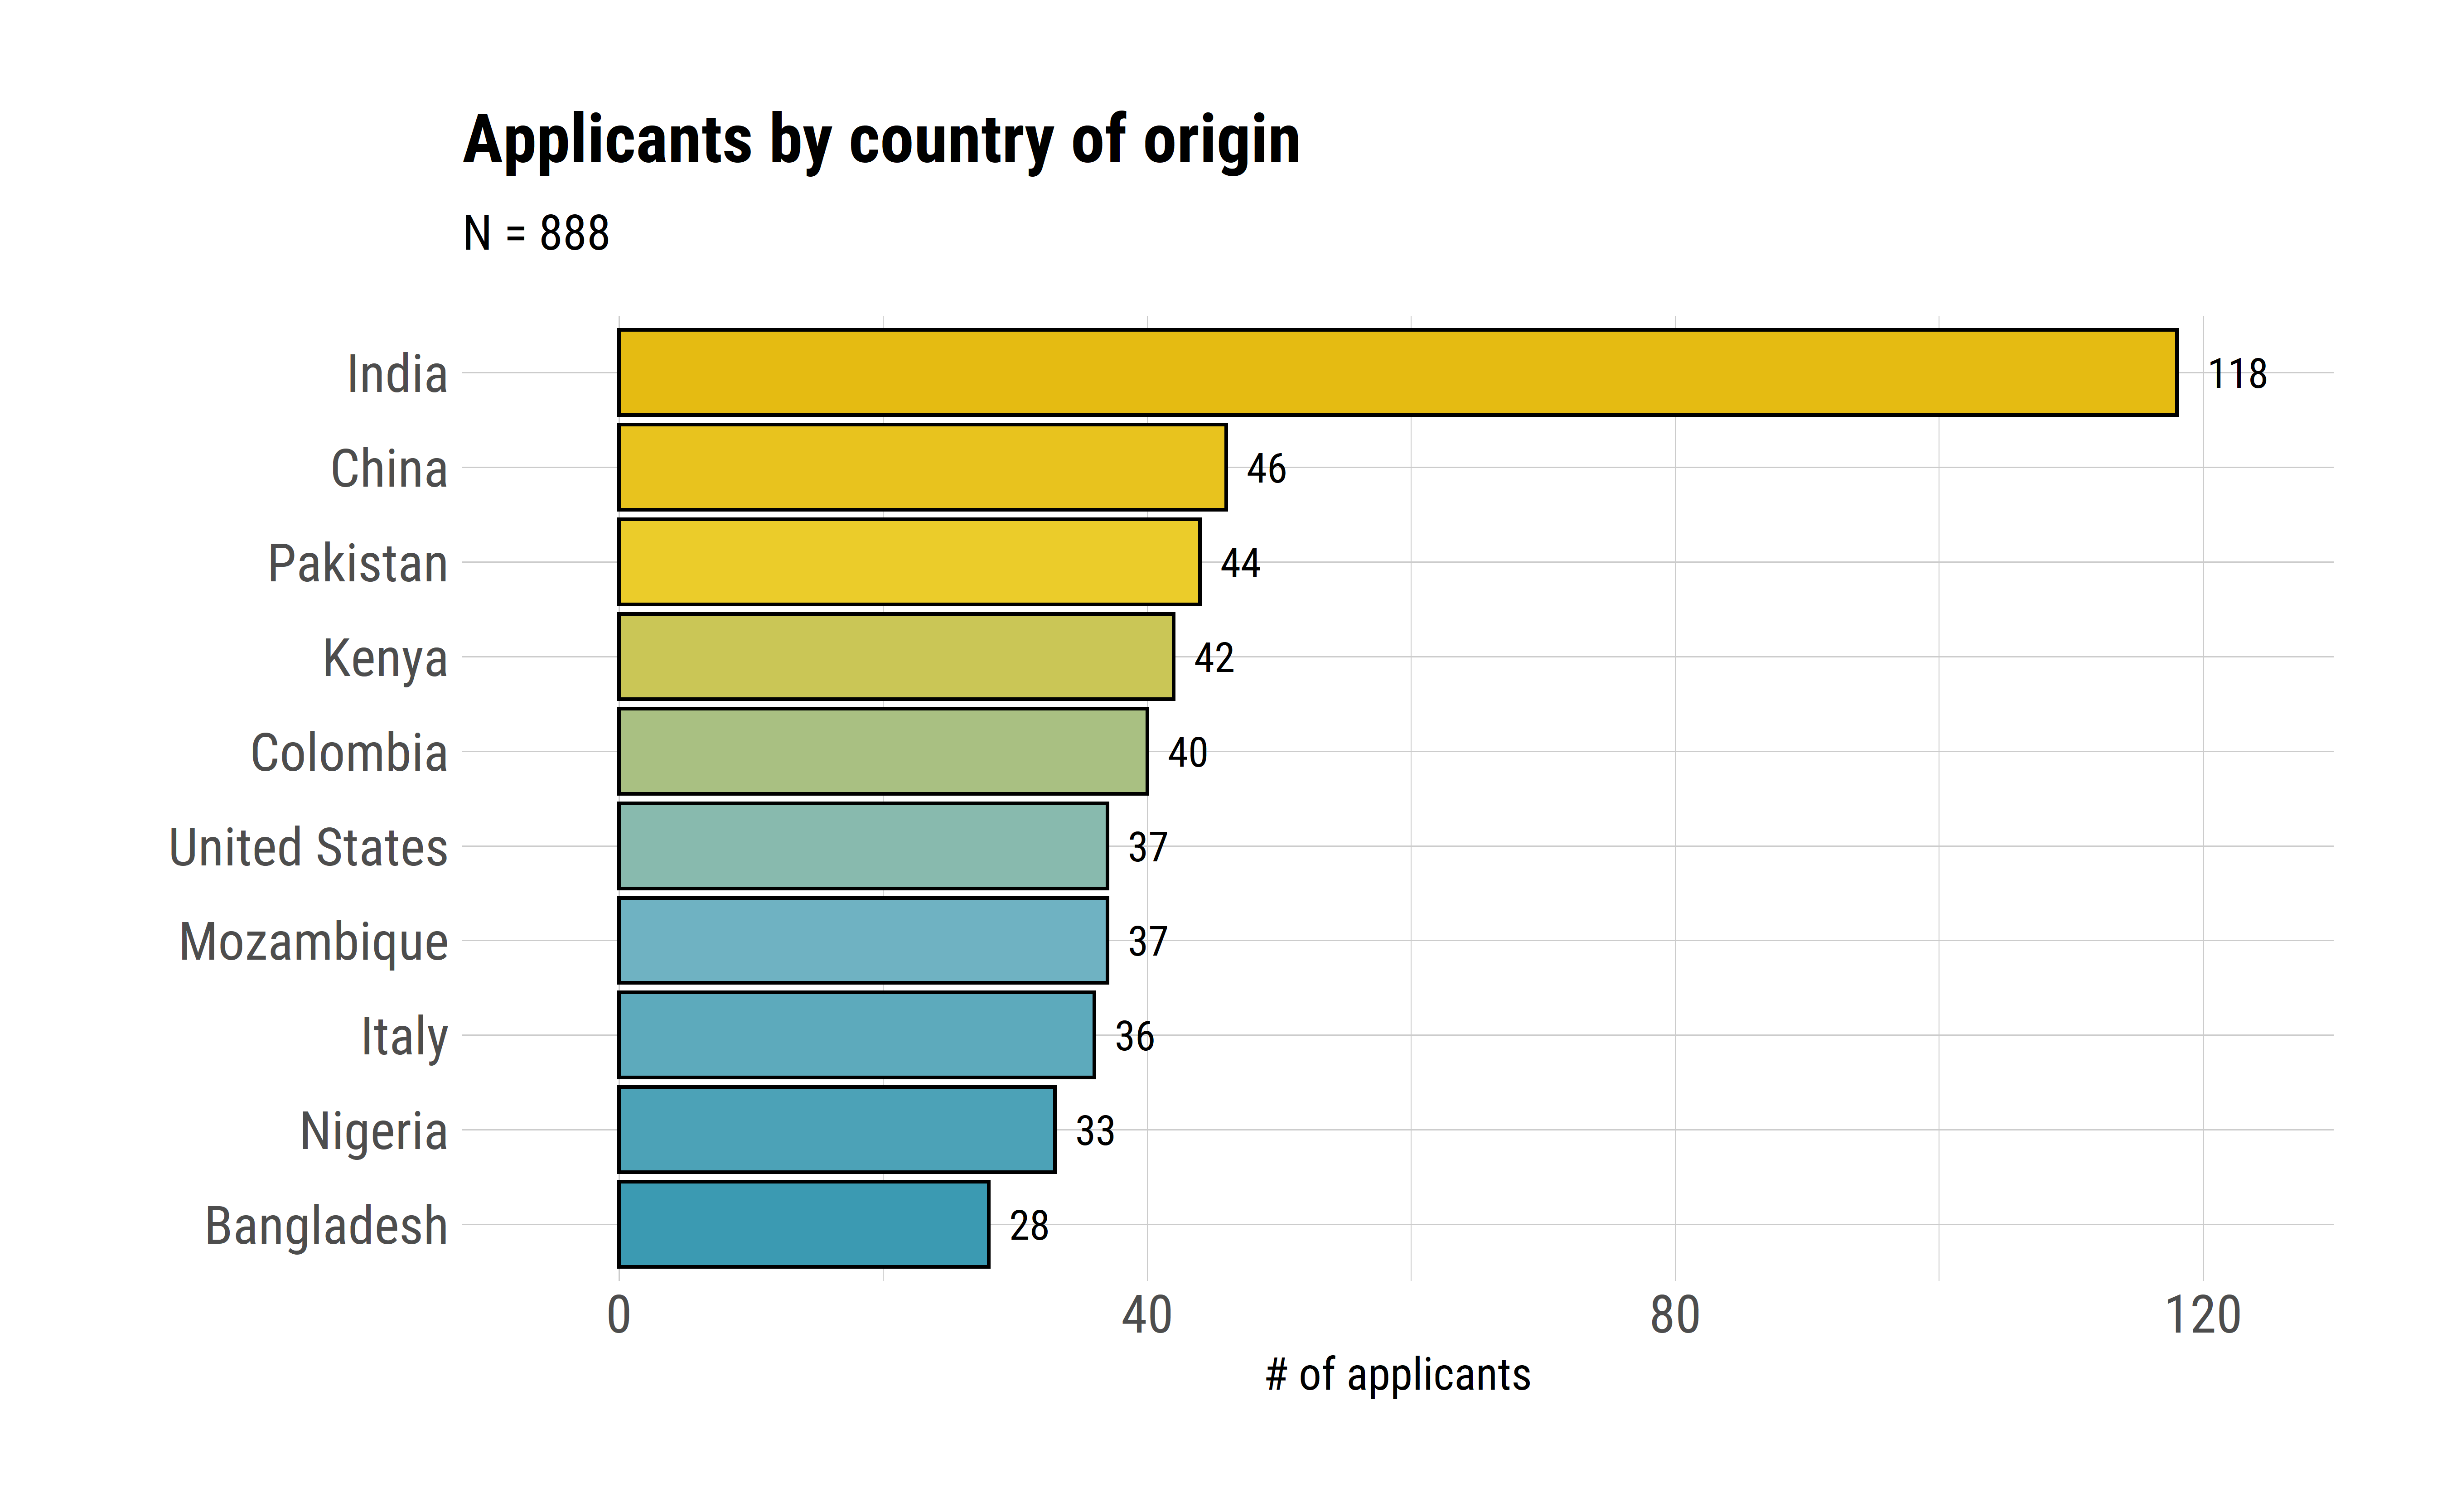
Figure 1.3: Country of Origin
We also present the total number of applicants by continent in which other countries stand out such as Brazil, France, and Germany.
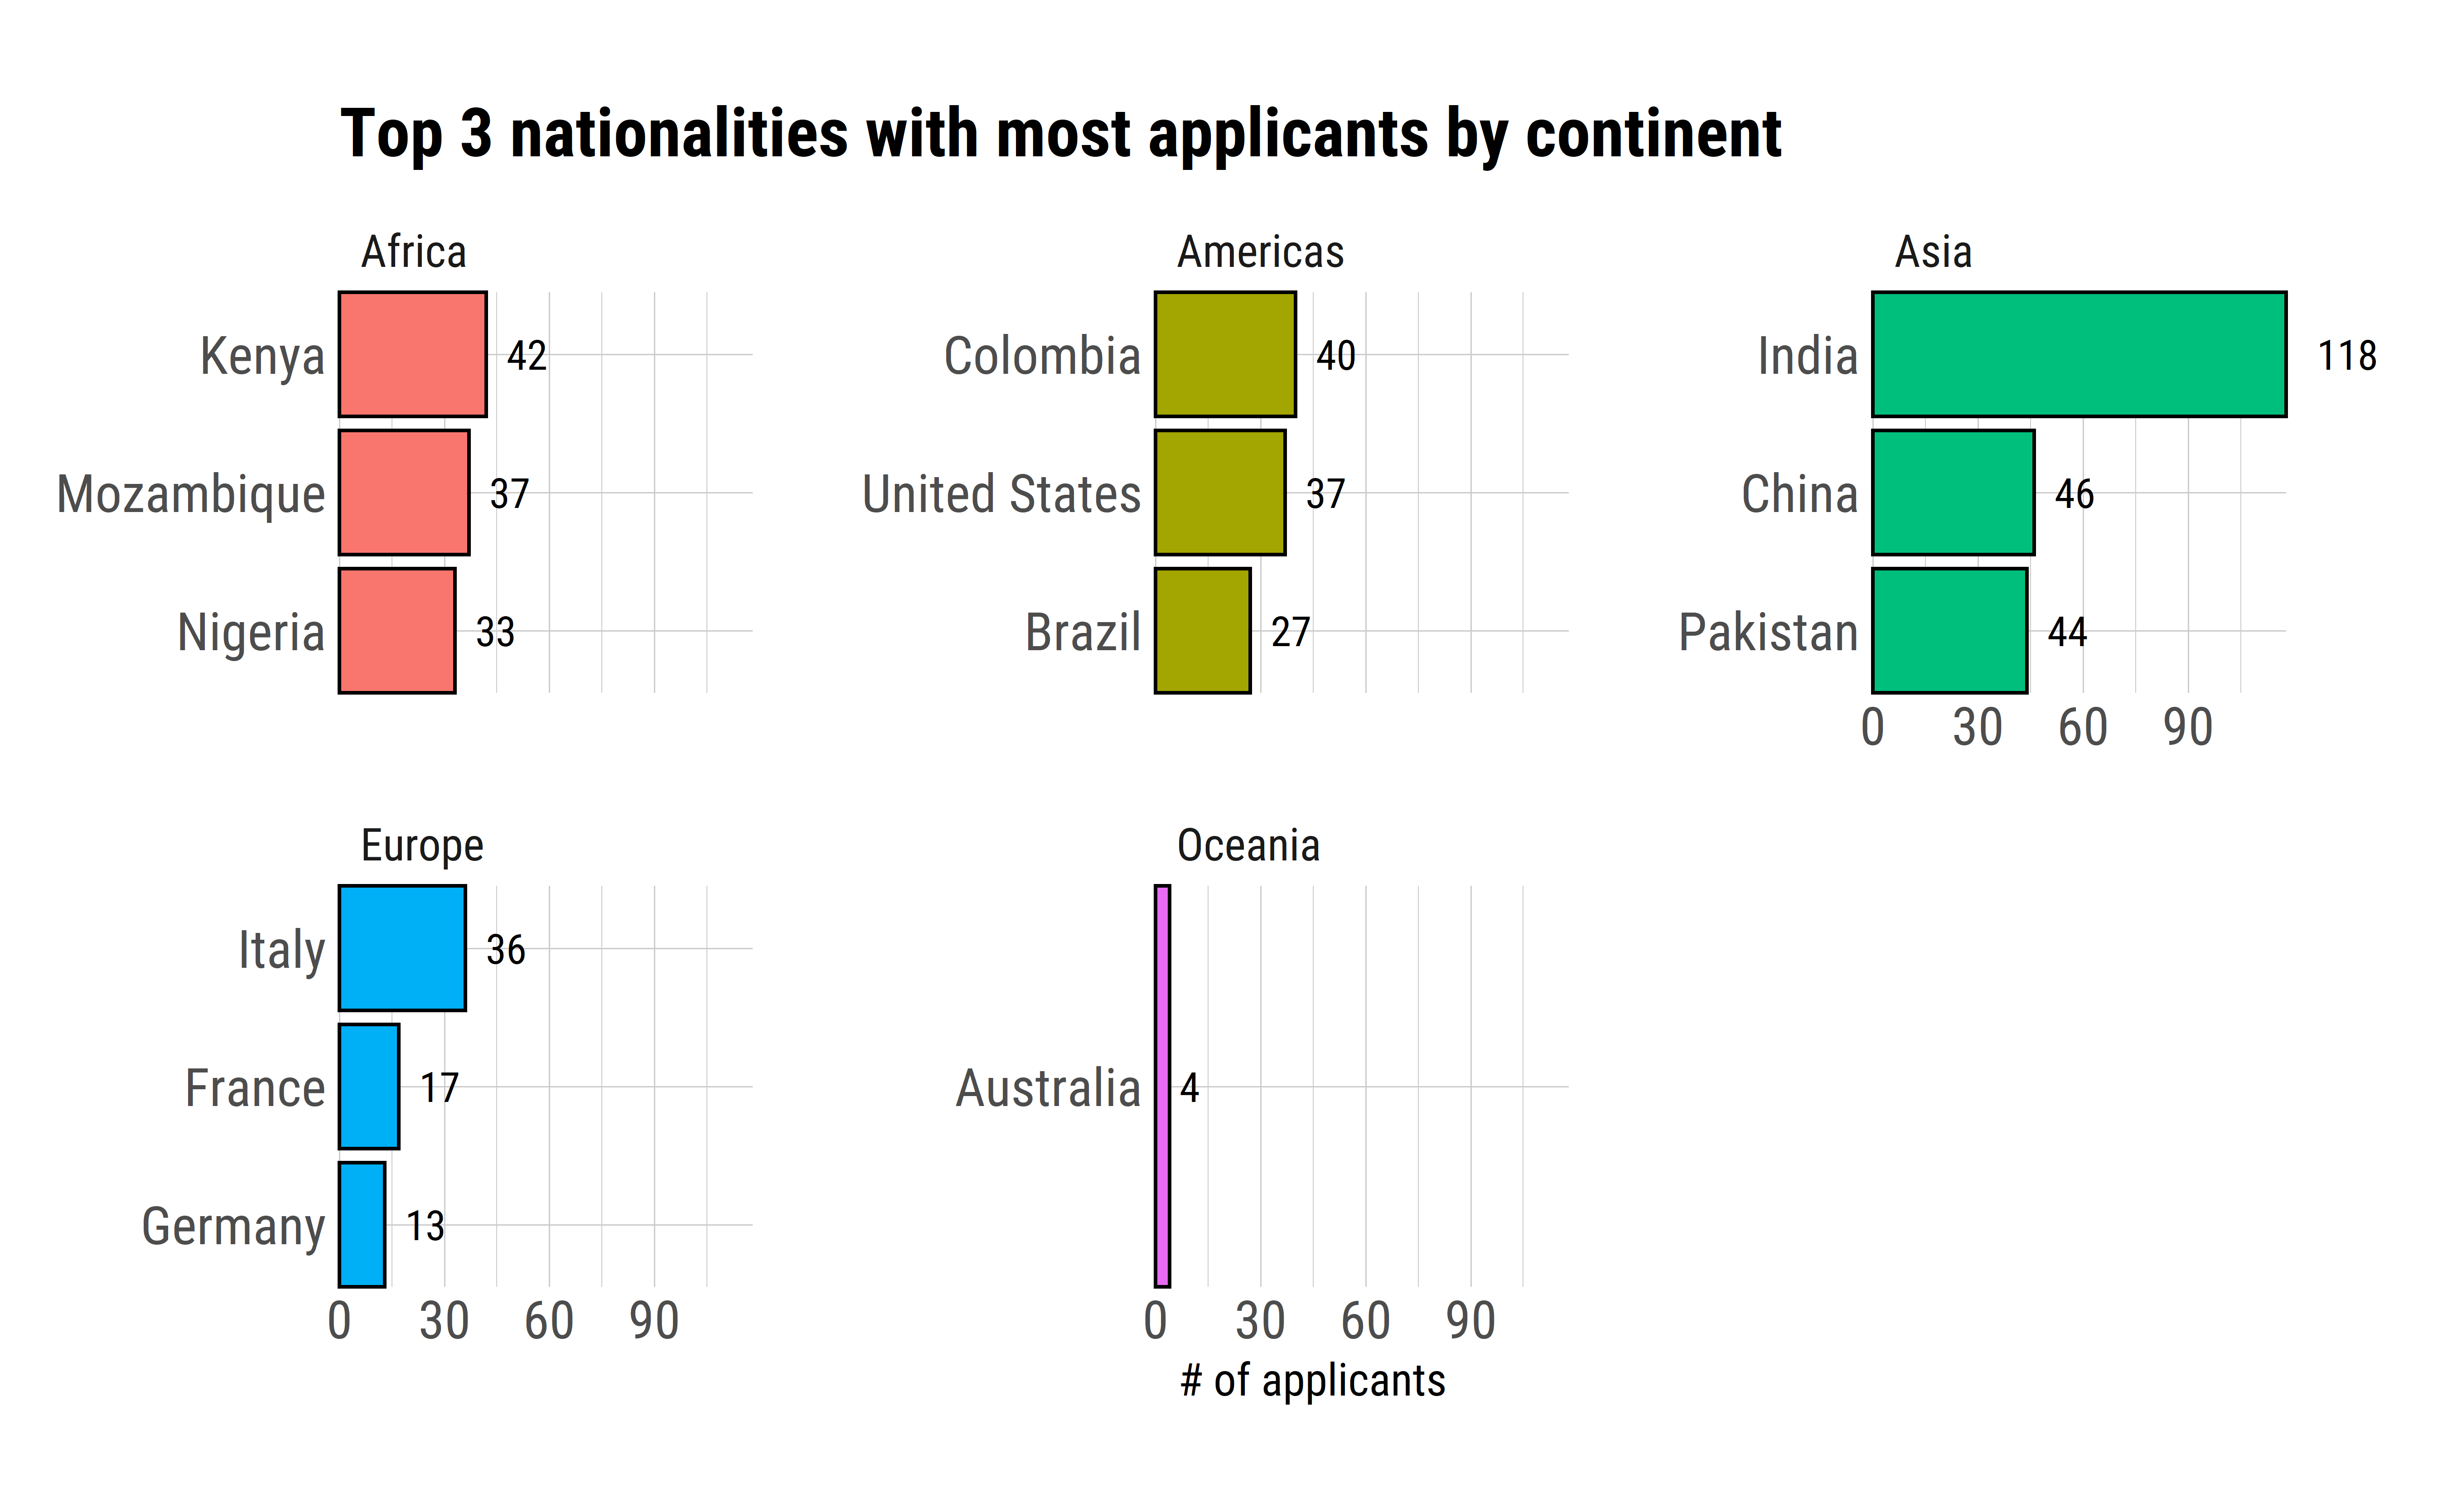
Figure 1.4: Top 3 nationalities with most applicants by continent
Table 1.1 presents the top 20 nationalities of the applicants.
| Country | Frequency | Percent |
|---|---|---|
| India | 118 | 13.3 |
| China | 46 | 5.2 |
| Pakistan | 44 | 5.0 |
| Kenya | 42 | 4.7 |
| Colombia | 40 | 4.5 |
| Mozambique | 37 | 4.2 |
| United States | 37 | 4.2 |
| Italy | 36 | 4.1 |
| Nigeria | 33 | 3.7 |
| Bangladesh | 28 | 3.2 |
| Brazil | 27 | 3.0 |
| Benin | 24 | 2.7 |
| Cameroon | 20 | 2.3 |
| Côte d’Ivoire | 20 | 2.3 |
| Burkina Faso | 19 | 2.1 |
| France | 17 | 1.9 |
| Peru | 16 | 1.8 |
| Chad | 15 | 1.7 |
| Tanzania | 14 | 1.6 |
| Germany | 13 | 1.5 |
1.2.3 Country of origin’s income level
Finally, in terms of country of origin’s income level, most of the applicants come from lower middle income countries (41%). The other income categories are more or less equally distributed.
Highlights:
- 41% of all applications are from people from lower middle income countries.
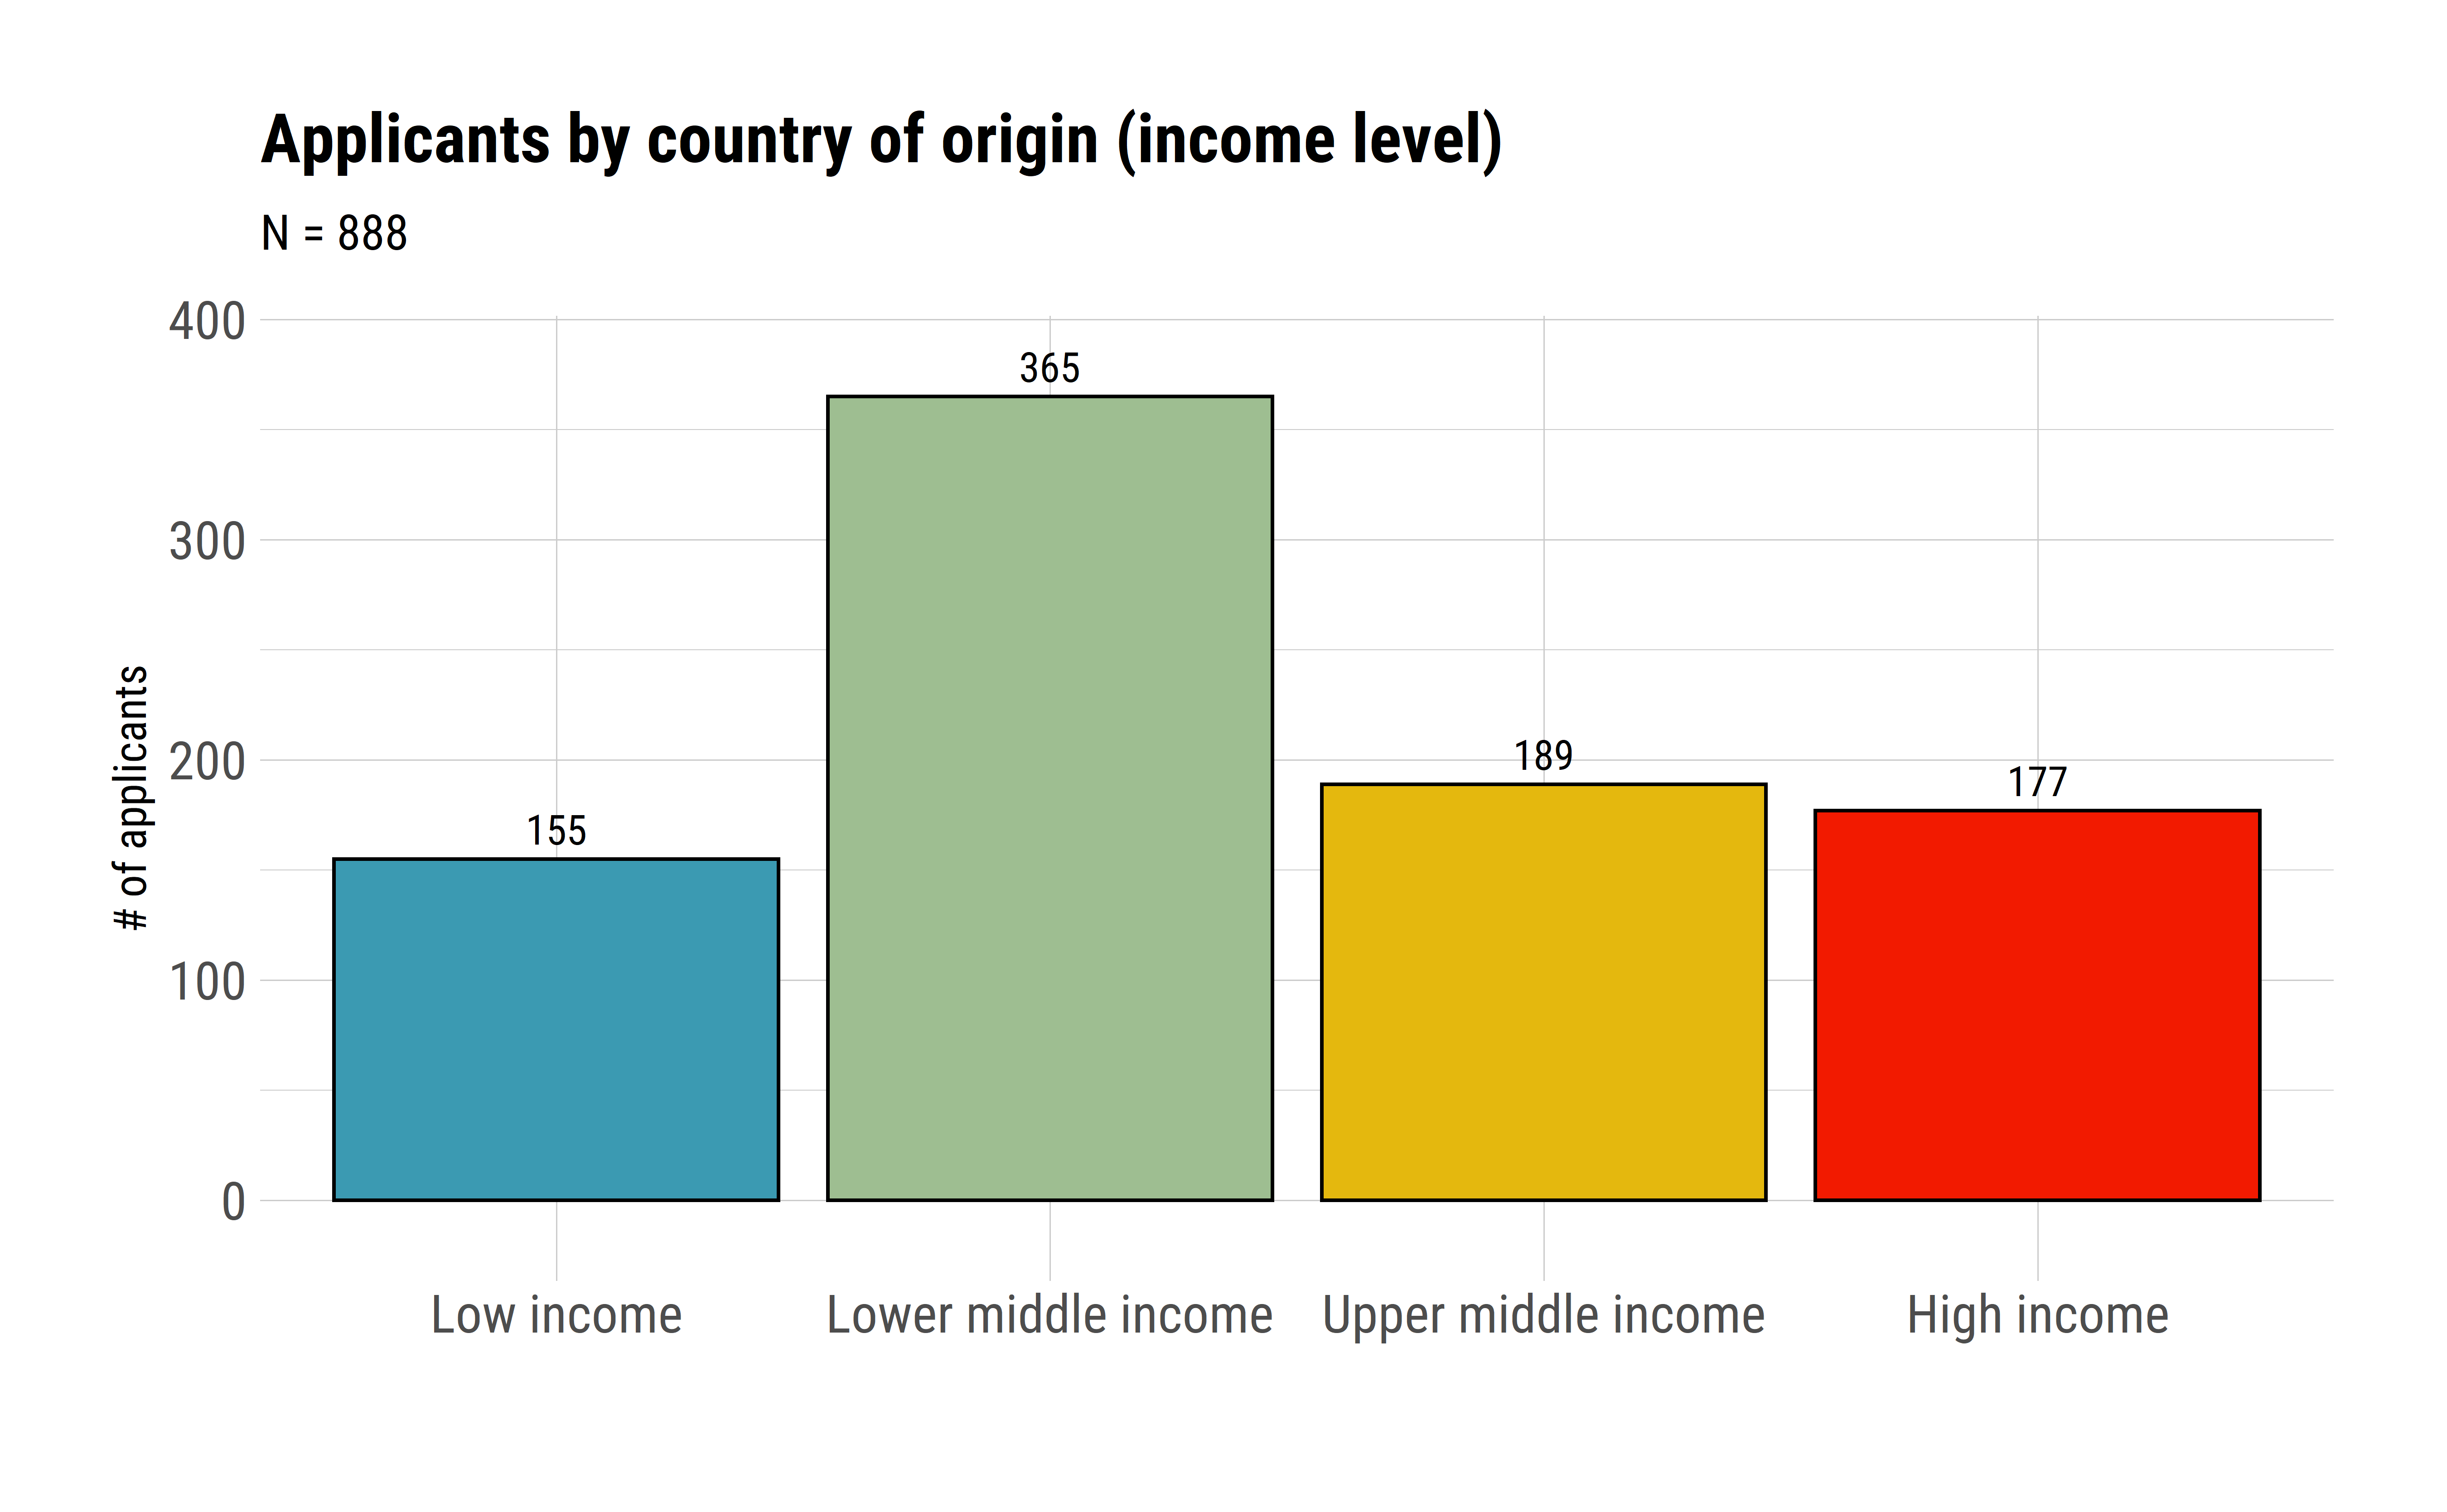
Figure 1.5: Country of origin’s income level
1.3 Students or not?
While most of the projects required applicants to have at least a master’s degree, we received applicants with bacherlor’s degree and doctoral degree. About 60% of all applicants already were not students. And the education level for most of the applicants is at least a master’s degree. Figures 1.6, 1.7, and 1.8 presents the breakdown by education level.
Highlights:
- Most of applicants are not students (58%).
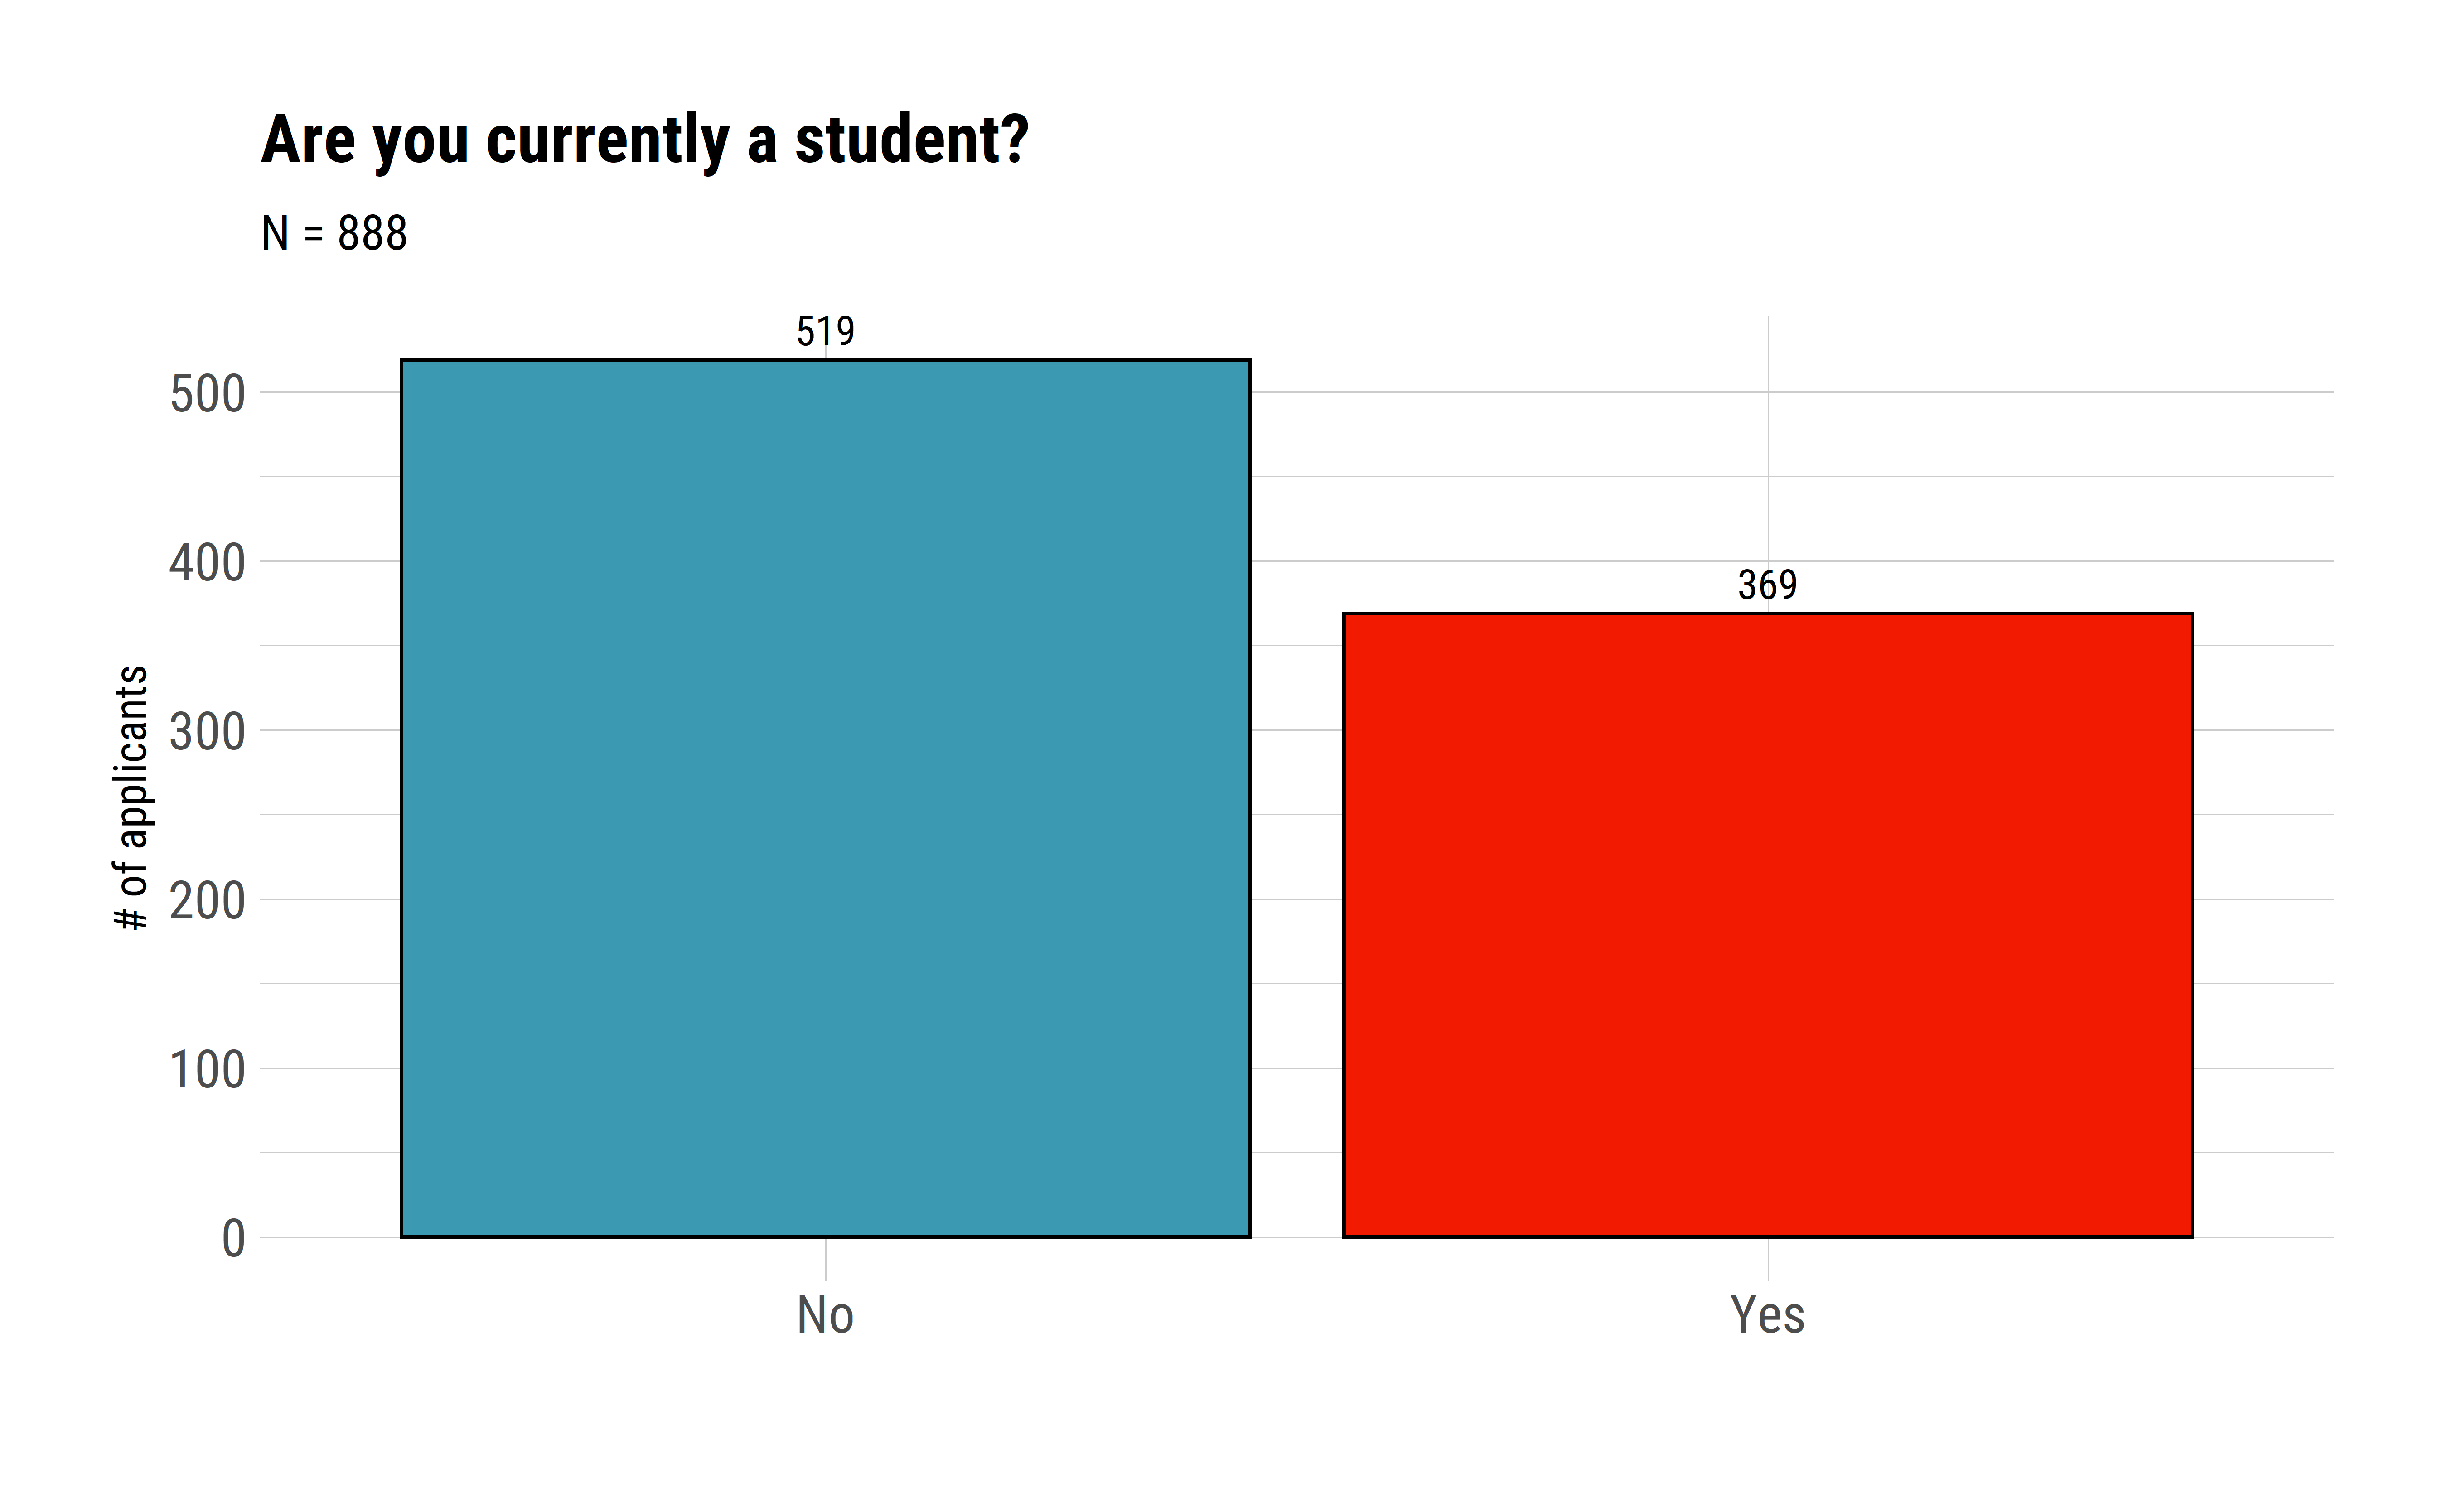
Figure 1.6: Are you a student?
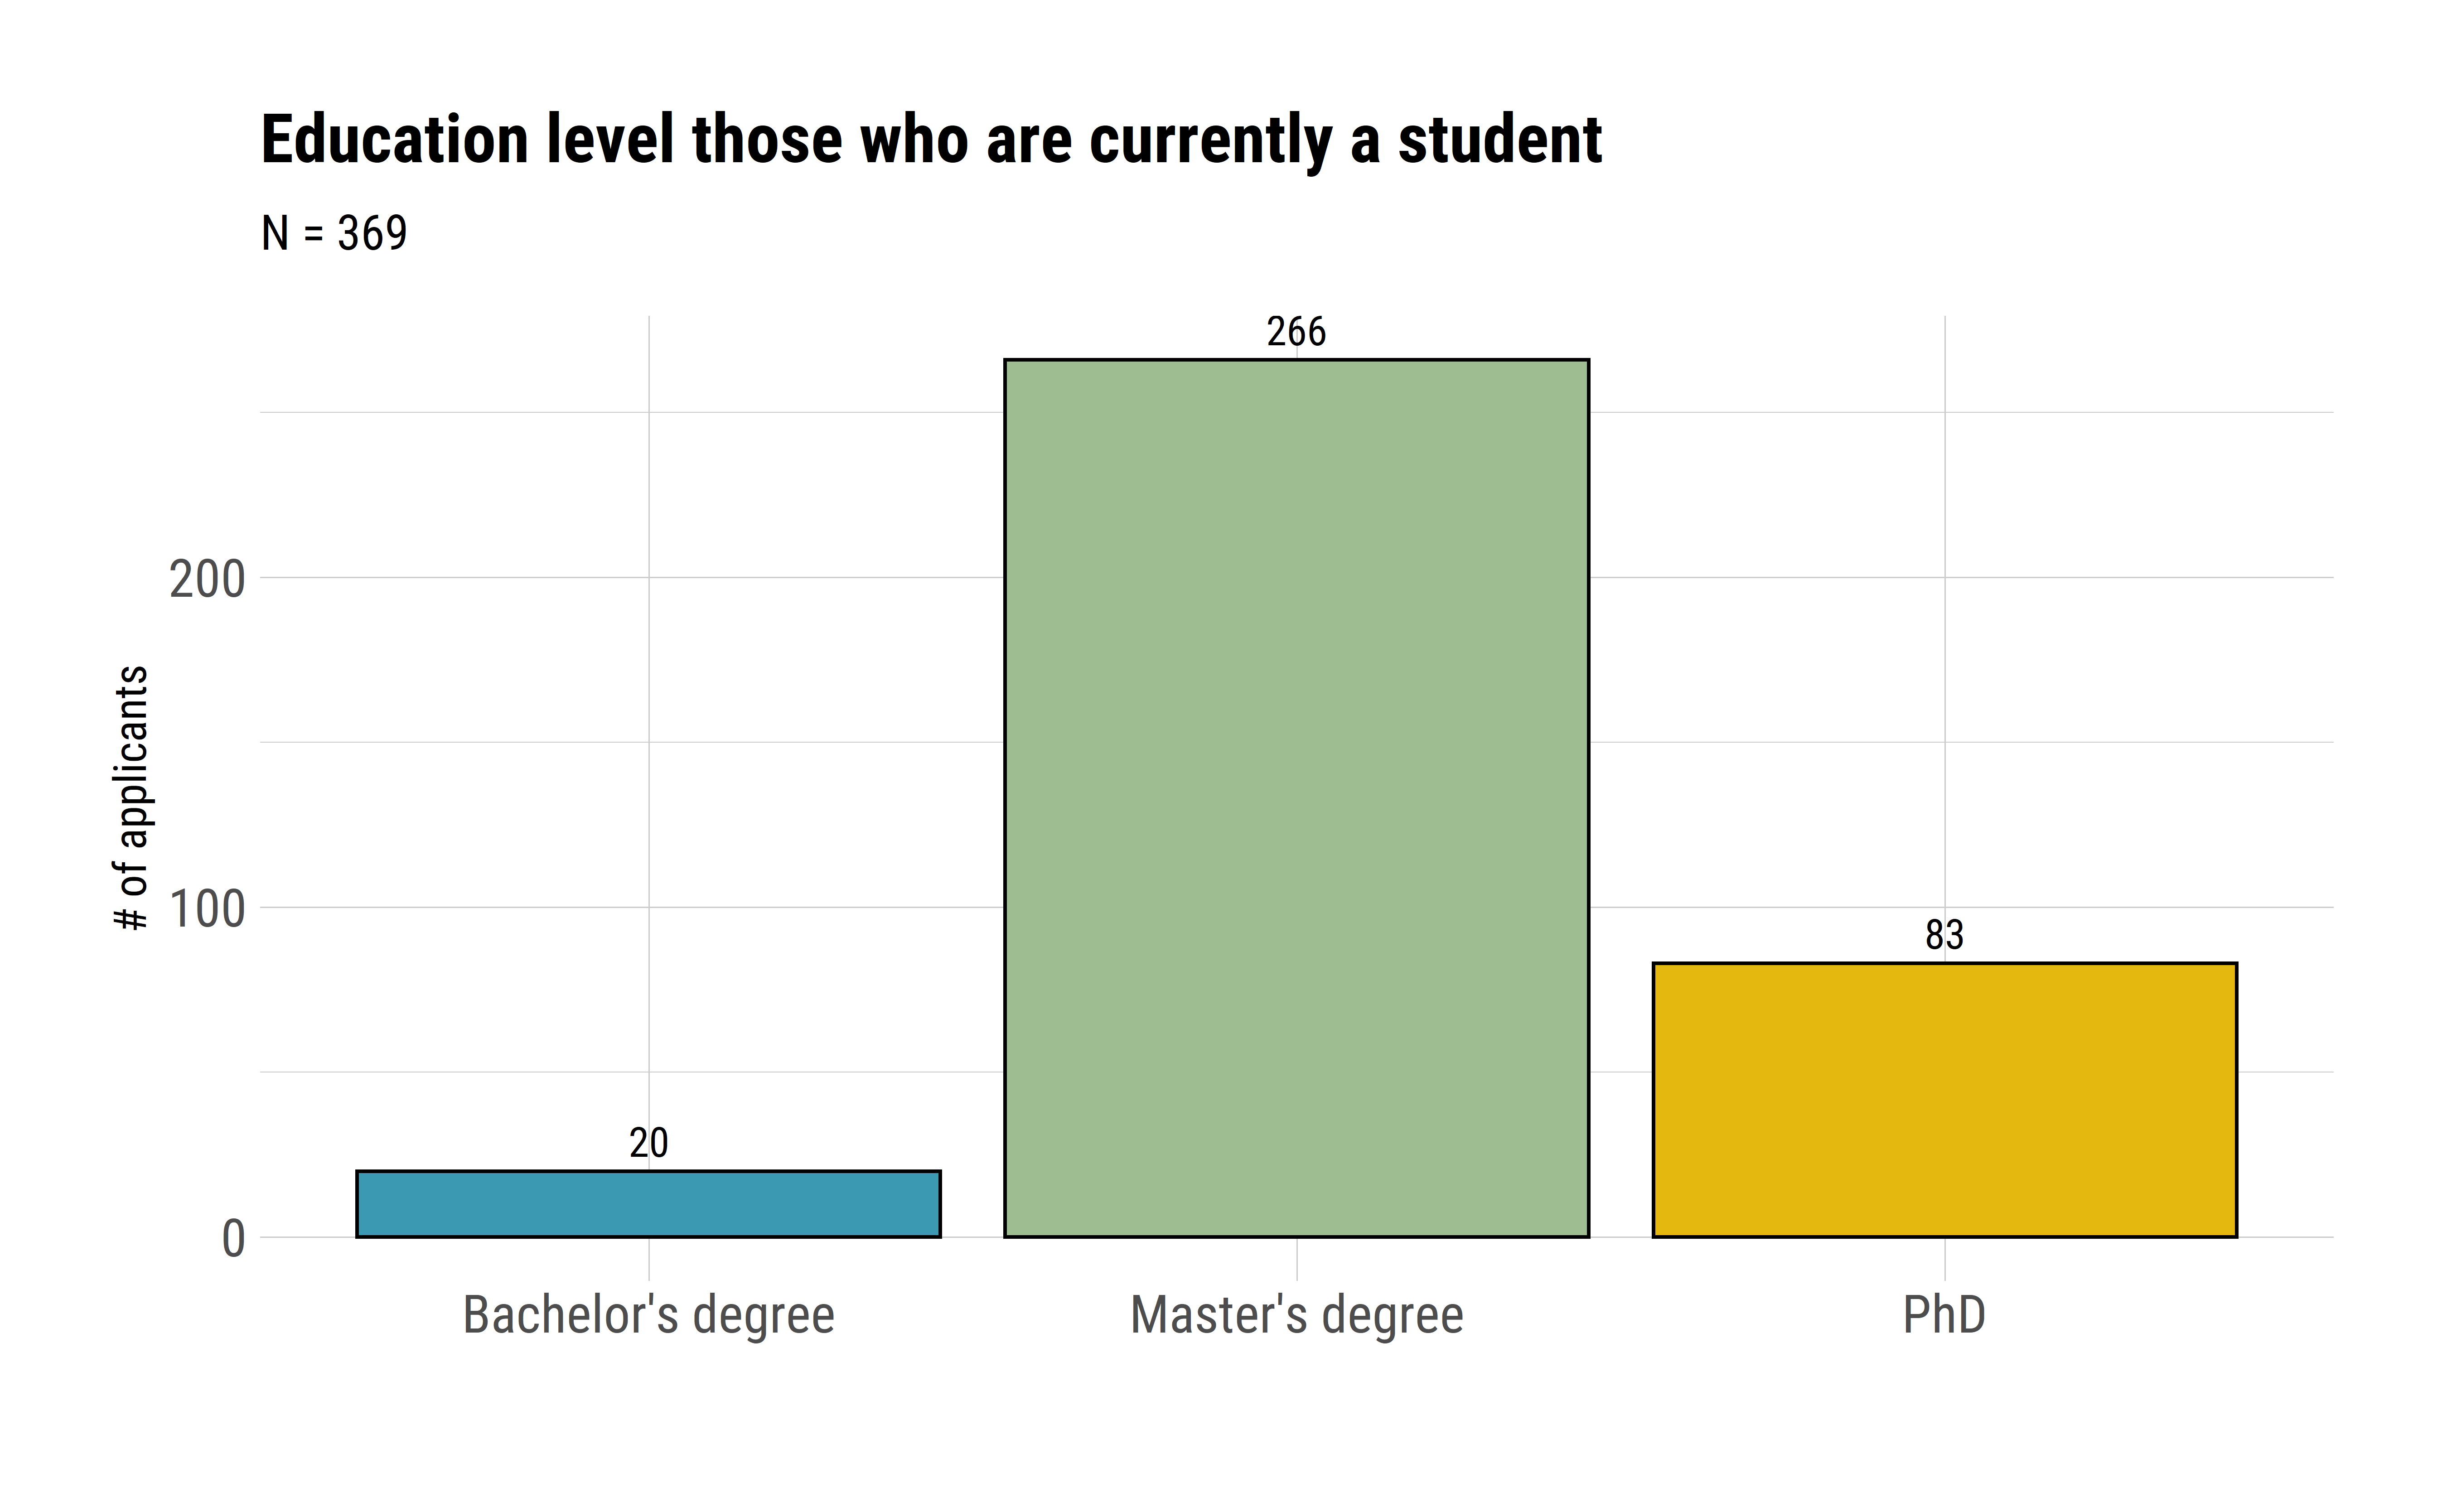
Figure 1.7: Education level of current students
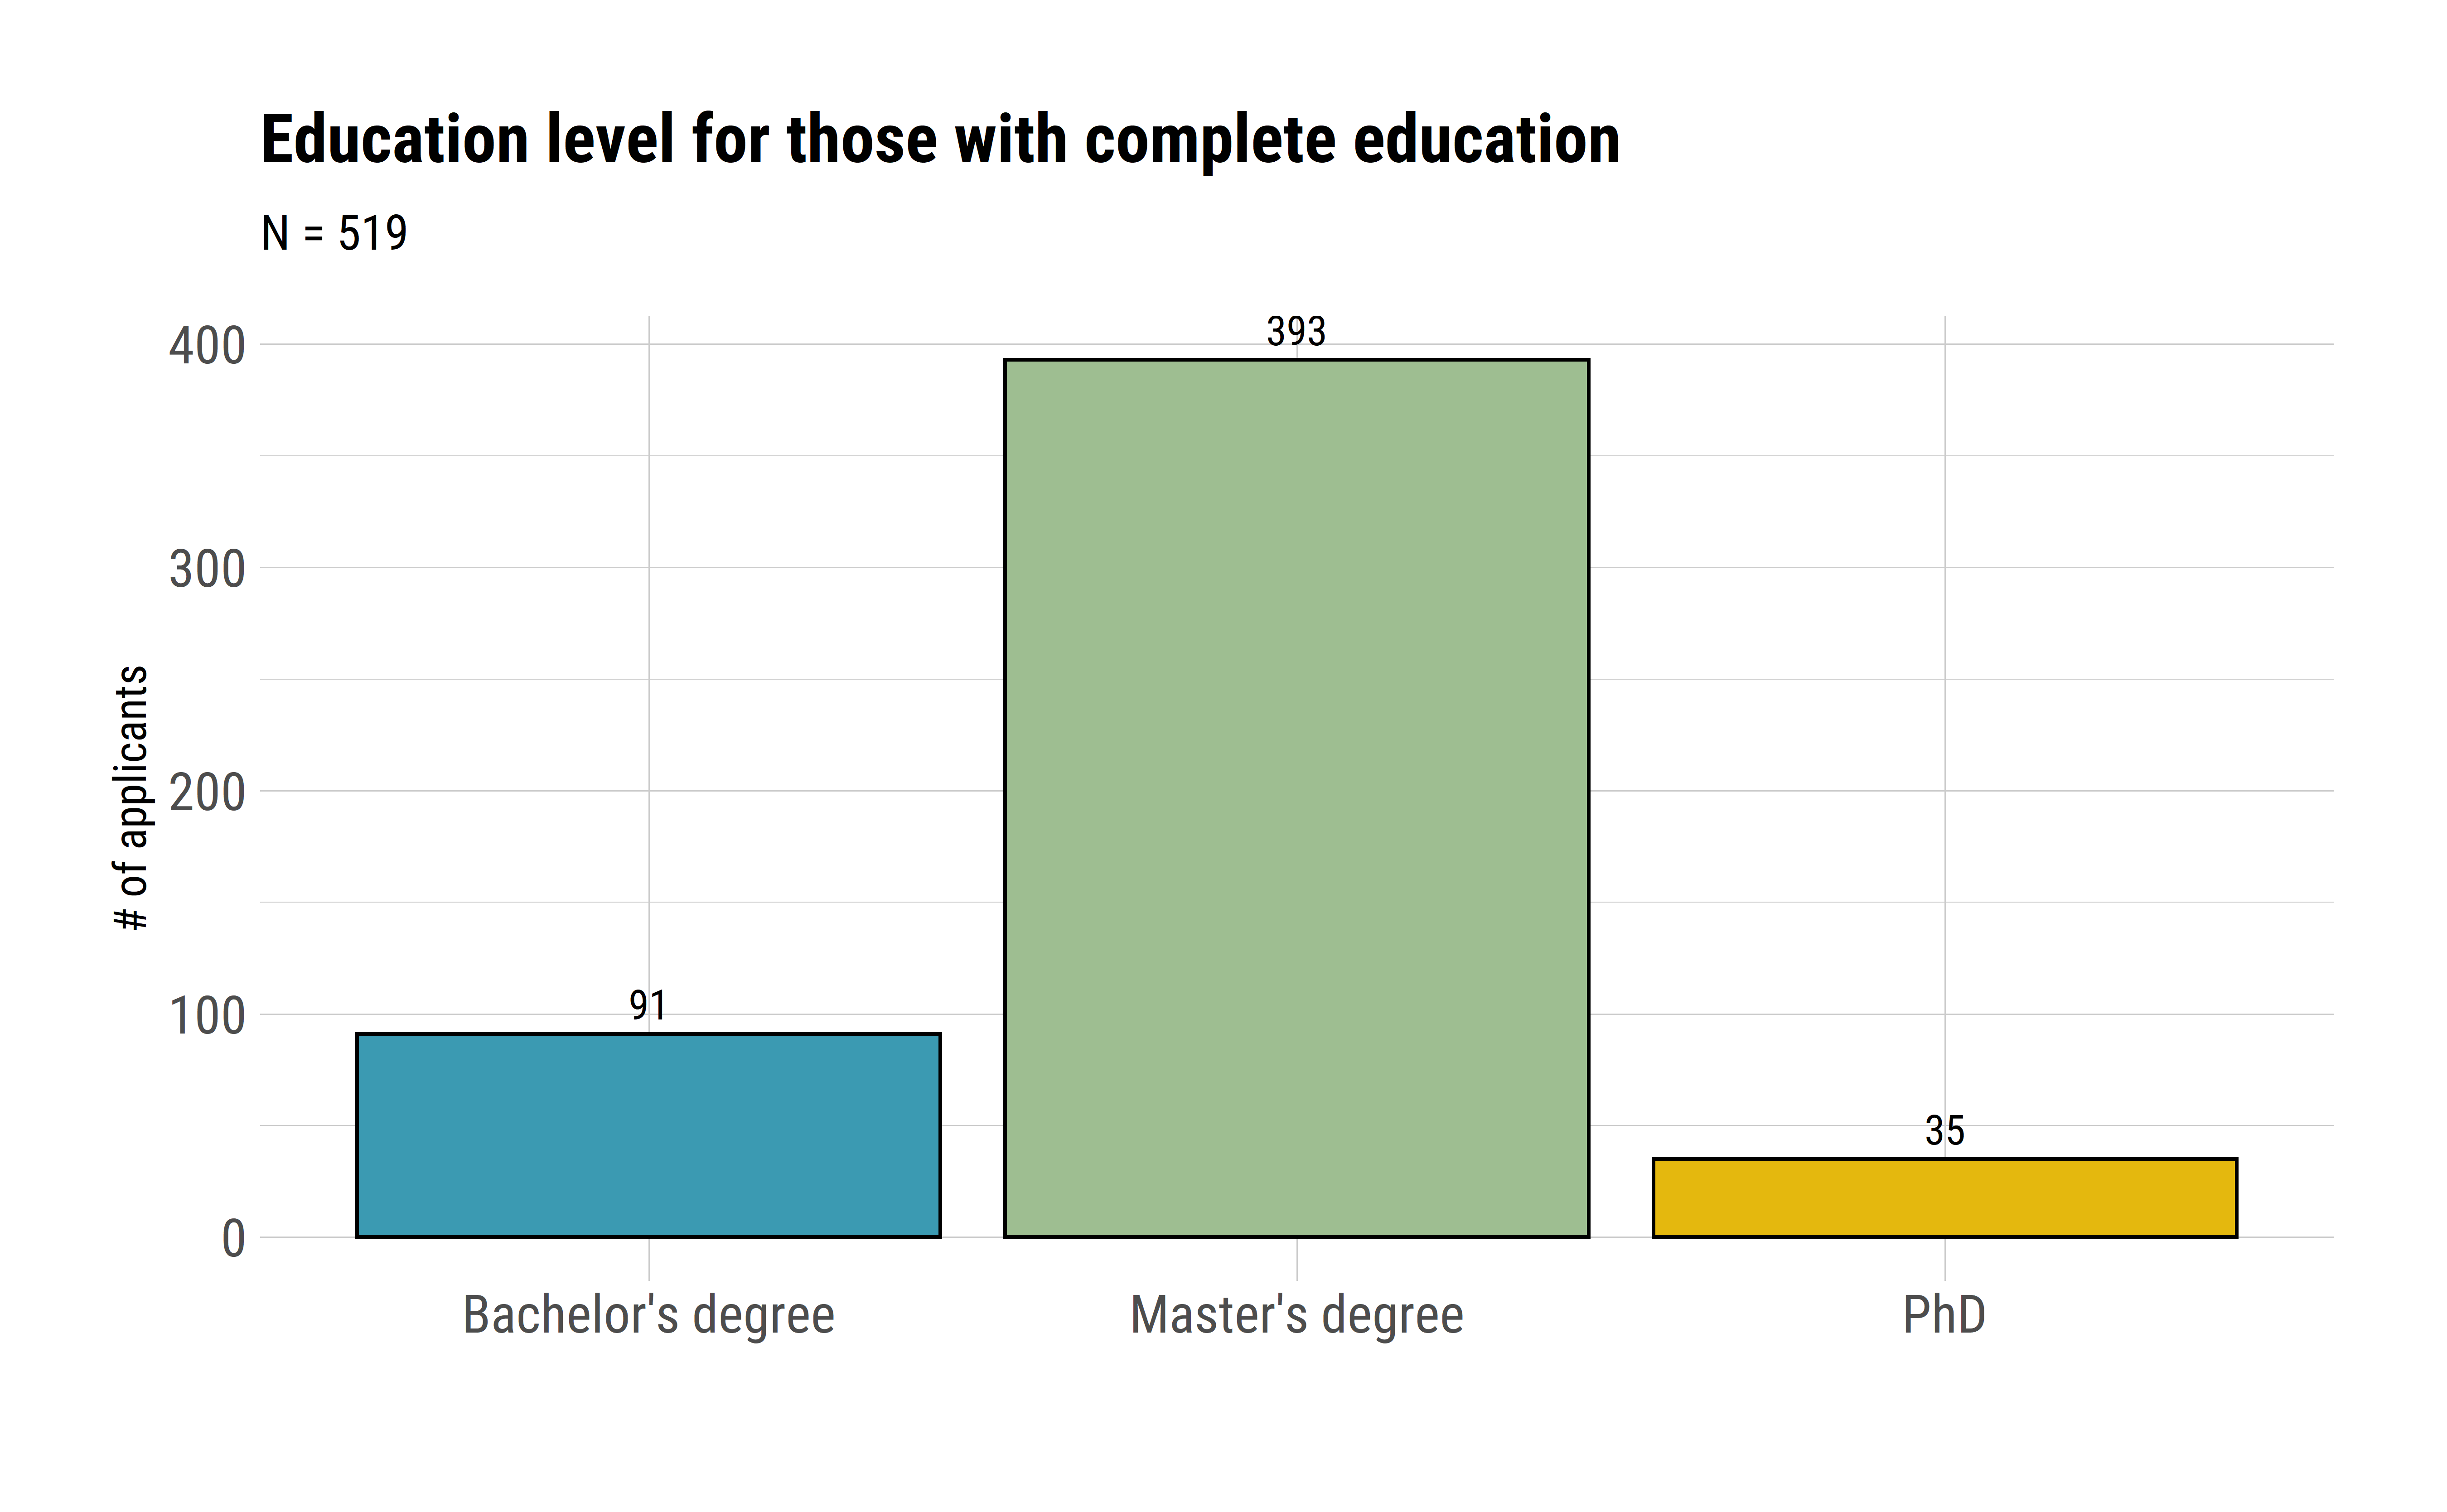
Figure 1.8: Education level of non-students
1.4 Language Proficiency
While all the project required applicants to be fluent in English, 8 out of the 24 projects that were hiring RA and/or FC required French as second language. Figure 1.9 shows the language fluency of all the applicants.
Highlights:
- Top 5 languages spoken by the candidates: (1) English, (2) French, (3) Spanish, (4) Hindi, and (5) Portuguese.
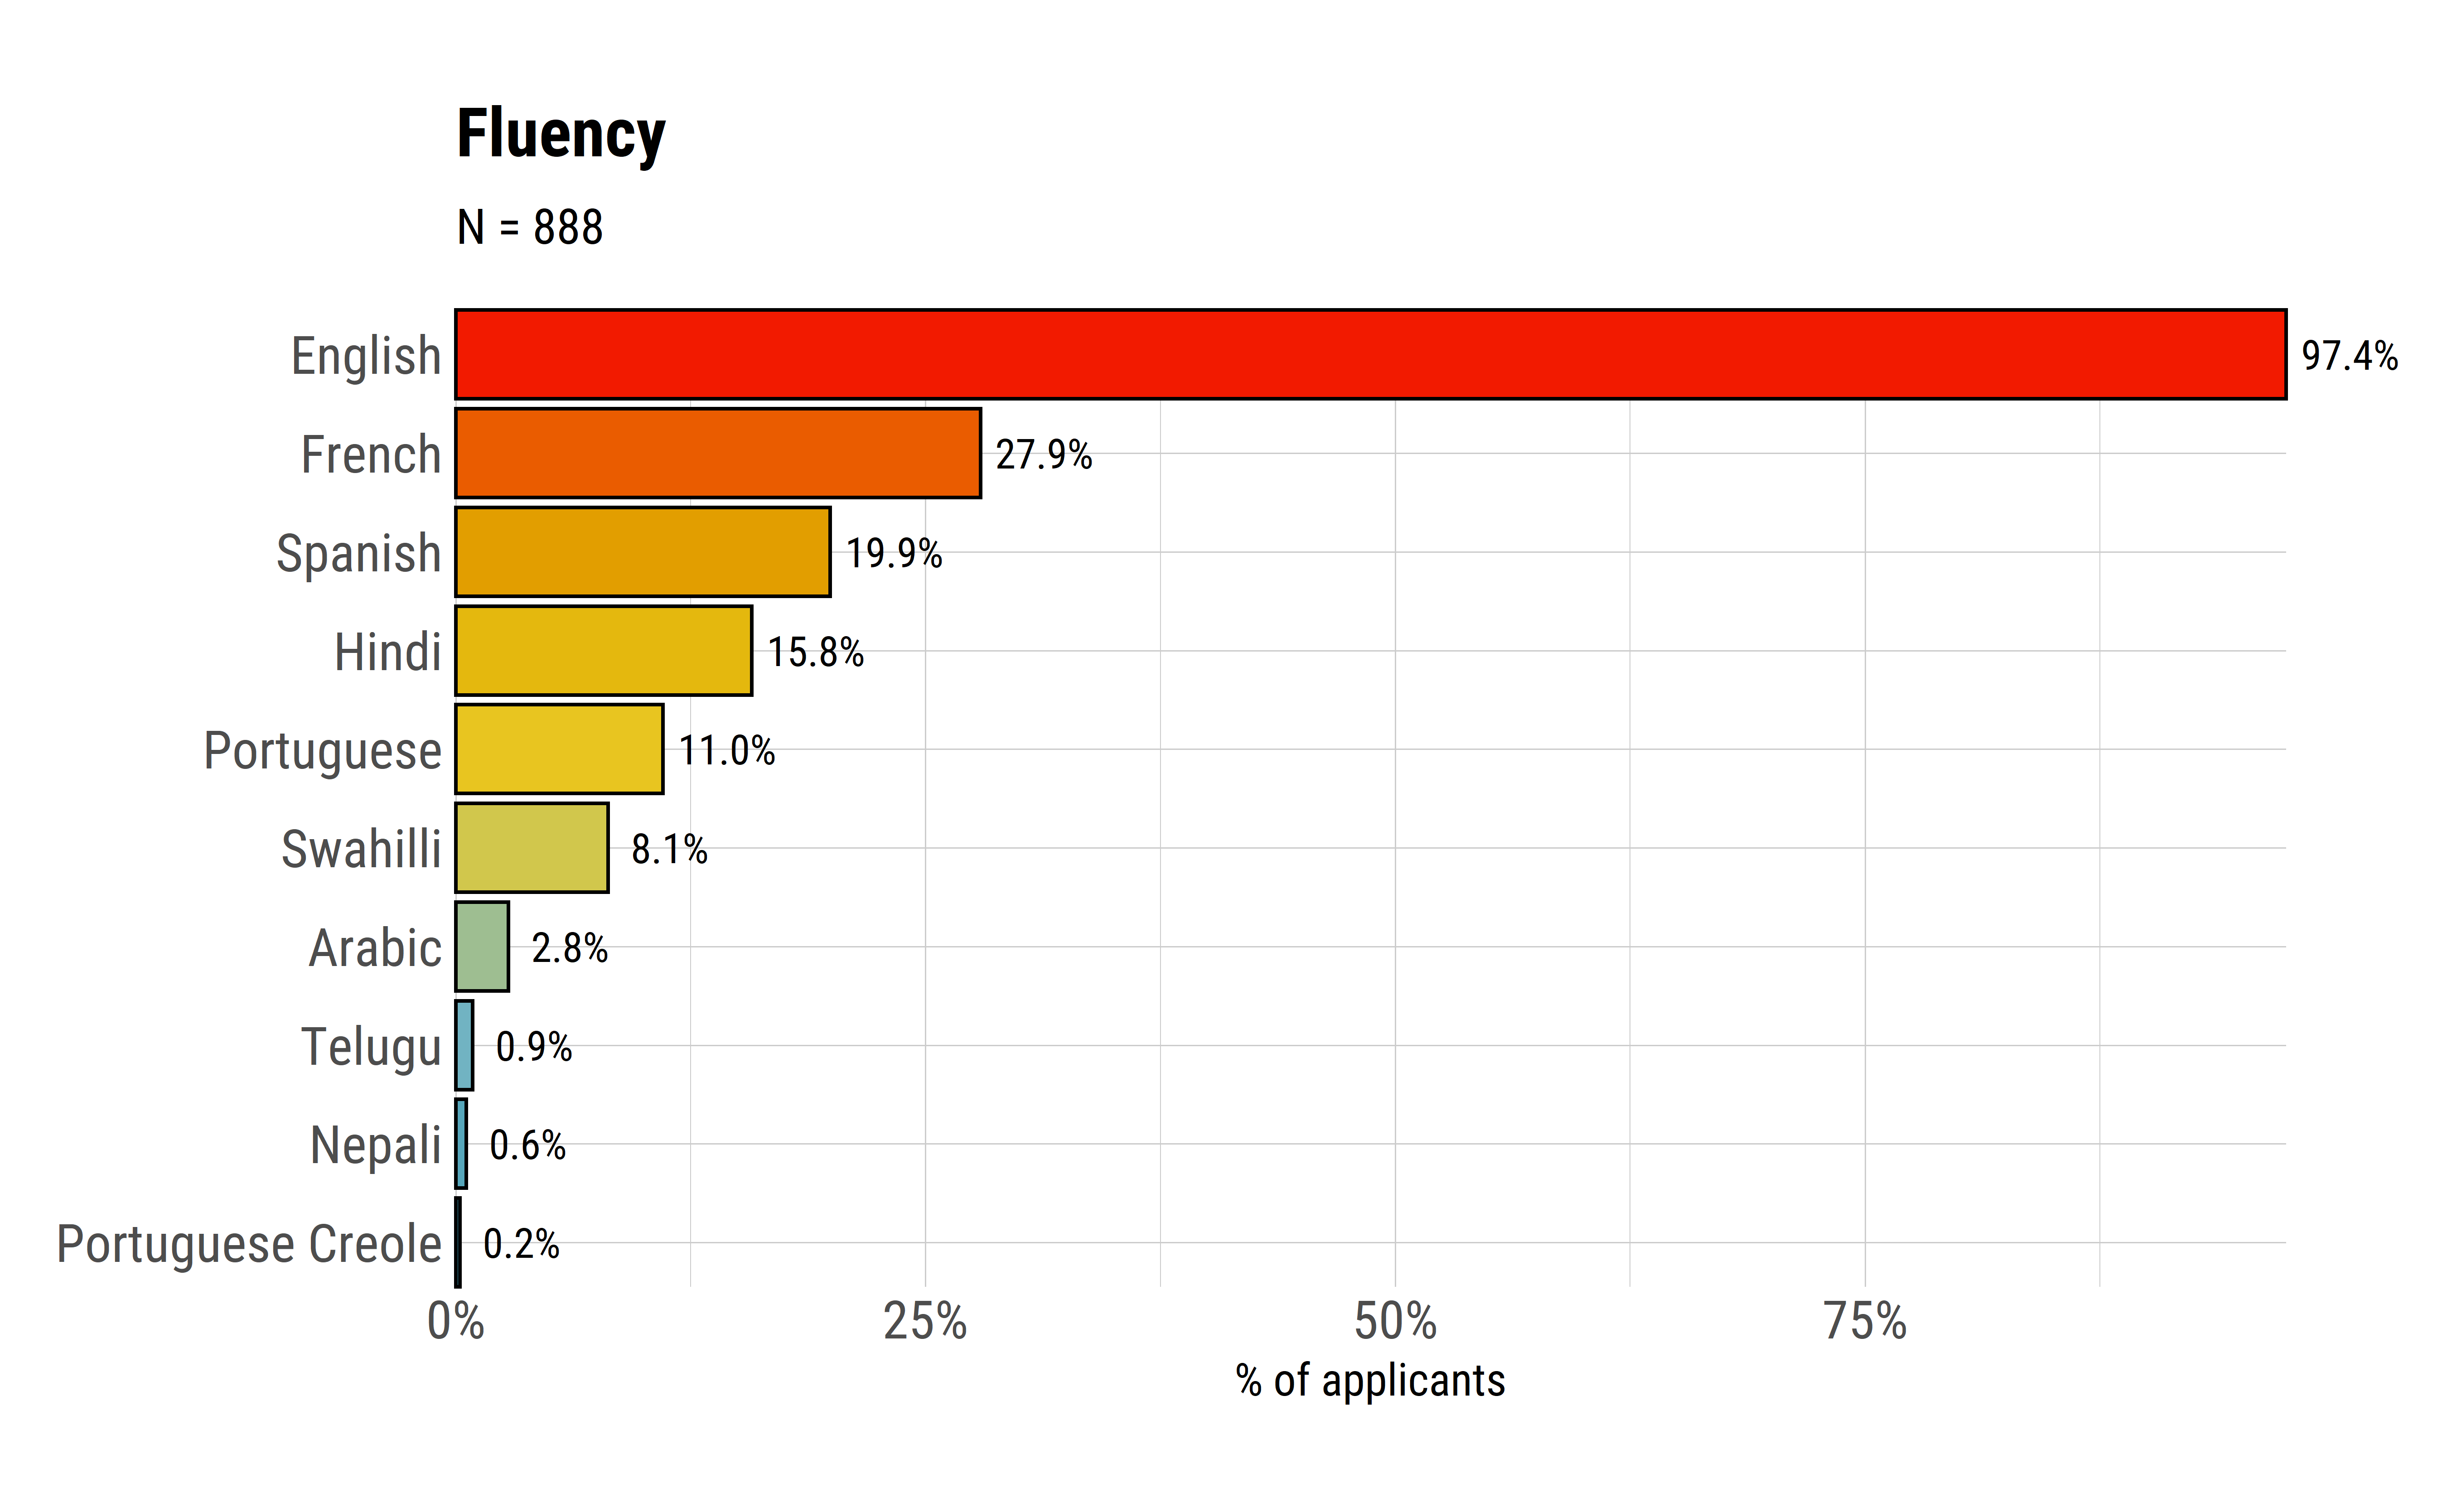
Figure 1.9: Languages