Survival Analysis in R
2022-10-30
Introduction
Survival analyses model time-to-event. They differ from linear regression in two respects. Event times are typically skewed right with many early events and few late ones, violating linear regression’s normality assumption. Survival analyses must also manage censoring, an unknown starting event (left censoring) and/or ending event (right censoring)1. Censoring occurs if the event does not take place by the end of the study window, or the subject is in some way lost to follow-up. In Figure 0.1, subjects 3, 5, 9, and 15 either did not have the event or dropped out of the study. Censored observations do not reveal their total time to event, but they do reveal at least their minimum.
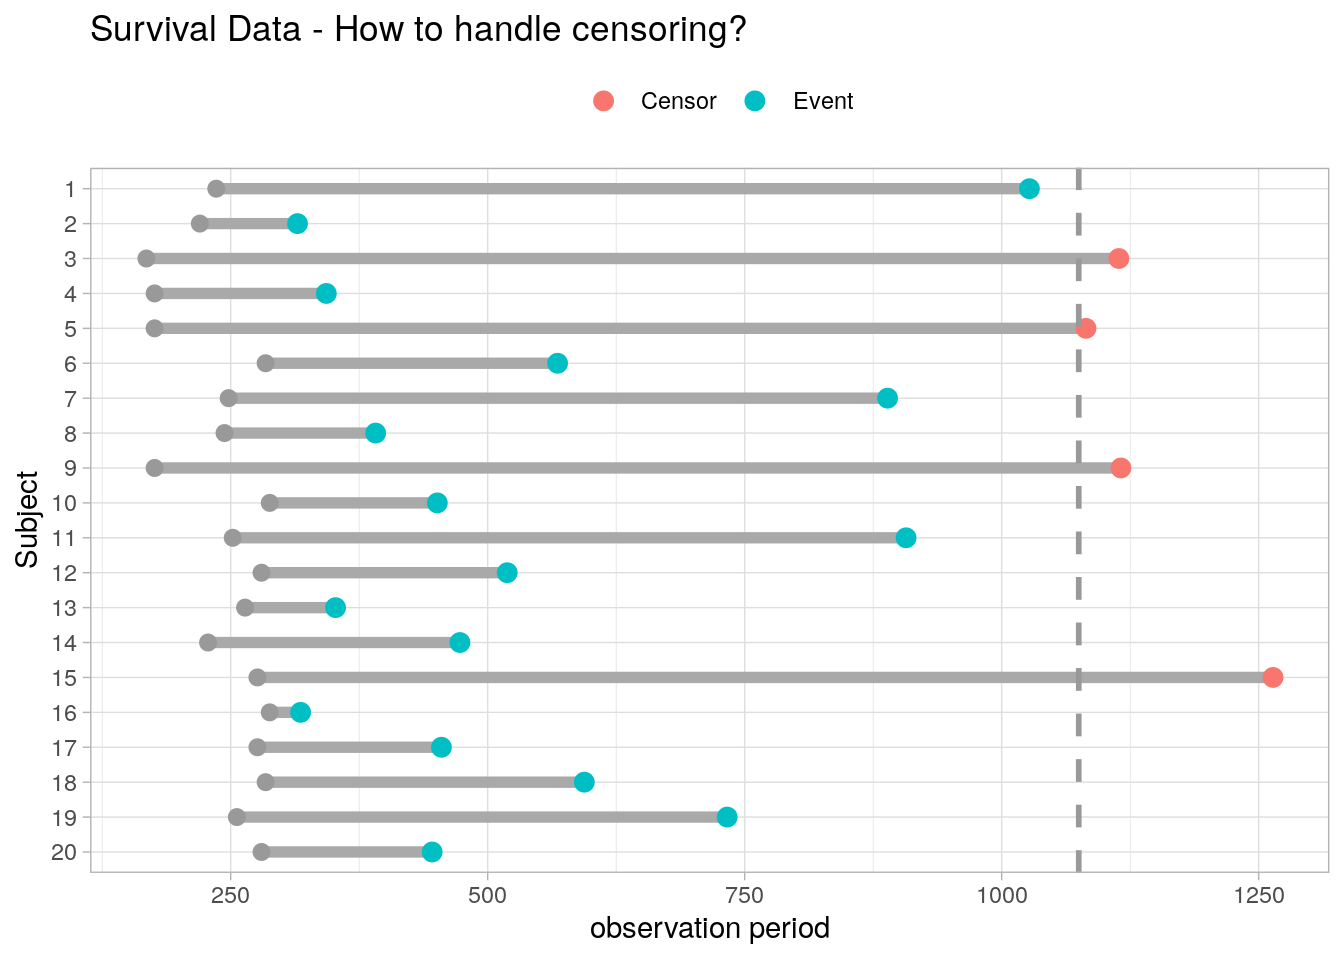
Figure 0.1: Censored observations still contain information. Excluding or ignoring this information can lead to biased and inefficient predictions.
Some analyses treat time-to-event as a continuous outcome with survival times following a parametric distribution such as the Weibull (Chapter 3). A more common approach is the semi-parametric model, with an unspecified time-to-event distribution estimated by non-parameteric methods coupled with covariate effects following a parametric distribution. The Cox proportional hazards model is a semi-parametric model (Chapter 4). A third approach treats time-to-event as a series of person-periods with binary outcomes that follow a logit or cumulative log-log distribution. These models are called discrete-time models (Chapter 5). A fourth approach employs machine learning models such as trees and SVMs to optimize predictive power at some expense of interpretability (Chapter 2).
Any of these approaches can produce accurate and efficient results (Suresh 2022), but the typical survival analysis uses Kaplan-Meier plots to visualize survival curves (Chapter 2), log-rank tests to compare survival curves among groups, and Cox proportional hazards regression to describe the effect of explanatory variables on survival. In R, use the survival package to model, survminer to visualize, and gtsummary for summarize. The following chapters cover the general concepts underlying survival analysis and the four approaches to estimation.