I have organized these pairs by broader intuitive questions so that when you get a practical question, you can more easily see which broad question it touches on, and more quickly see if a pair exists there. By the end of this tour, our goal is for you to be able to take any starting point and quickly say "Yes we could answer that", or "No, web analytics is not the right tool". When we are working from a starting point to the pair(s) of dimensions and metrics we will need, we first look for the right dimension because there are more dimensions than metrics and the metric is relatively straight forward to pick once we have landed on a dimension.
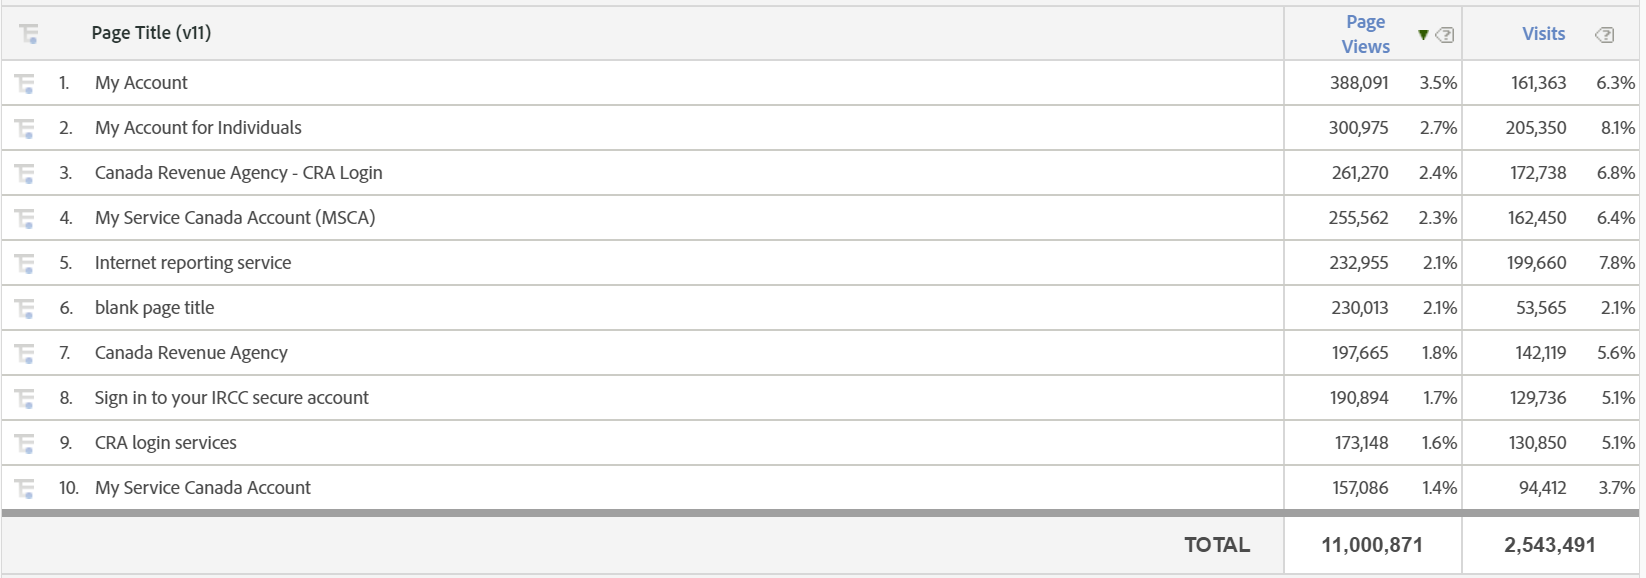
Our introduction to each pair will start with an example of the real world thing that the pair is meant to track. Then we will introduce the dimension and the metric(s) that that dimension works with. The goal of introducing each pair is to give you a good visual of what web data will look like when you combine them. For example, below is how data collected on September 11, 2020 will look when you combine the Page Title dimension with the Page Views metric. This table gives us the basic answer for the basic question, "How many page views happened for each page title on September 11, 2020?"
Each page title has a separate row with the number of page views in a column on the right. Every dimension has a separate row for each of its possible values, and a separate column for each metric that we apply. Each pair introduction will end with a few exercises for you to practice matching dimensions and metrics in Adobe Analytics before moving to the next pair. The exercises are to strengthen your associations between the paired dimensions and metrics, and reinforce where you can find them in the UI. More substantial exercises will follow at the end of the chapter.
How are users interacting with content?
When you want to know what is happening with particular content like a specific page, a pdf, or a video, these dimensions get numbers on that content.We will start with dimensions of actual content, include pages, all links on a page, outbound links, download links, videos, audio files, promotions that run within the site, forms (including the "Report a problem" form), social media share and follow buttons, and pop-ups. Then we will look at "anti-content" - page errors and promotions outside our site that bring traffic to it. Then we will look at way-finding content, include phrases and results for the internal site search, the site header, footer, and menu, expand and collapse buttons, tabs, anchor links, and content filters (include the news filter). Finally, we will cover dimensions about the user experience with that content, specifically tasks identified by users, and other exit survey results.
mini sampling of content, more to discover - maybe reference to reference chart at the back describing them all
Content
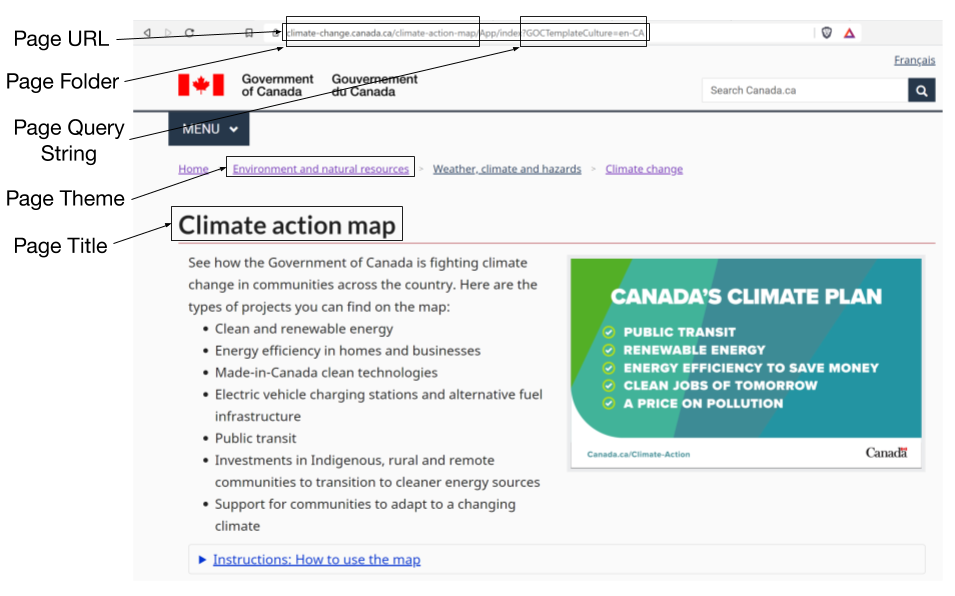
Pages
You can find page data by:
You can also find page data the previous page title, URL, and creator.
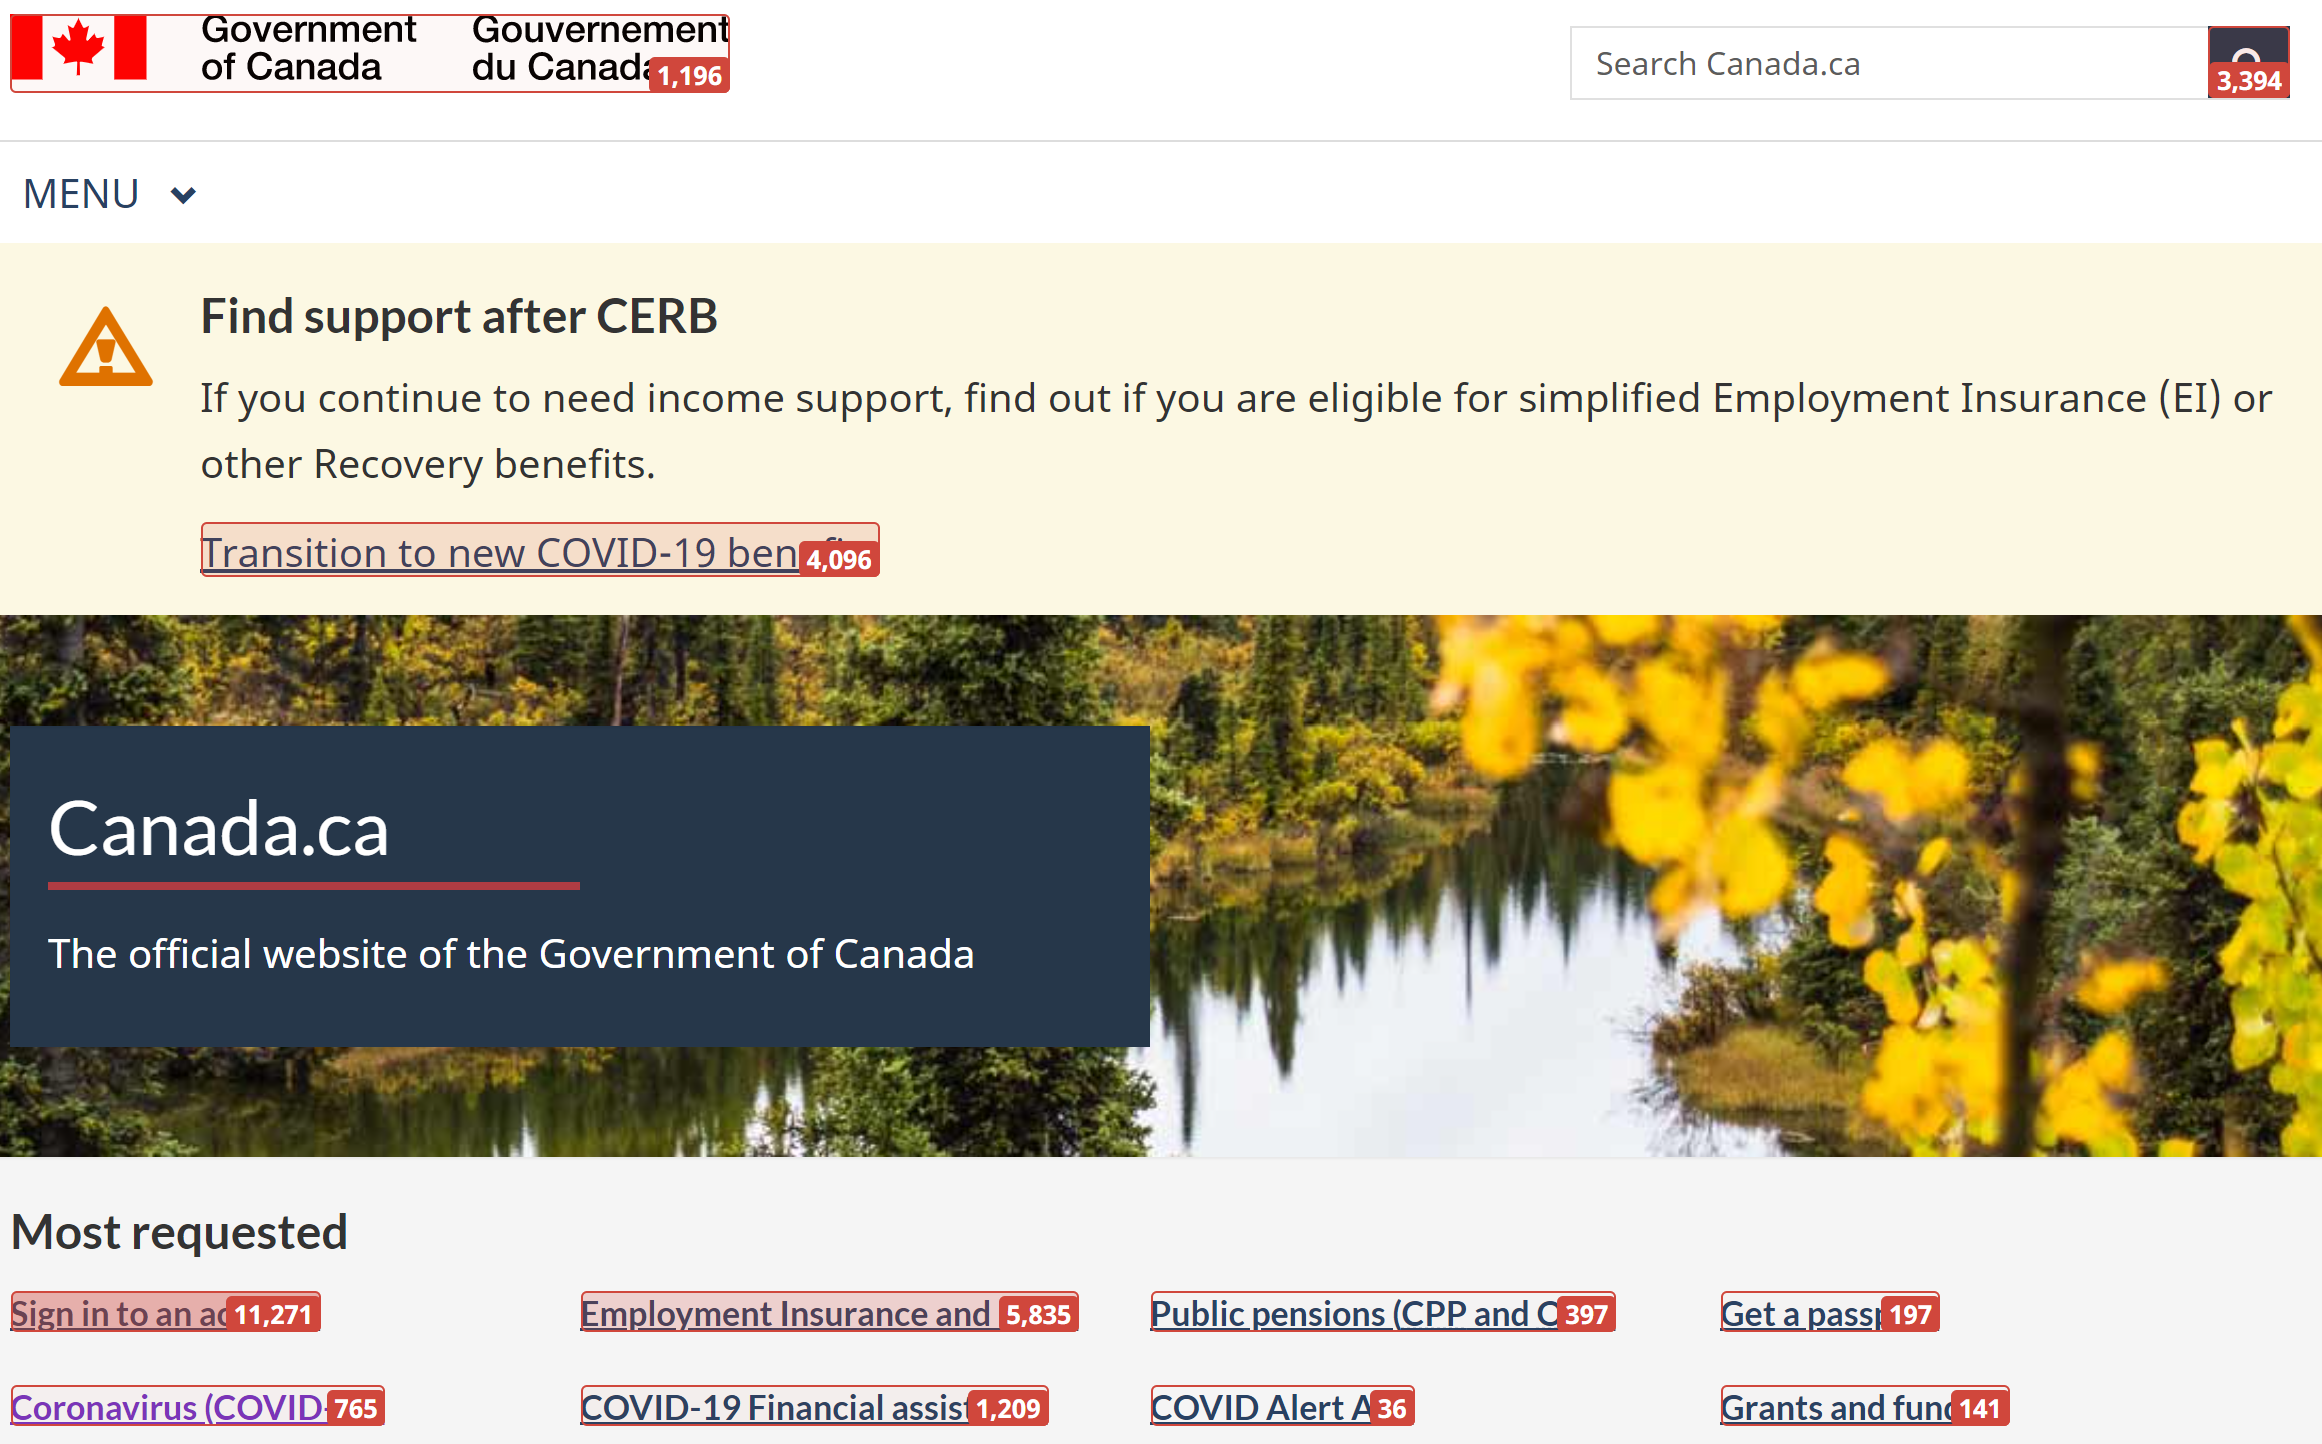
All Links
You can find data by:
- Activity Map Link: The number of clicks to each link on a page, regardless of the type of link.
- Each link text has its own row so two links on the same page with the same text will be counted as one.
- There is a browser plugin that overlays pages with the clicks to each link.
- Each page is given a name that is stored in the Activity Map Page
- The metric is instances.
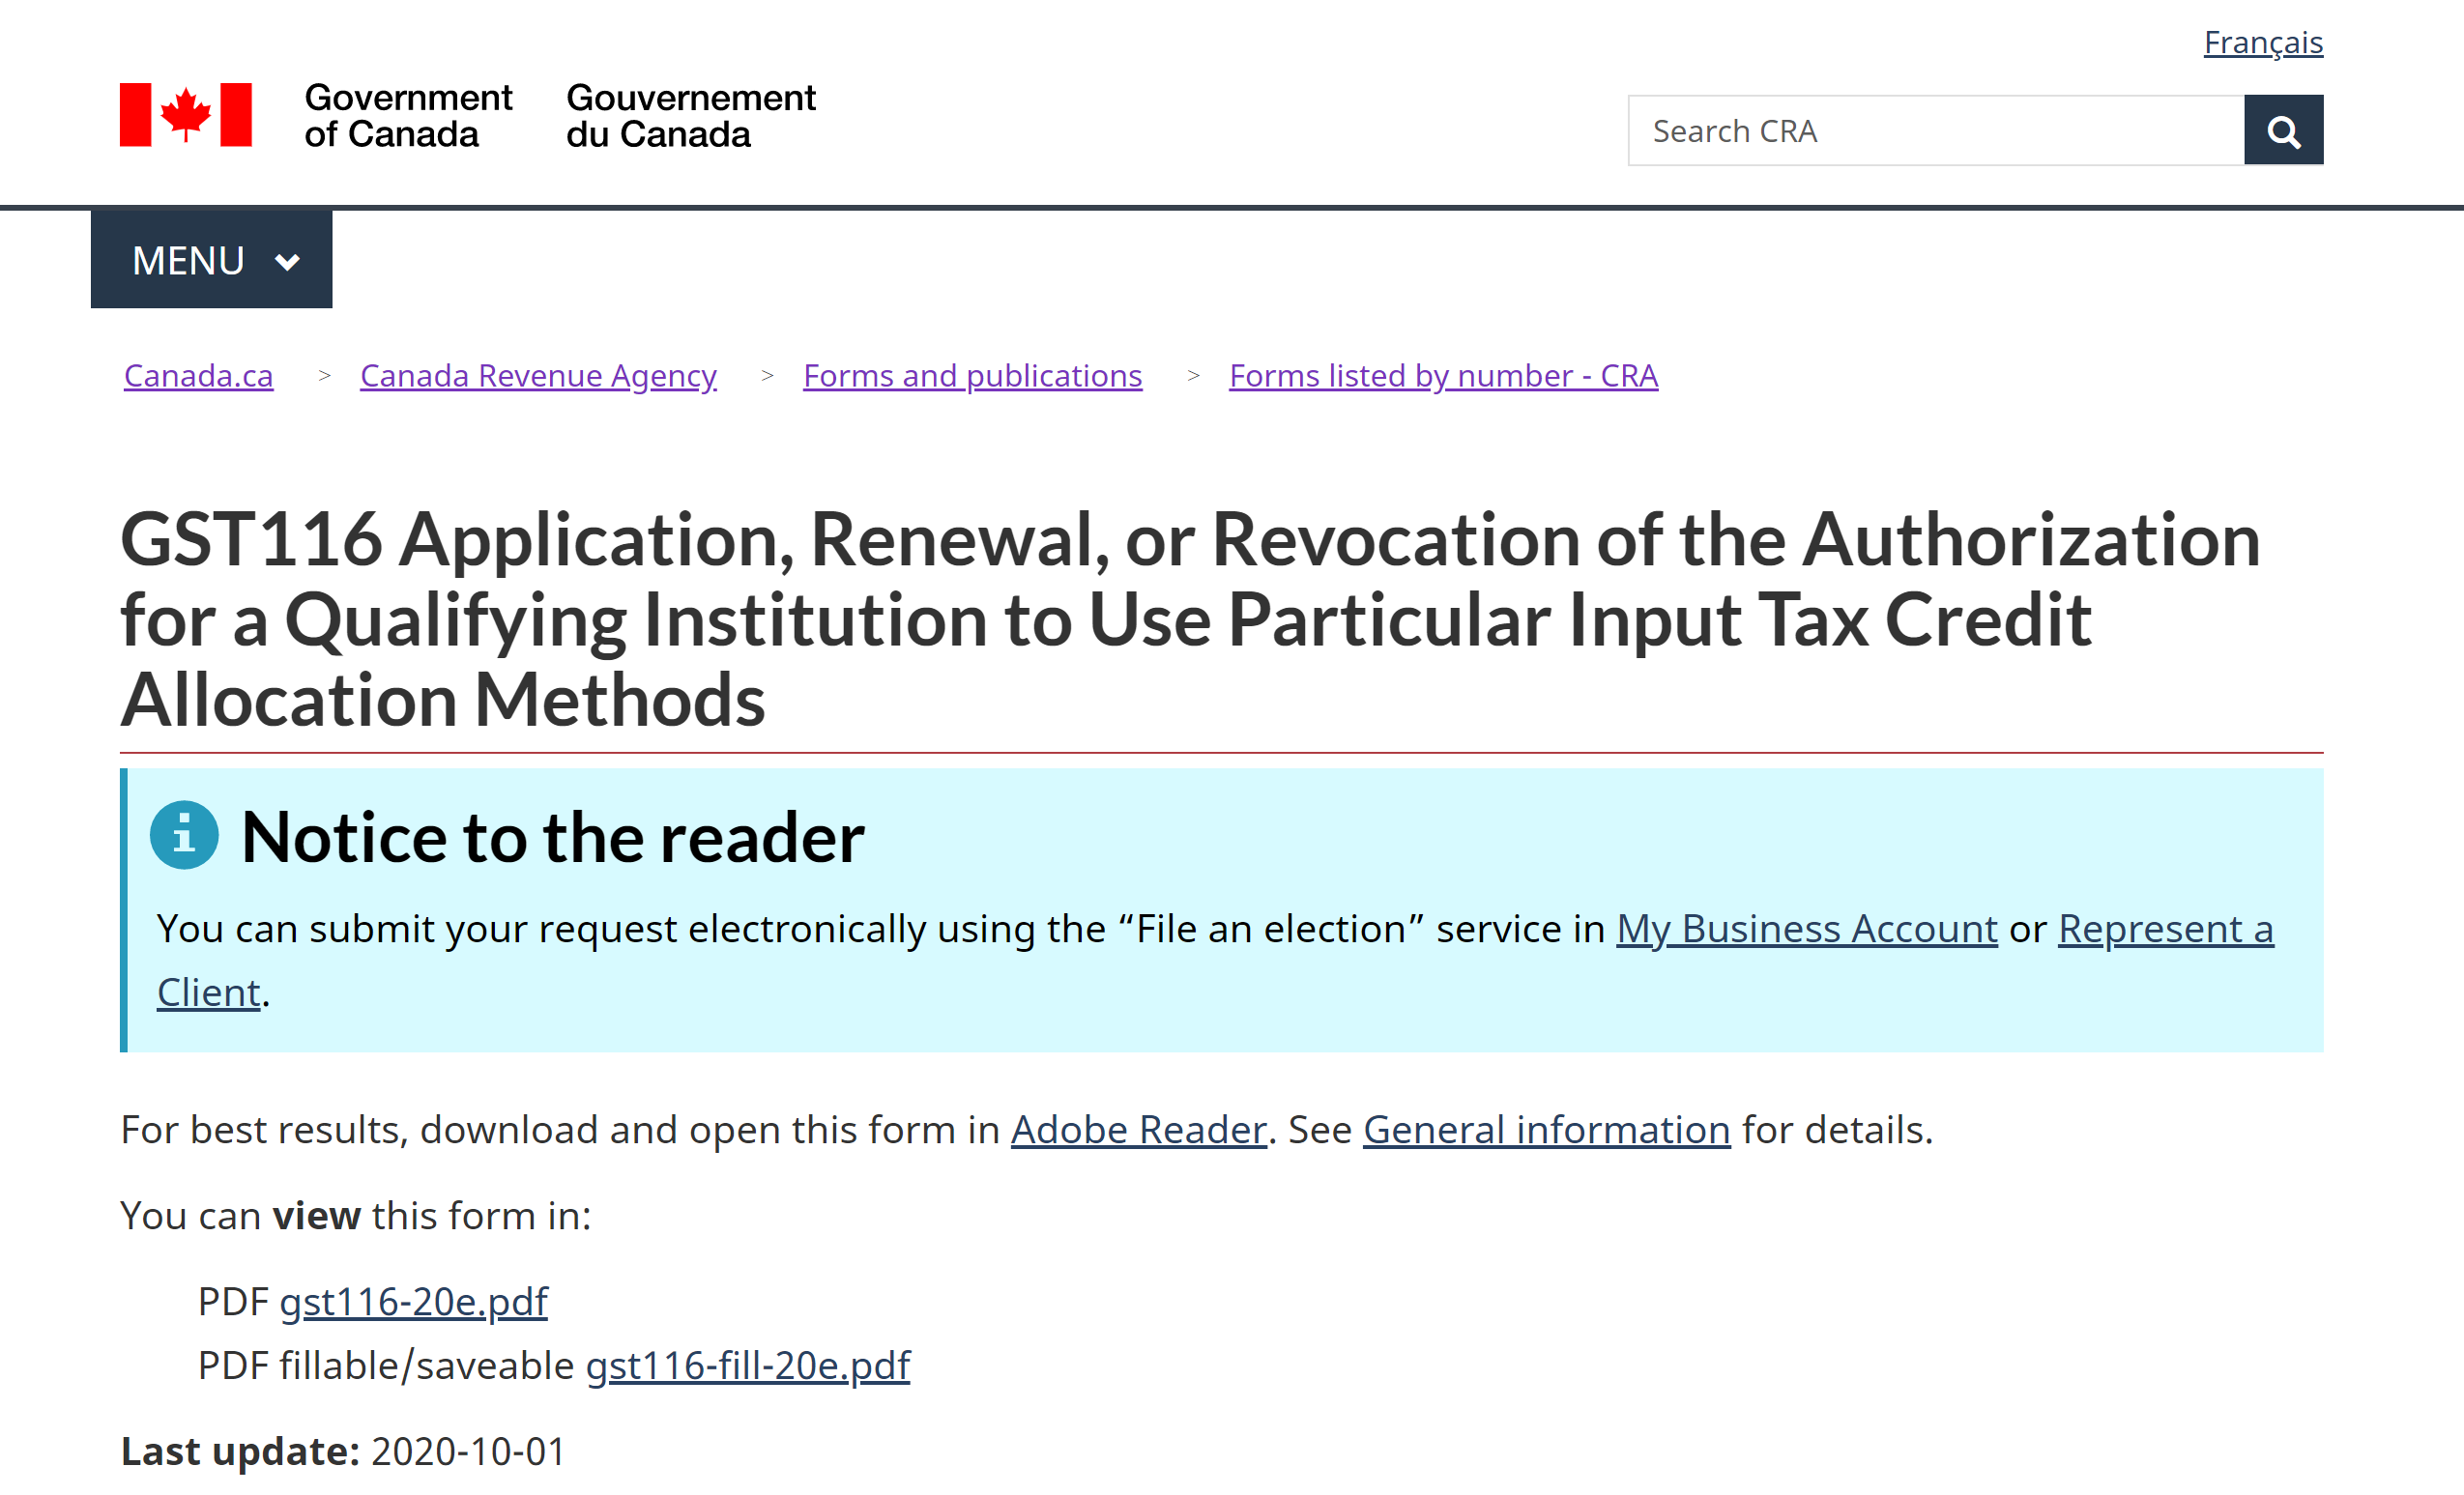
Outbound and Download Links
You can find data by:
- Outbound/download link text: The text that we click on to download the file or go to a different site.
- Both outbound links and downloads use the same dimension.
- The metric for outbound links is Outbound Link Click and the metric for download links is File Download. Both count the number of times that the link was clicked on.
- Outbound/download link URL: The URL of the file or the page that we are going to.
- The metric for outbound links is Outbound Link Click and the metric for download links is File Download. Both count the number of times that the link was clicked on.
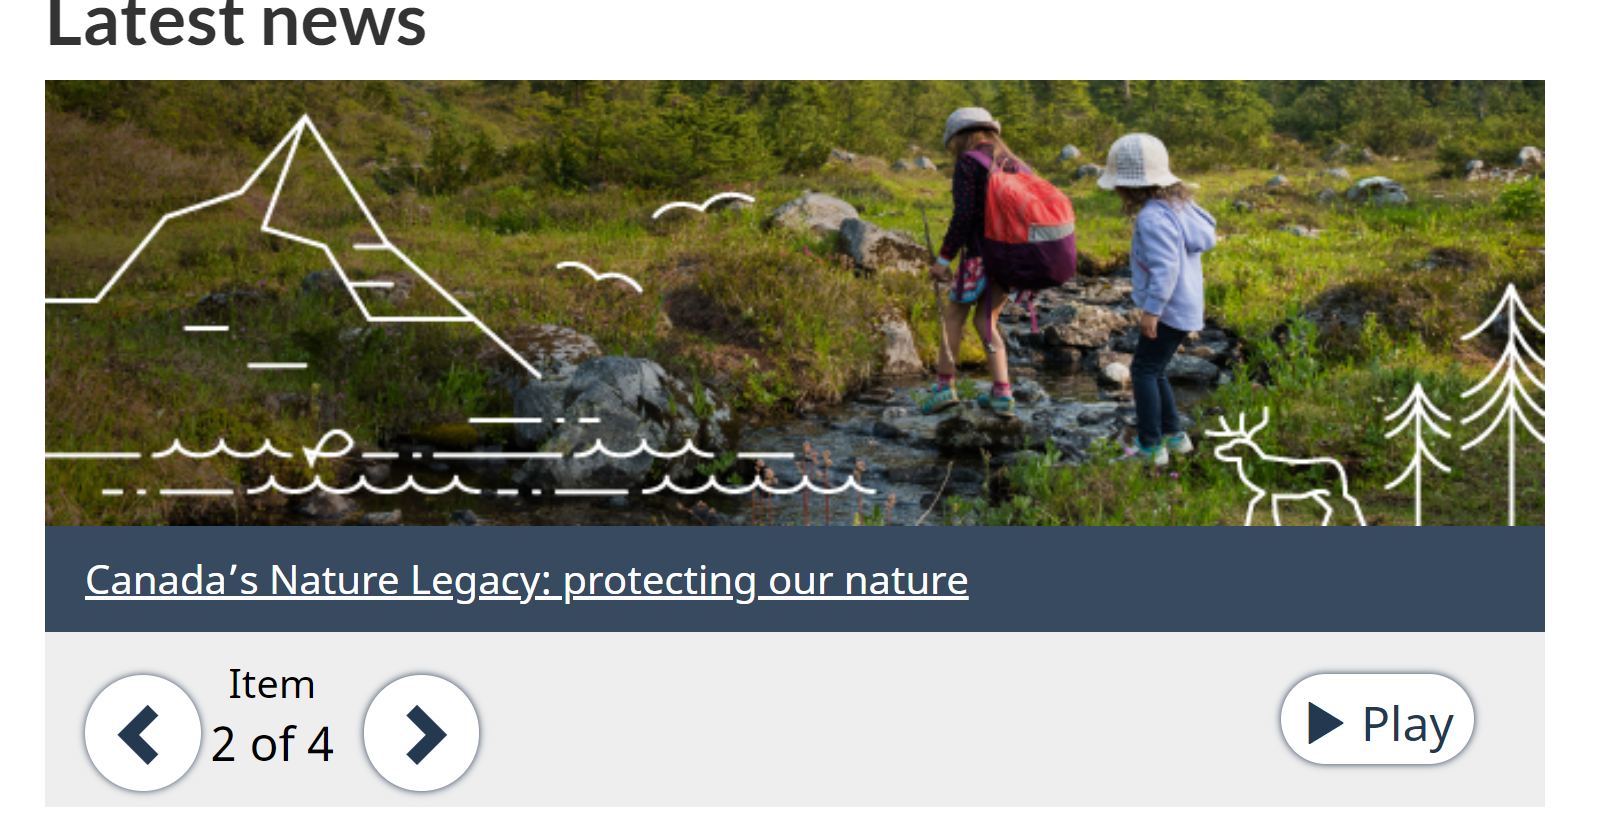
Promotions Within the Site
You can find data by:
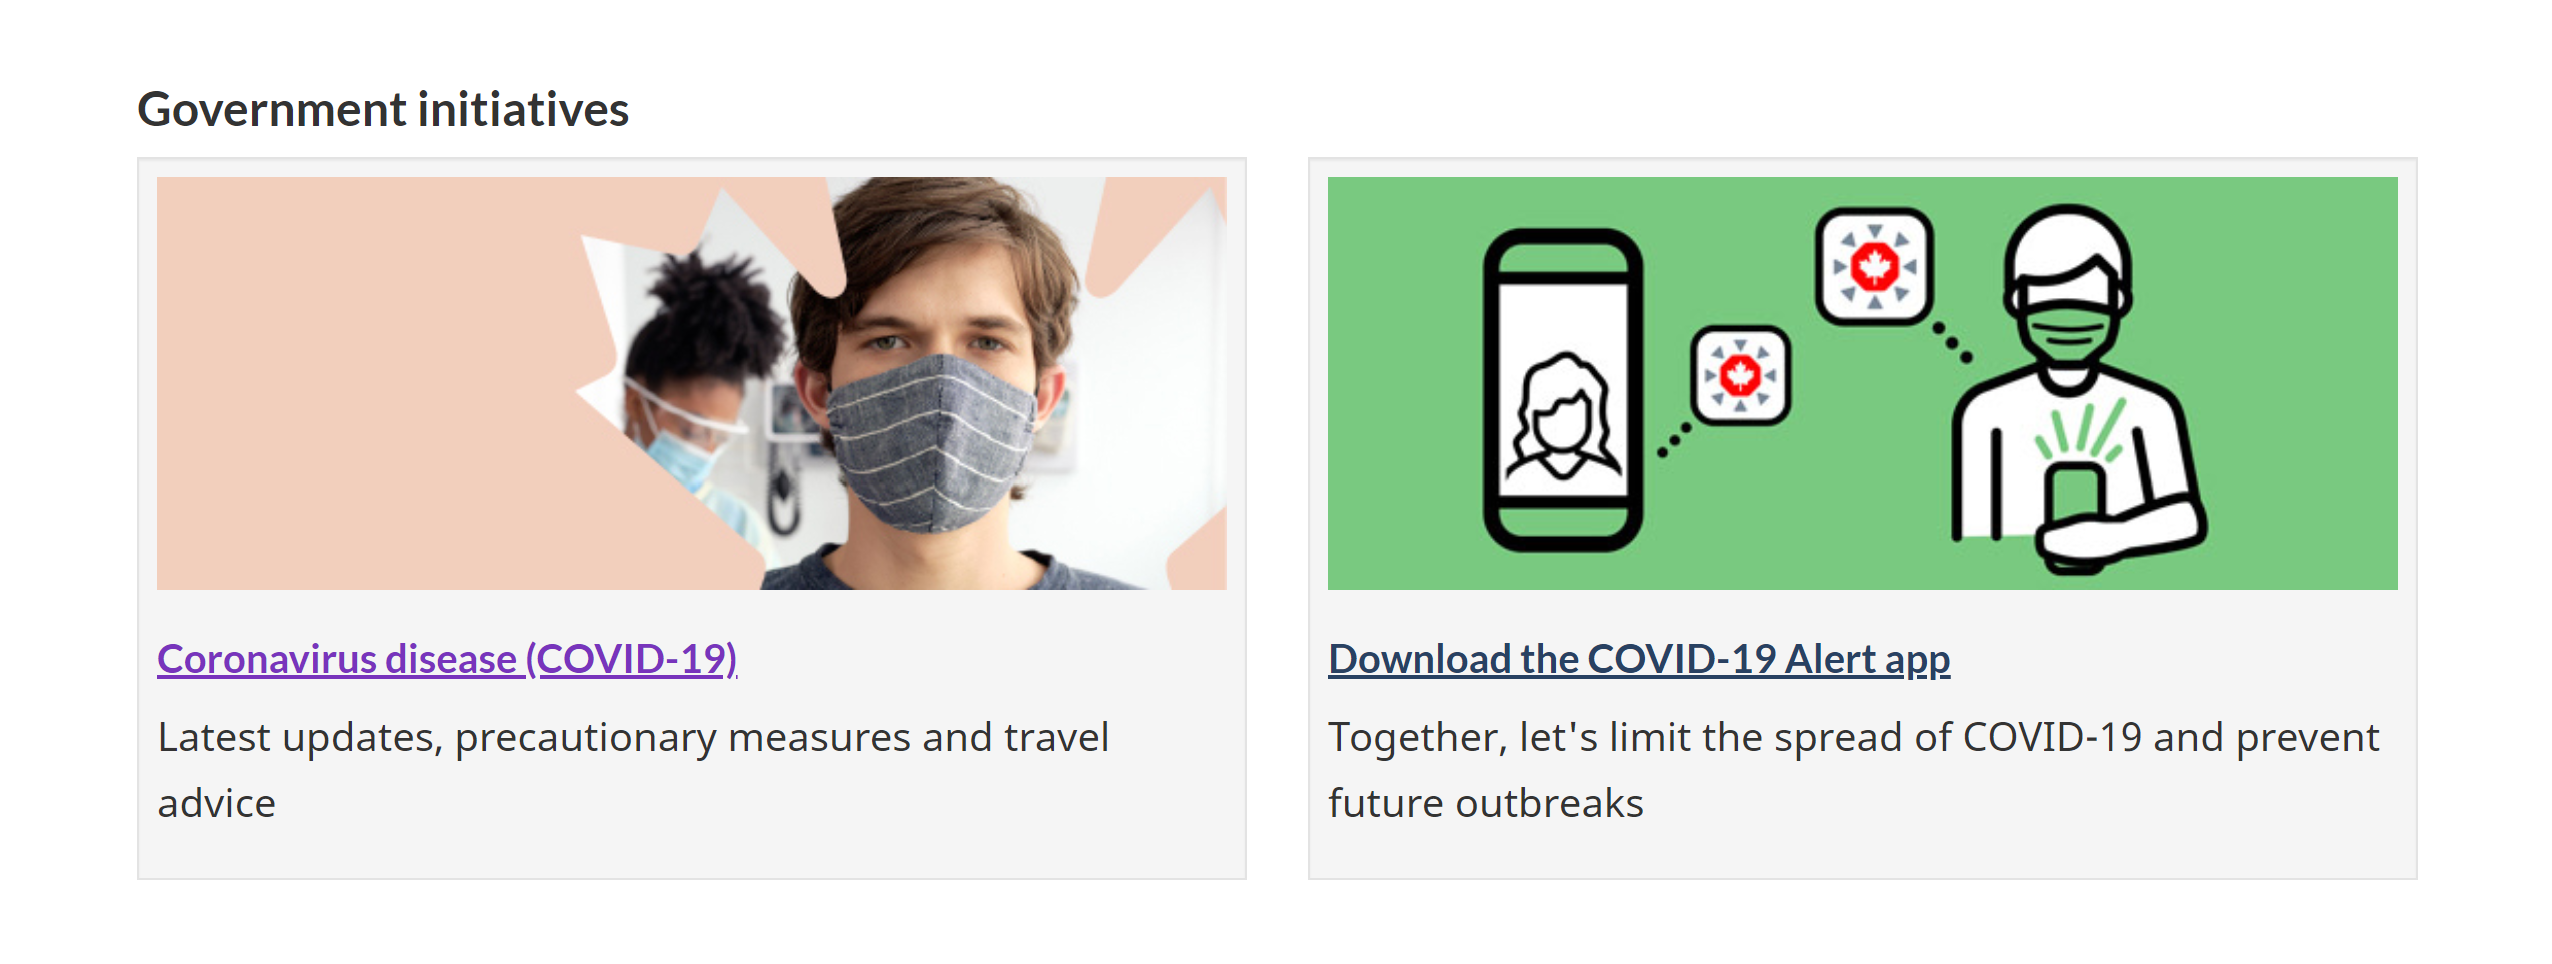
- Content title - internal campaign: The text in the promotion that I click on, e.g. "Download the COVID-19 Alert app"
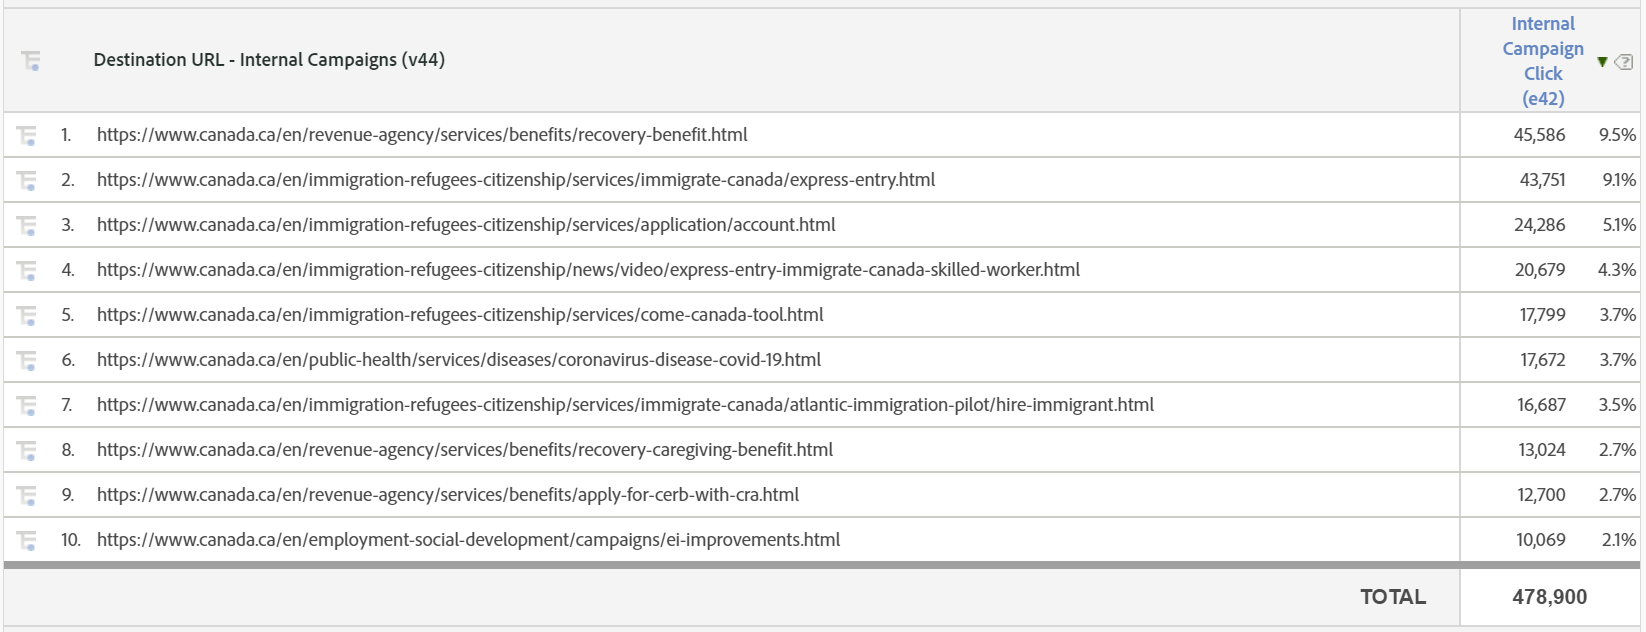
- Destination URL - internal campaign: The URL of the page that I will be taken to after clicking on the promotion. See data table for example values.
- Type - internal campaign: The type of promotion, i.e. carousel, contextual feature, or home page feature.
Forms
You can find data by:
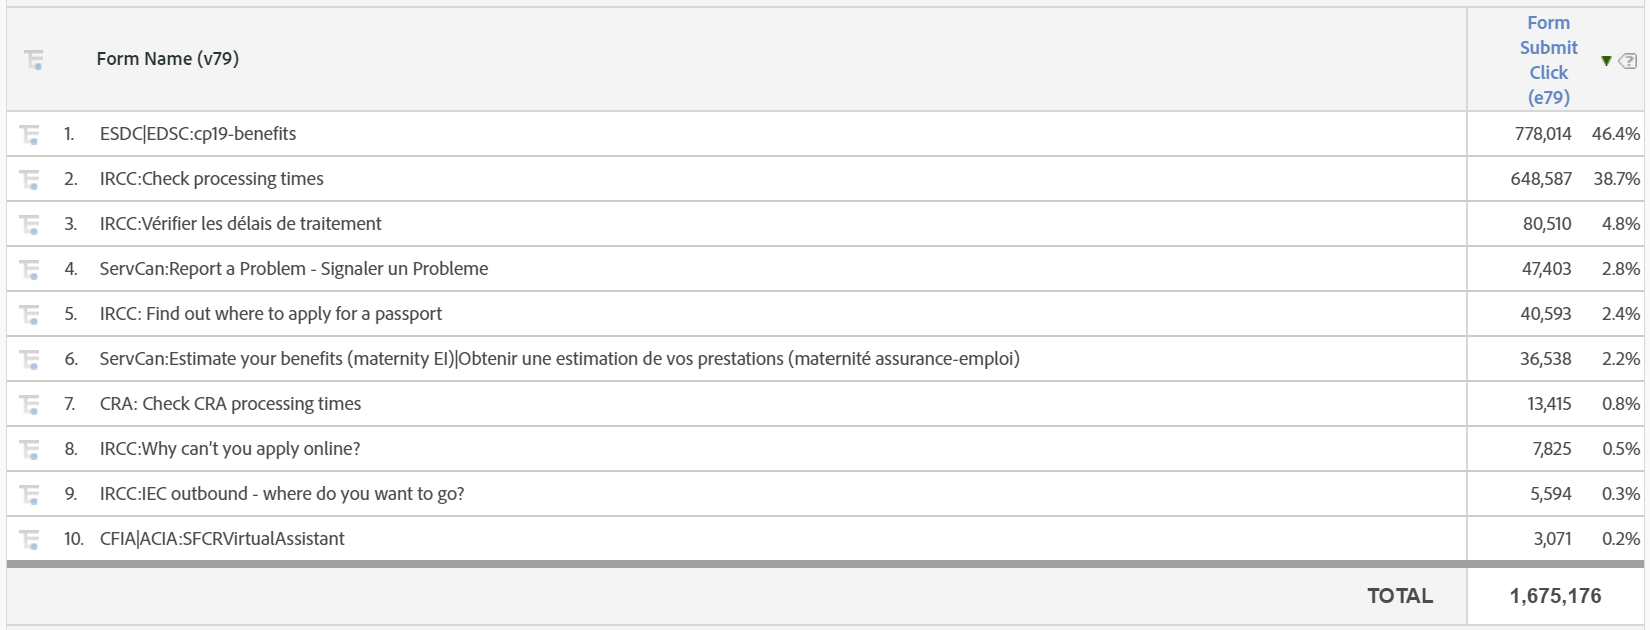
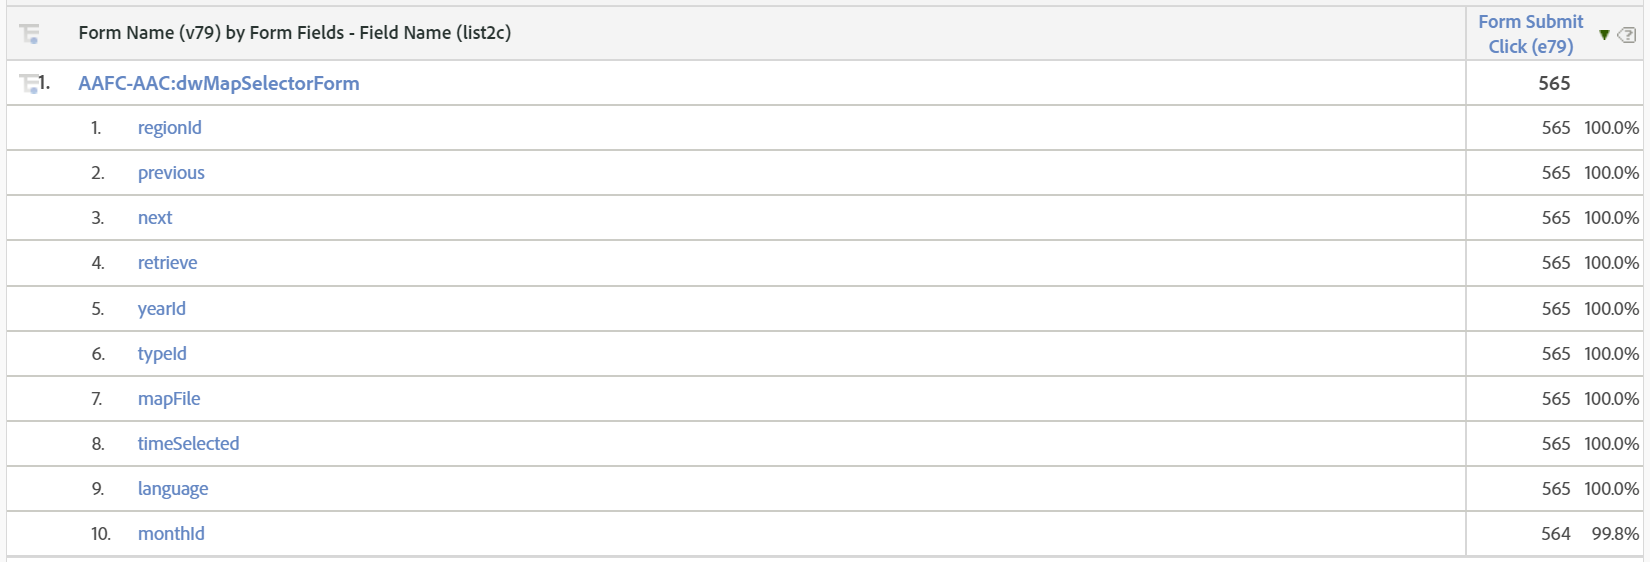
- Form name: The name given to the form by the content creator, e.g. CRA: Check CRA processing times.
- Values take the form [institution English acronym]: [name]
- Form field: A question that the form asks me. This dimension can be broken down into the answers we give, the names of the questions, or the question types.
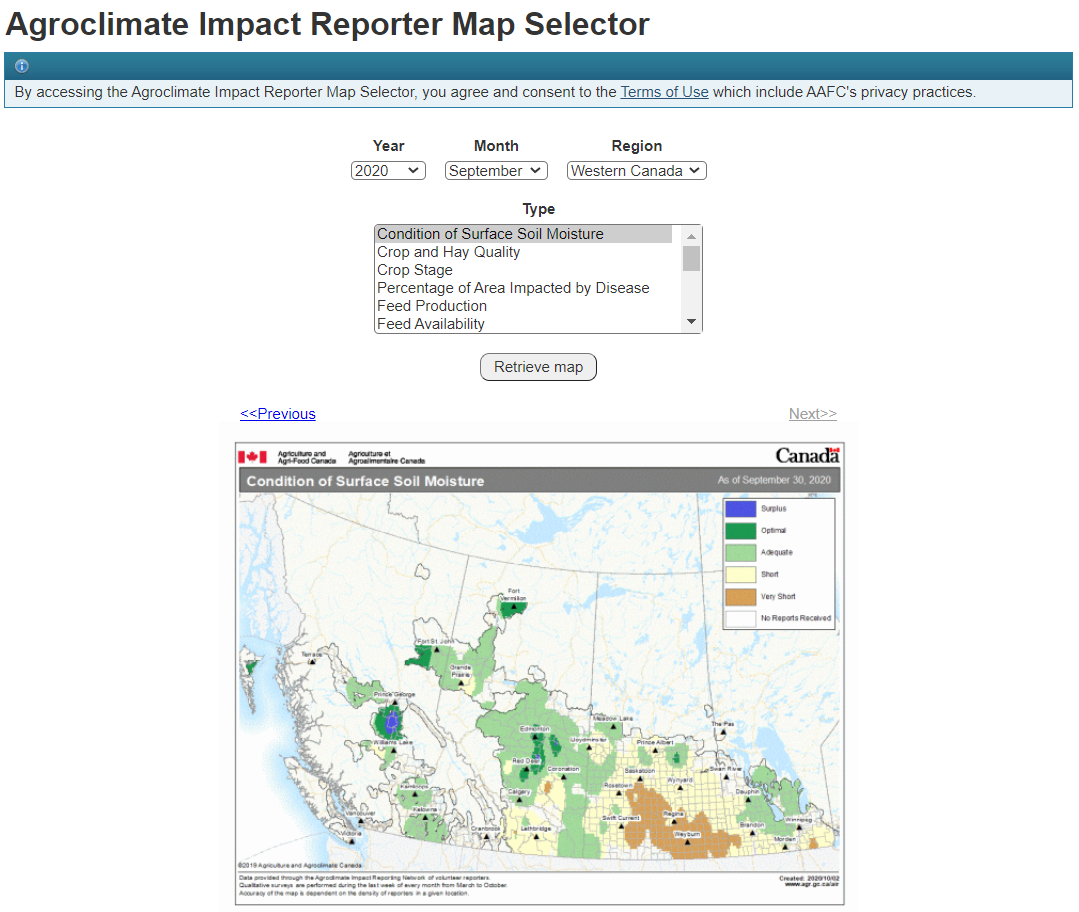
- Form field value: The value I enter or select in a form, e.g. "Western Canada".
- Form field name: The shorthand name that content creators give the question, e.g. "regionID".
- Form field type: The type of question the form asks me, e.g. a drop-down menu of options, a checkbox.
Metrics:
- Form submit click: When I click the button that submits the form.
- Form reset click: When I click the button that clears or resets the form.
Finding Content
Search Phrases and Search Results
You can find site search data by:
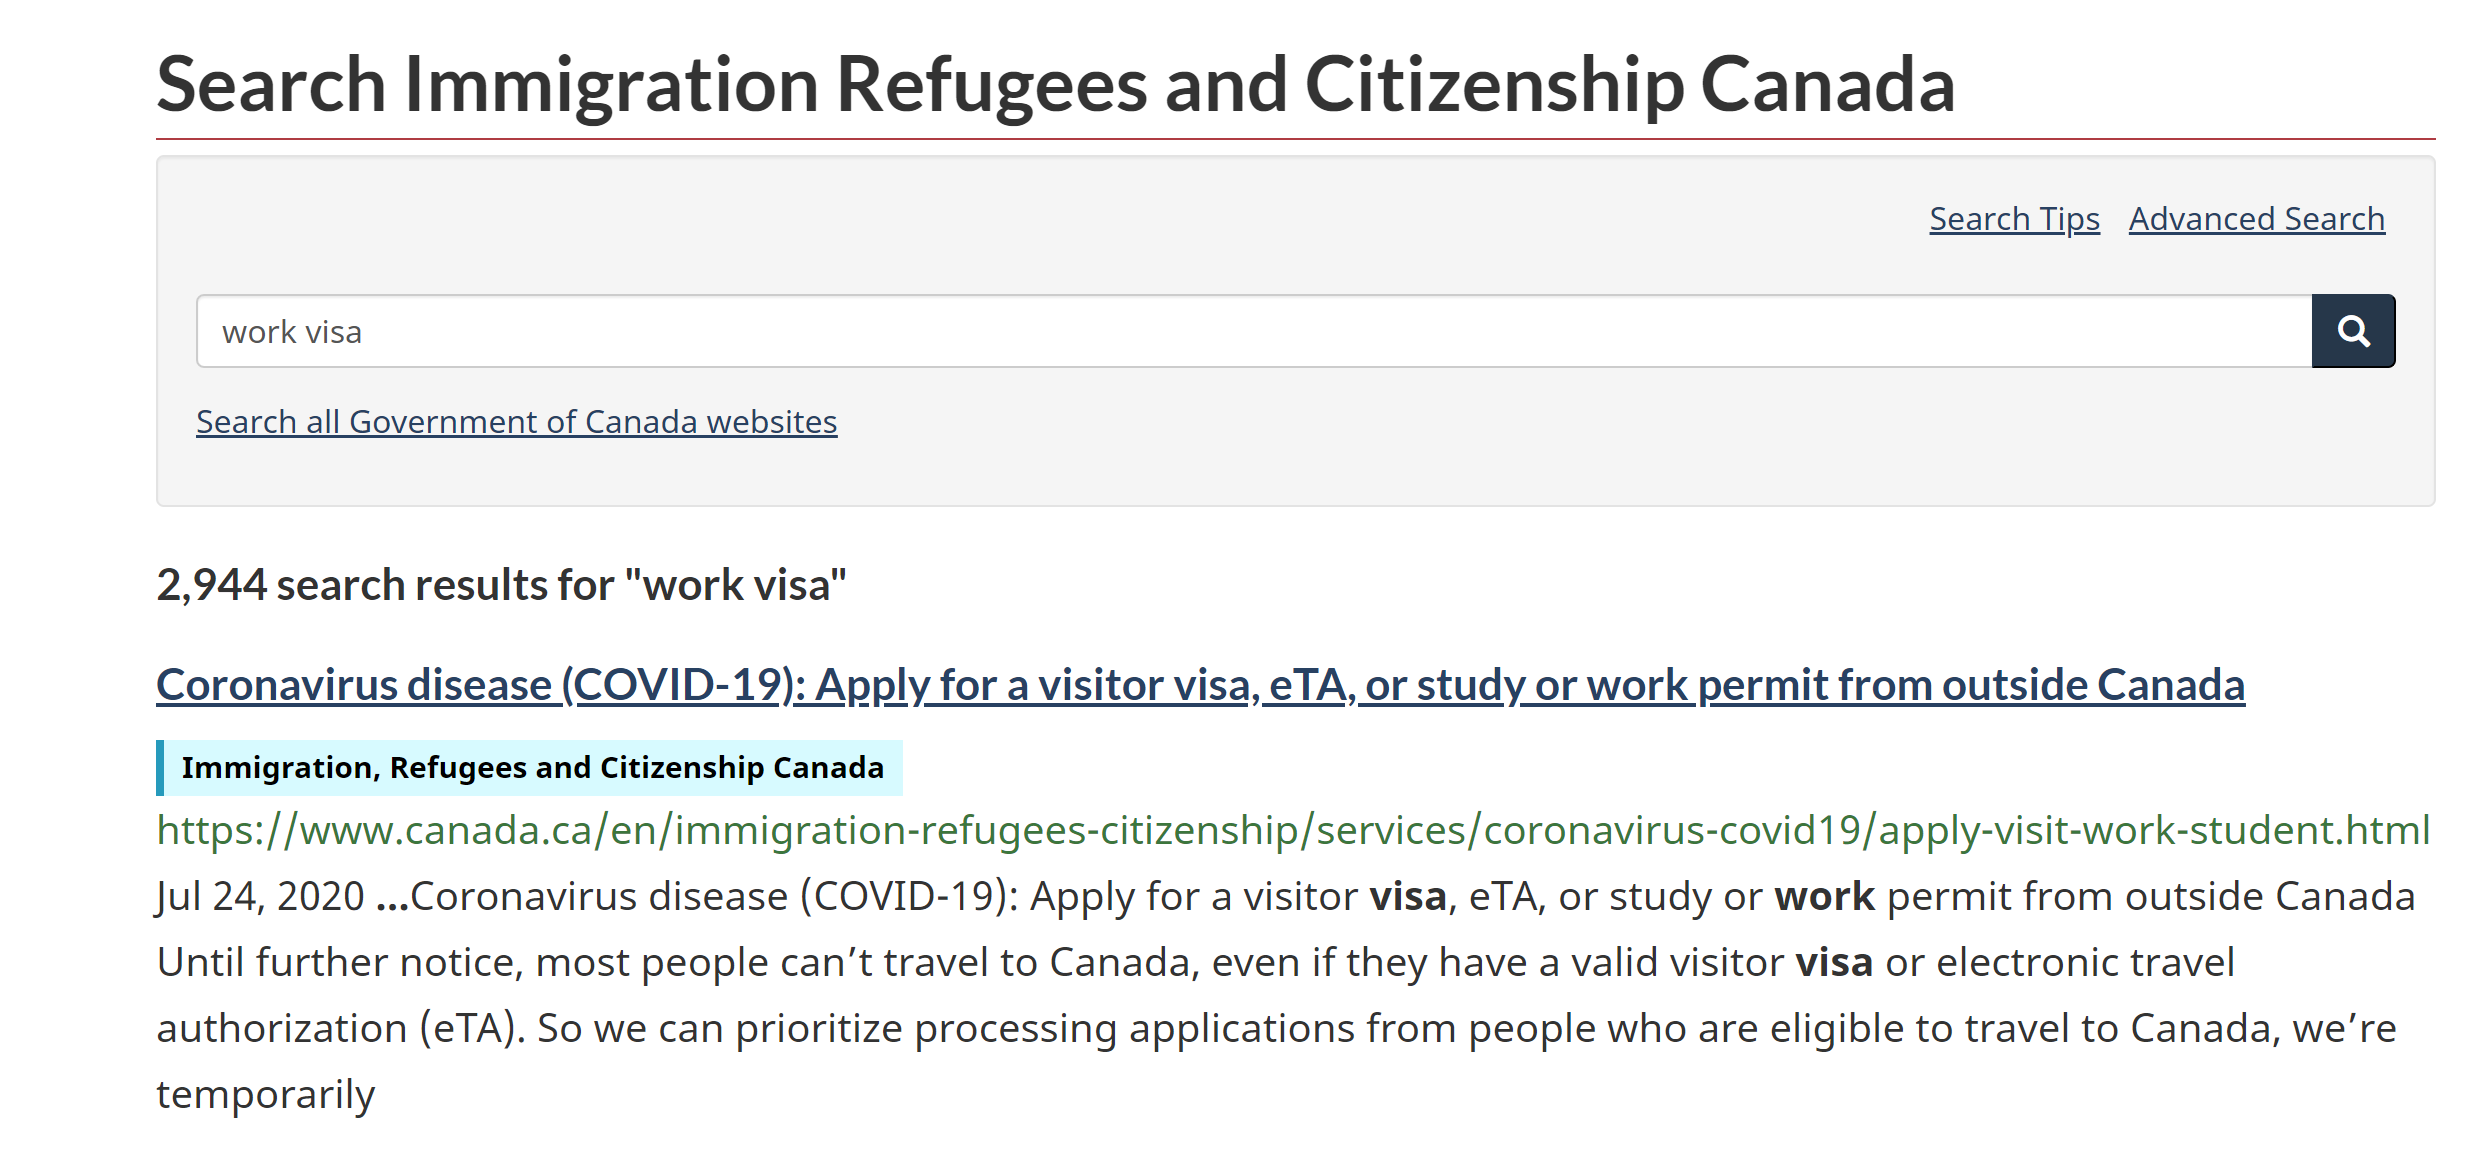
- Phrase: The text I enter into the search bar, e.g. "starting a business".
- Destination title: When I click on one of the search results, this is the title of the page that my browser loads, e.g. "Support for businesses in Nunavut"
- Destination URL: The URL of the search result that I click on, e.g. https://www.canada.ca/en/services/business/start/support-financing/businesssupport/nunavut.html
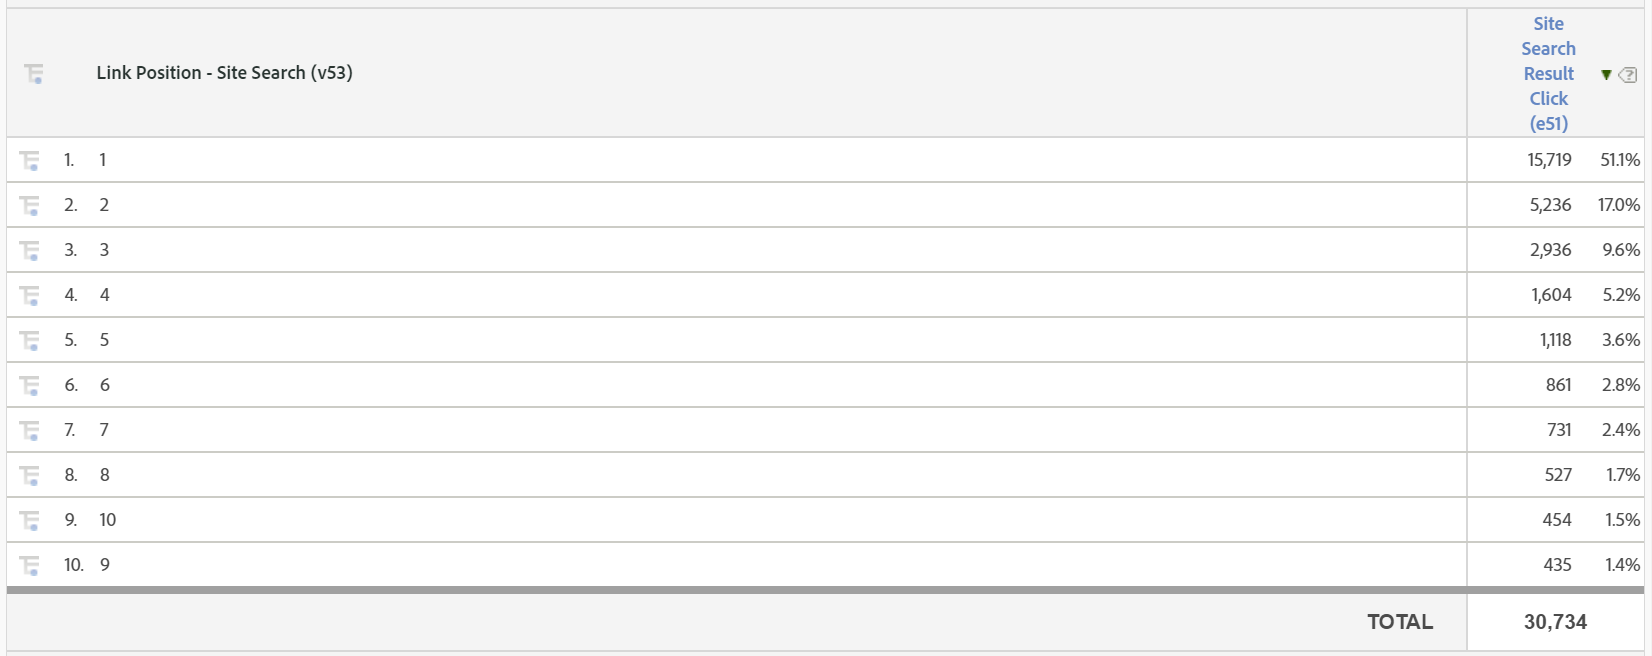
- Link position: The rank of the result that I clicked on between the top result and the last result, e.g. 1st, 5th, 8th.
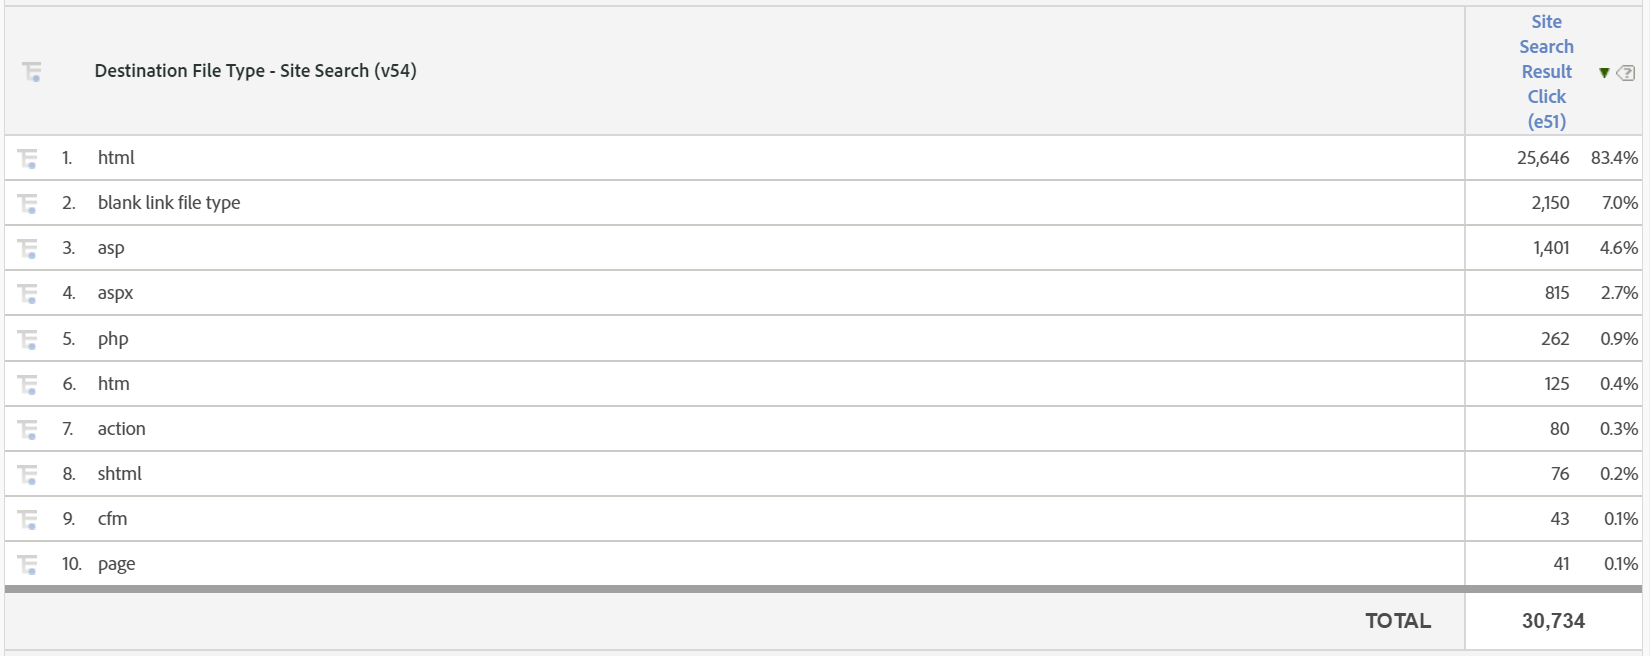
- Destination file type: The file type of the result that I clicked on, e.g. html, php, pdf.
- Refinement type: Whether I refined my search by e.g. changing my search phrase or using advanced search options.
Metrics:
- Internal site search: When I enter a phrase into the website's search bar and click "Search".
- Internal search result click: When I click on one of the results from my search.
Head, Footer, and Menu
You can find data by:
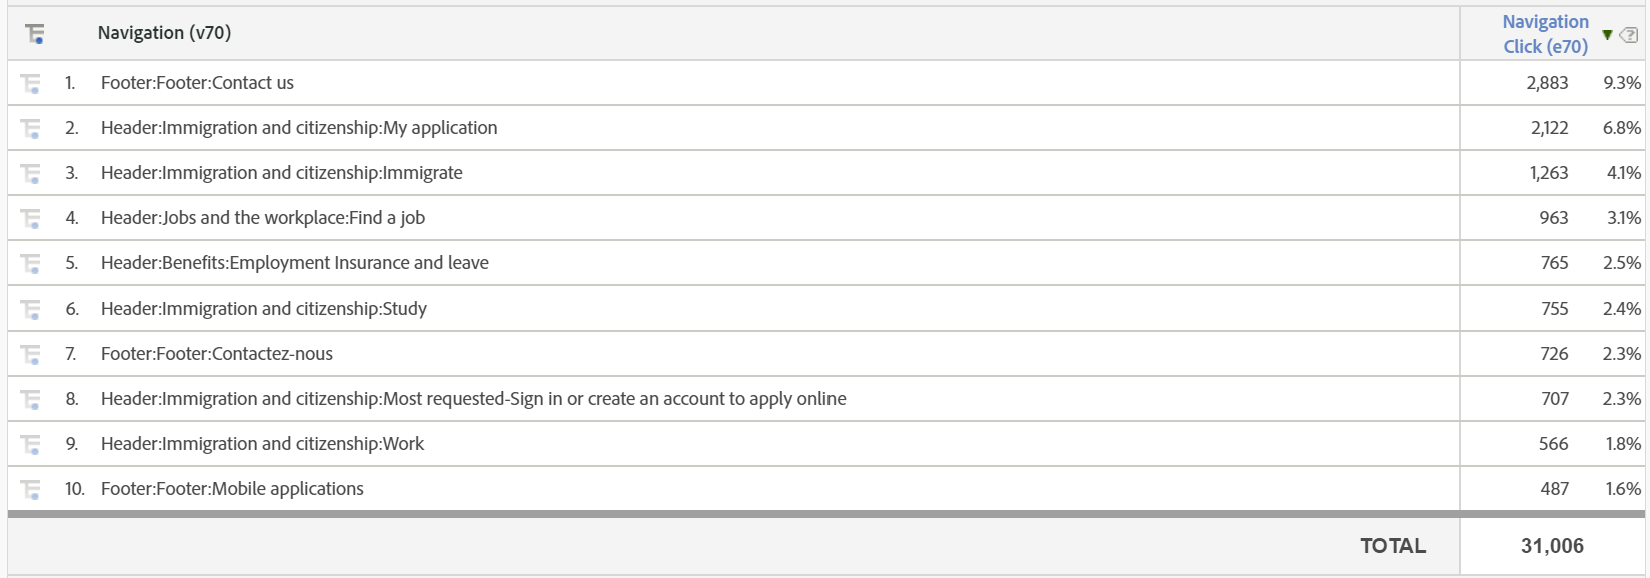
- Navigation: The links in the header and foots of a page, including the menu, e.g. "Header: Culture, history and sport: Arts & media".
- Type: Whether the link is in the header or the footer.
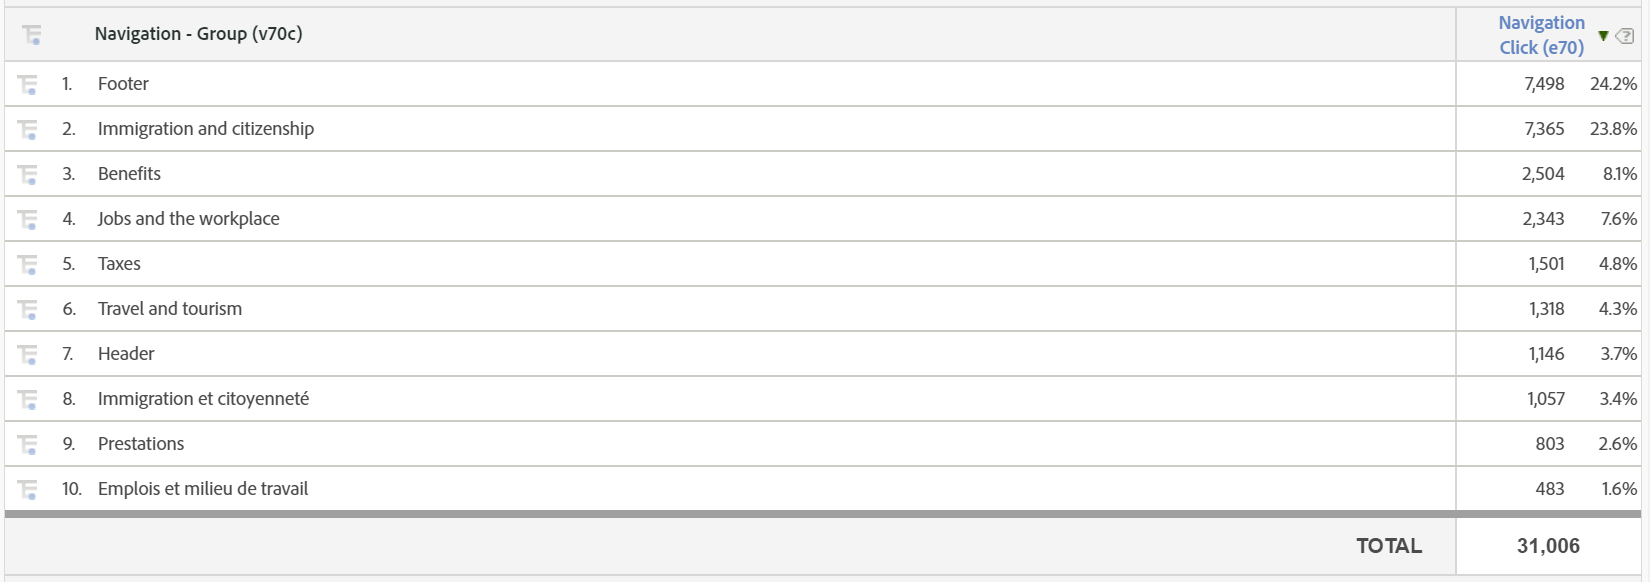
- Group: The sub-level of the type, e.g. "Immigration and Citizenship".
- The sub-level of all Footer type links is Footer. The "Header" group refers links in the header outside the main menu, e.g. "Français".
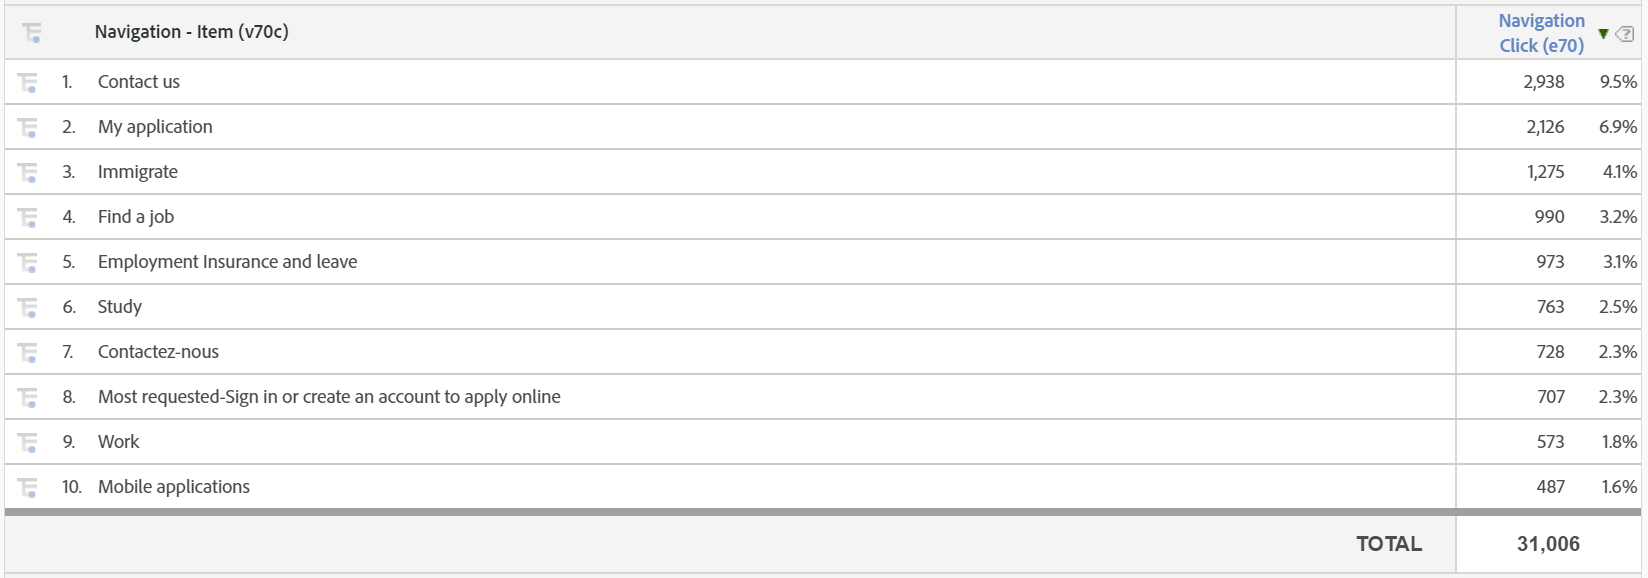
- Item: The text of the link that we clicked on, e.g. "Arts and media".
Metrics:
- Navigation click: When I click on the header or footer links on a page.
User Experience
Page Errors
You can find data by:
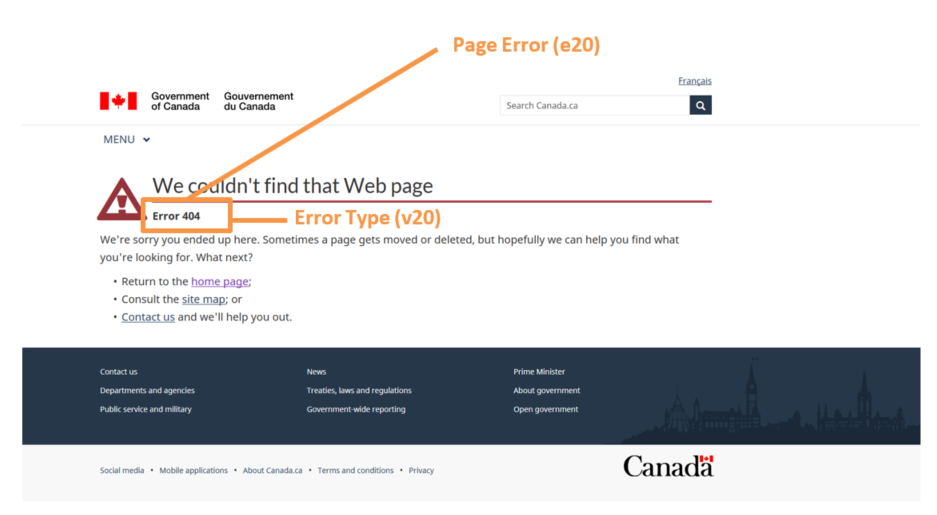
- Error type: The kind of page error that I saw rather than the content I hoped to see, i.e. error 404 (missing page), error 500 (internal server messed up), error 403 (forbidden content)
- "No search results" is when I search a term on the internal site search and get 0 results.
Metric:
- Page error: The number of times an error is loaded. This is like the page view metric, only specifically for error pages.
Tasks Identified by Users
You can find data by:
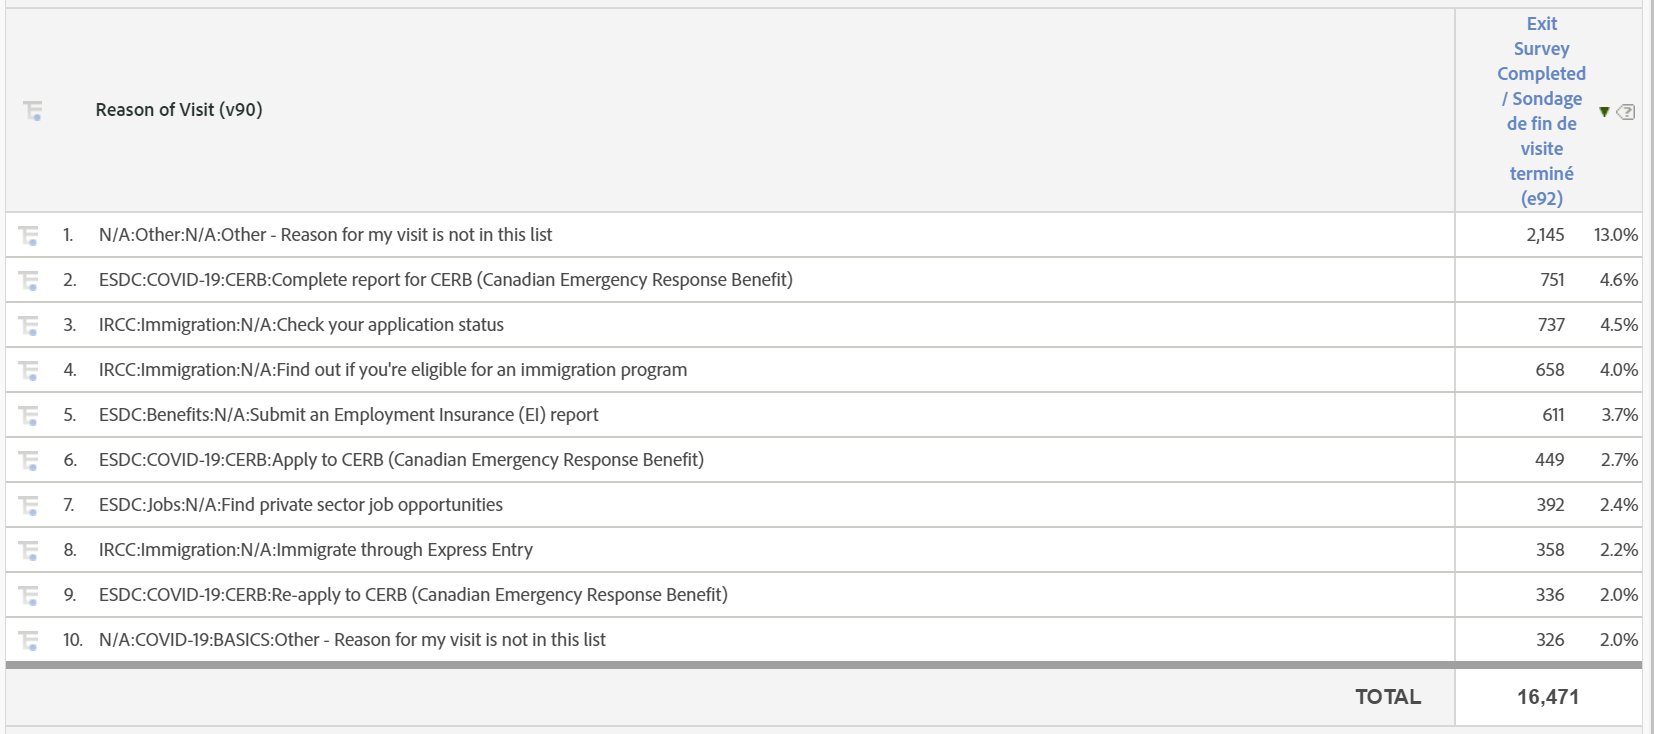
- Reason for visit: The task that I am trying to do on the site, along with the topic that task belongs to, the theme of the task, and the institution responsible for that task, e.g. "ESDC:Benefits:N/A:Submit an Employment Insurance (EI) report".
- The list of tasks to choose from is made by asking each department what they think users come to their site to do.
- Users first pick the topic area of their task (e.g. "Transport and infrastructure"), then select one of about 30 tasks in that topic (e.g. "Learn tips on safe boating")
- Data is only collected if users submit the survey. If they select a task, click to the next survey page, and close the survey before submitting at the bottom of the second page, no data is collected.
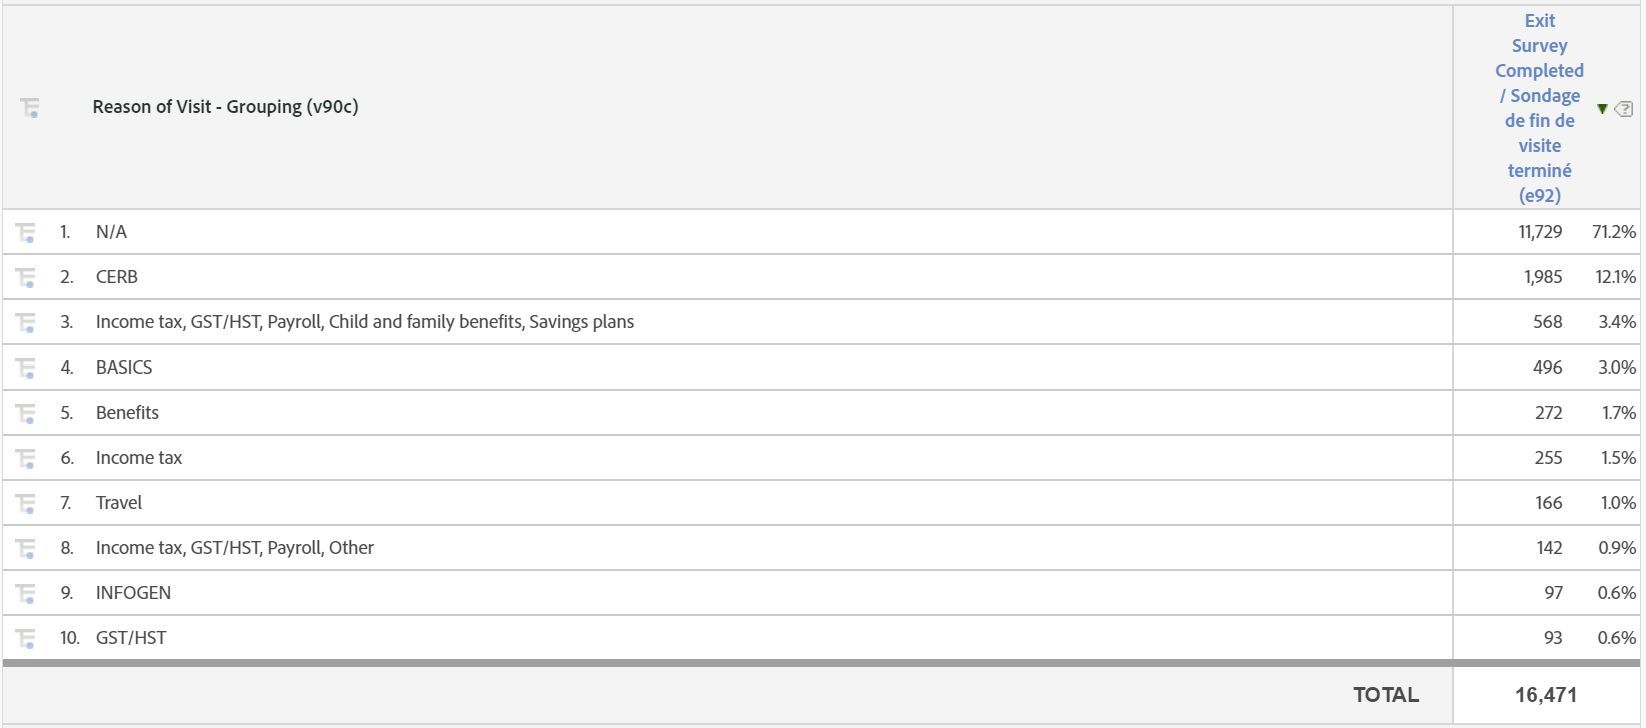
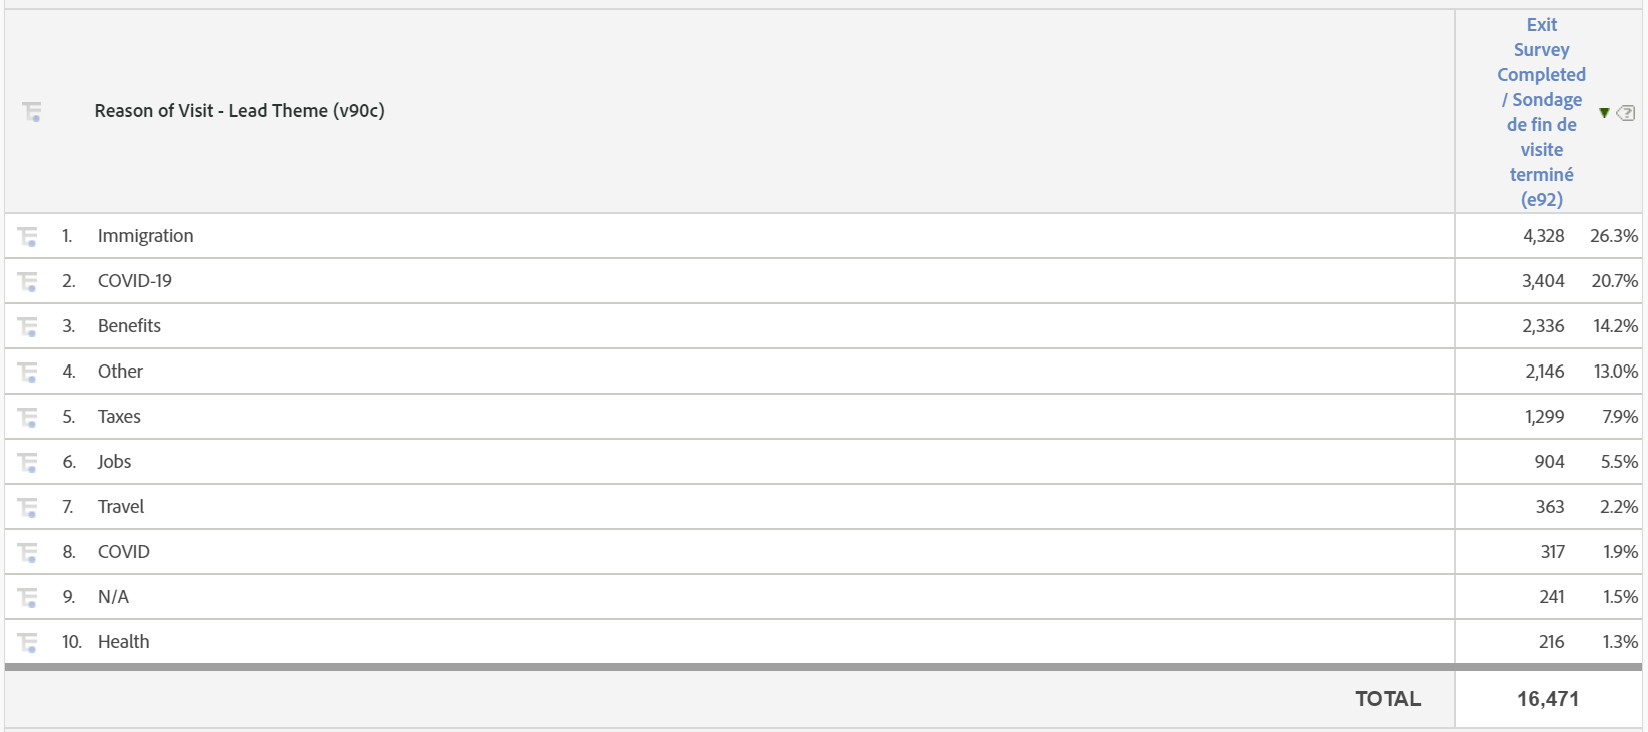
- This dimension can be broken down into the task, the topic, and the institution.
- Task: The task I am trying to do by being on the site, e.g. Submit an Employment Insurance (EI) report.
- Group: The group that that task belongs to, e.g. "Travel".
- Theme: The theme connected to the task, e.g. "Benefits"
- Institution: The institution that the task relates to, e.g. if the task is "Apply for Employment Insurance", the institution would be Employment and Social Development Canada.
Metric:
- Exit Survey Completed: When I click submit on the last page of the exit survey.
- Standardized Survey Completed: When I click submit on the last page of the standardized survey.
Site Wide Survey Results
You can find data by:
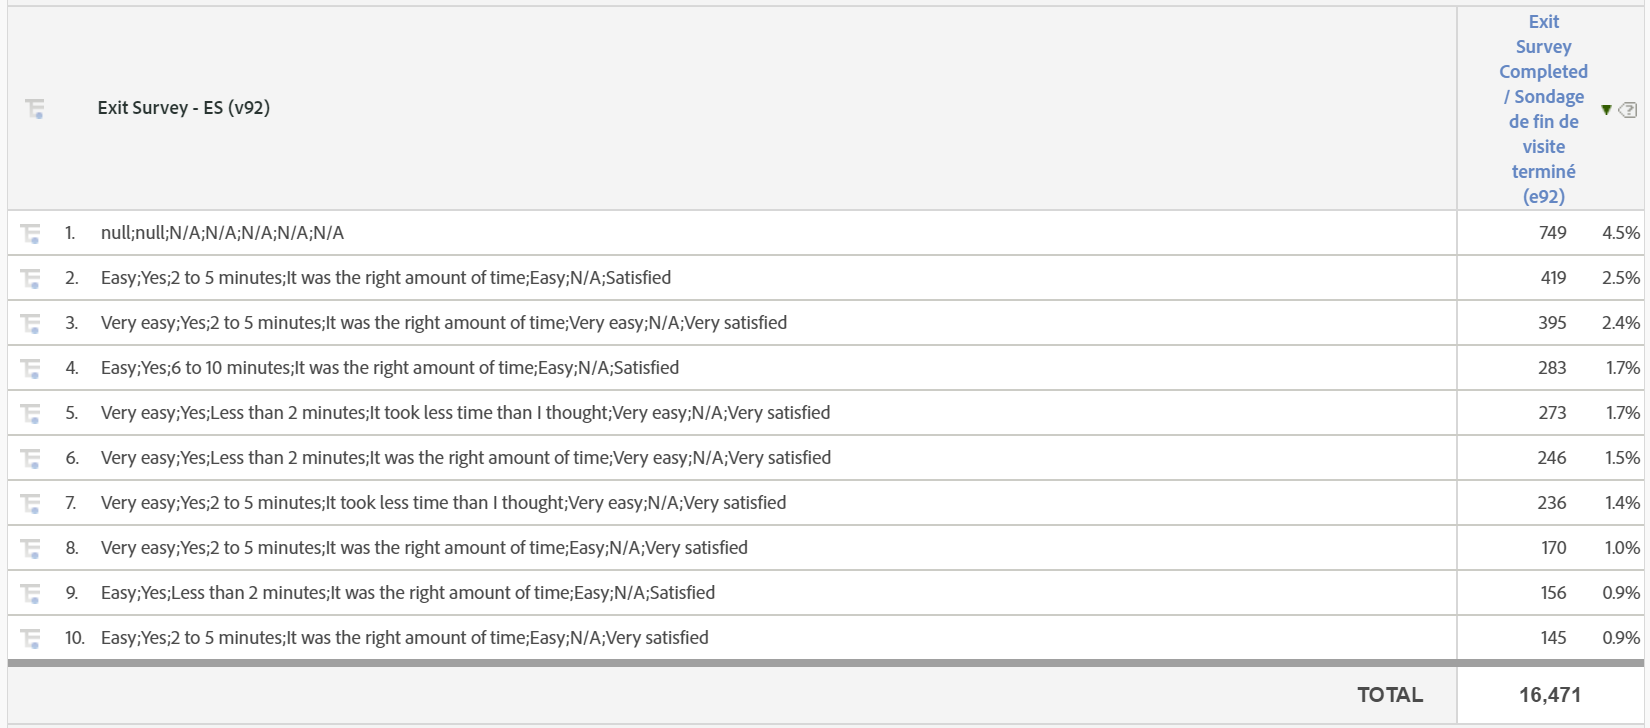
- Exit survey: The answers that I gave to the questions that the exit survey asked me, e.g. "How easy was it to complete your task?" - "Very Easy".
- The metric is Exit Survey Completed, when I click submit on the last page of the exit survey.
This dimension can be broken down into each of the questions in the survey.
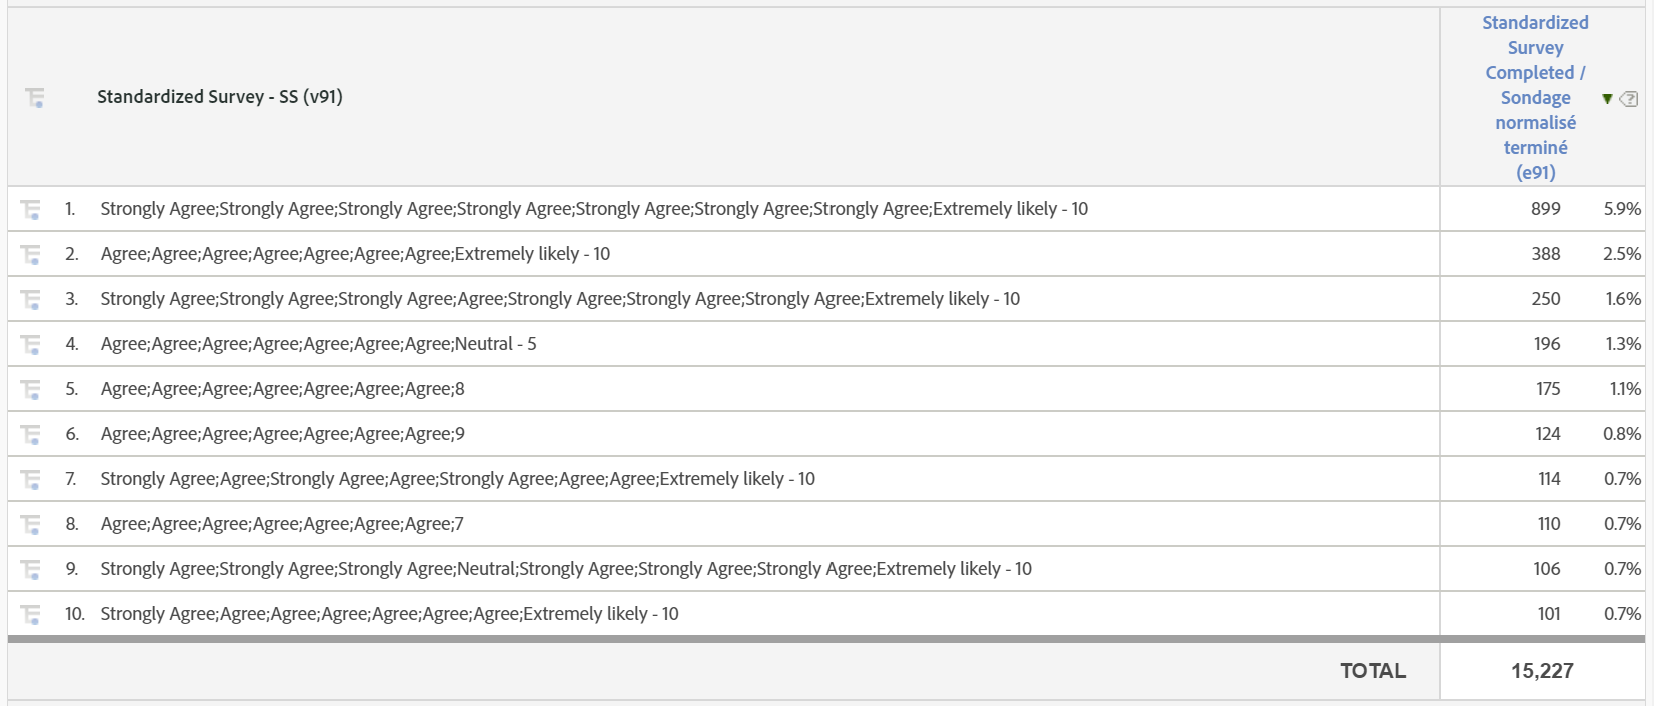
- Standard survey: The answers I gave to the questions that the standard survey asked me, e.g. "To what extent do you agree that you would return to the website in the future?" - "Agree".
The metric is Standardized Survey Completed, when I click submit on the last page of the standardized survey.
- This dimension can be broken down into each of the questions in the survey.
How are users moving through the site?
For any page in my visit, analysts can learn:
- Next page: The page my browser loads right after a specific page. The metric is instances.
- Previous page: The page my browser loaded right before a specific page. The metric is instances.
- Entry pages: Whether a specific page was the first page my browser loaded on the site.
- Exit pages: Whether a specific page was the last page my browser loaded on the site.
Analysts can do this analysis by page title or page URL. They can also do these analyses by phrases I searched, my clicks on the header and footer, and any other action I take.
- For example, analysts can see all of my clicks before and after a specific click. They can see the search term I entered on my first visit.
