6 Metrics and problem solving
Product data science interviews tend to allocate 45 minutes to an hour for problem-solving and/or root-cause analysis problems that involve metric definition, monitoring, and troubleshooting. Even though much of this session focuses on context understanding and the candidate’s creative ability to come up with proper solutions, some fundamental knowledge on metrics along with a response framework will tremendously help. In this chapter, I will provide a general framework and show a few examples that you can use it in practice to answer metrics questions.
Framework for responding to all metrics questions
Below, I draw the framework that I rely on to practice and answer open-ended metrics questions (right-click and open to a new page if the font size is too small):
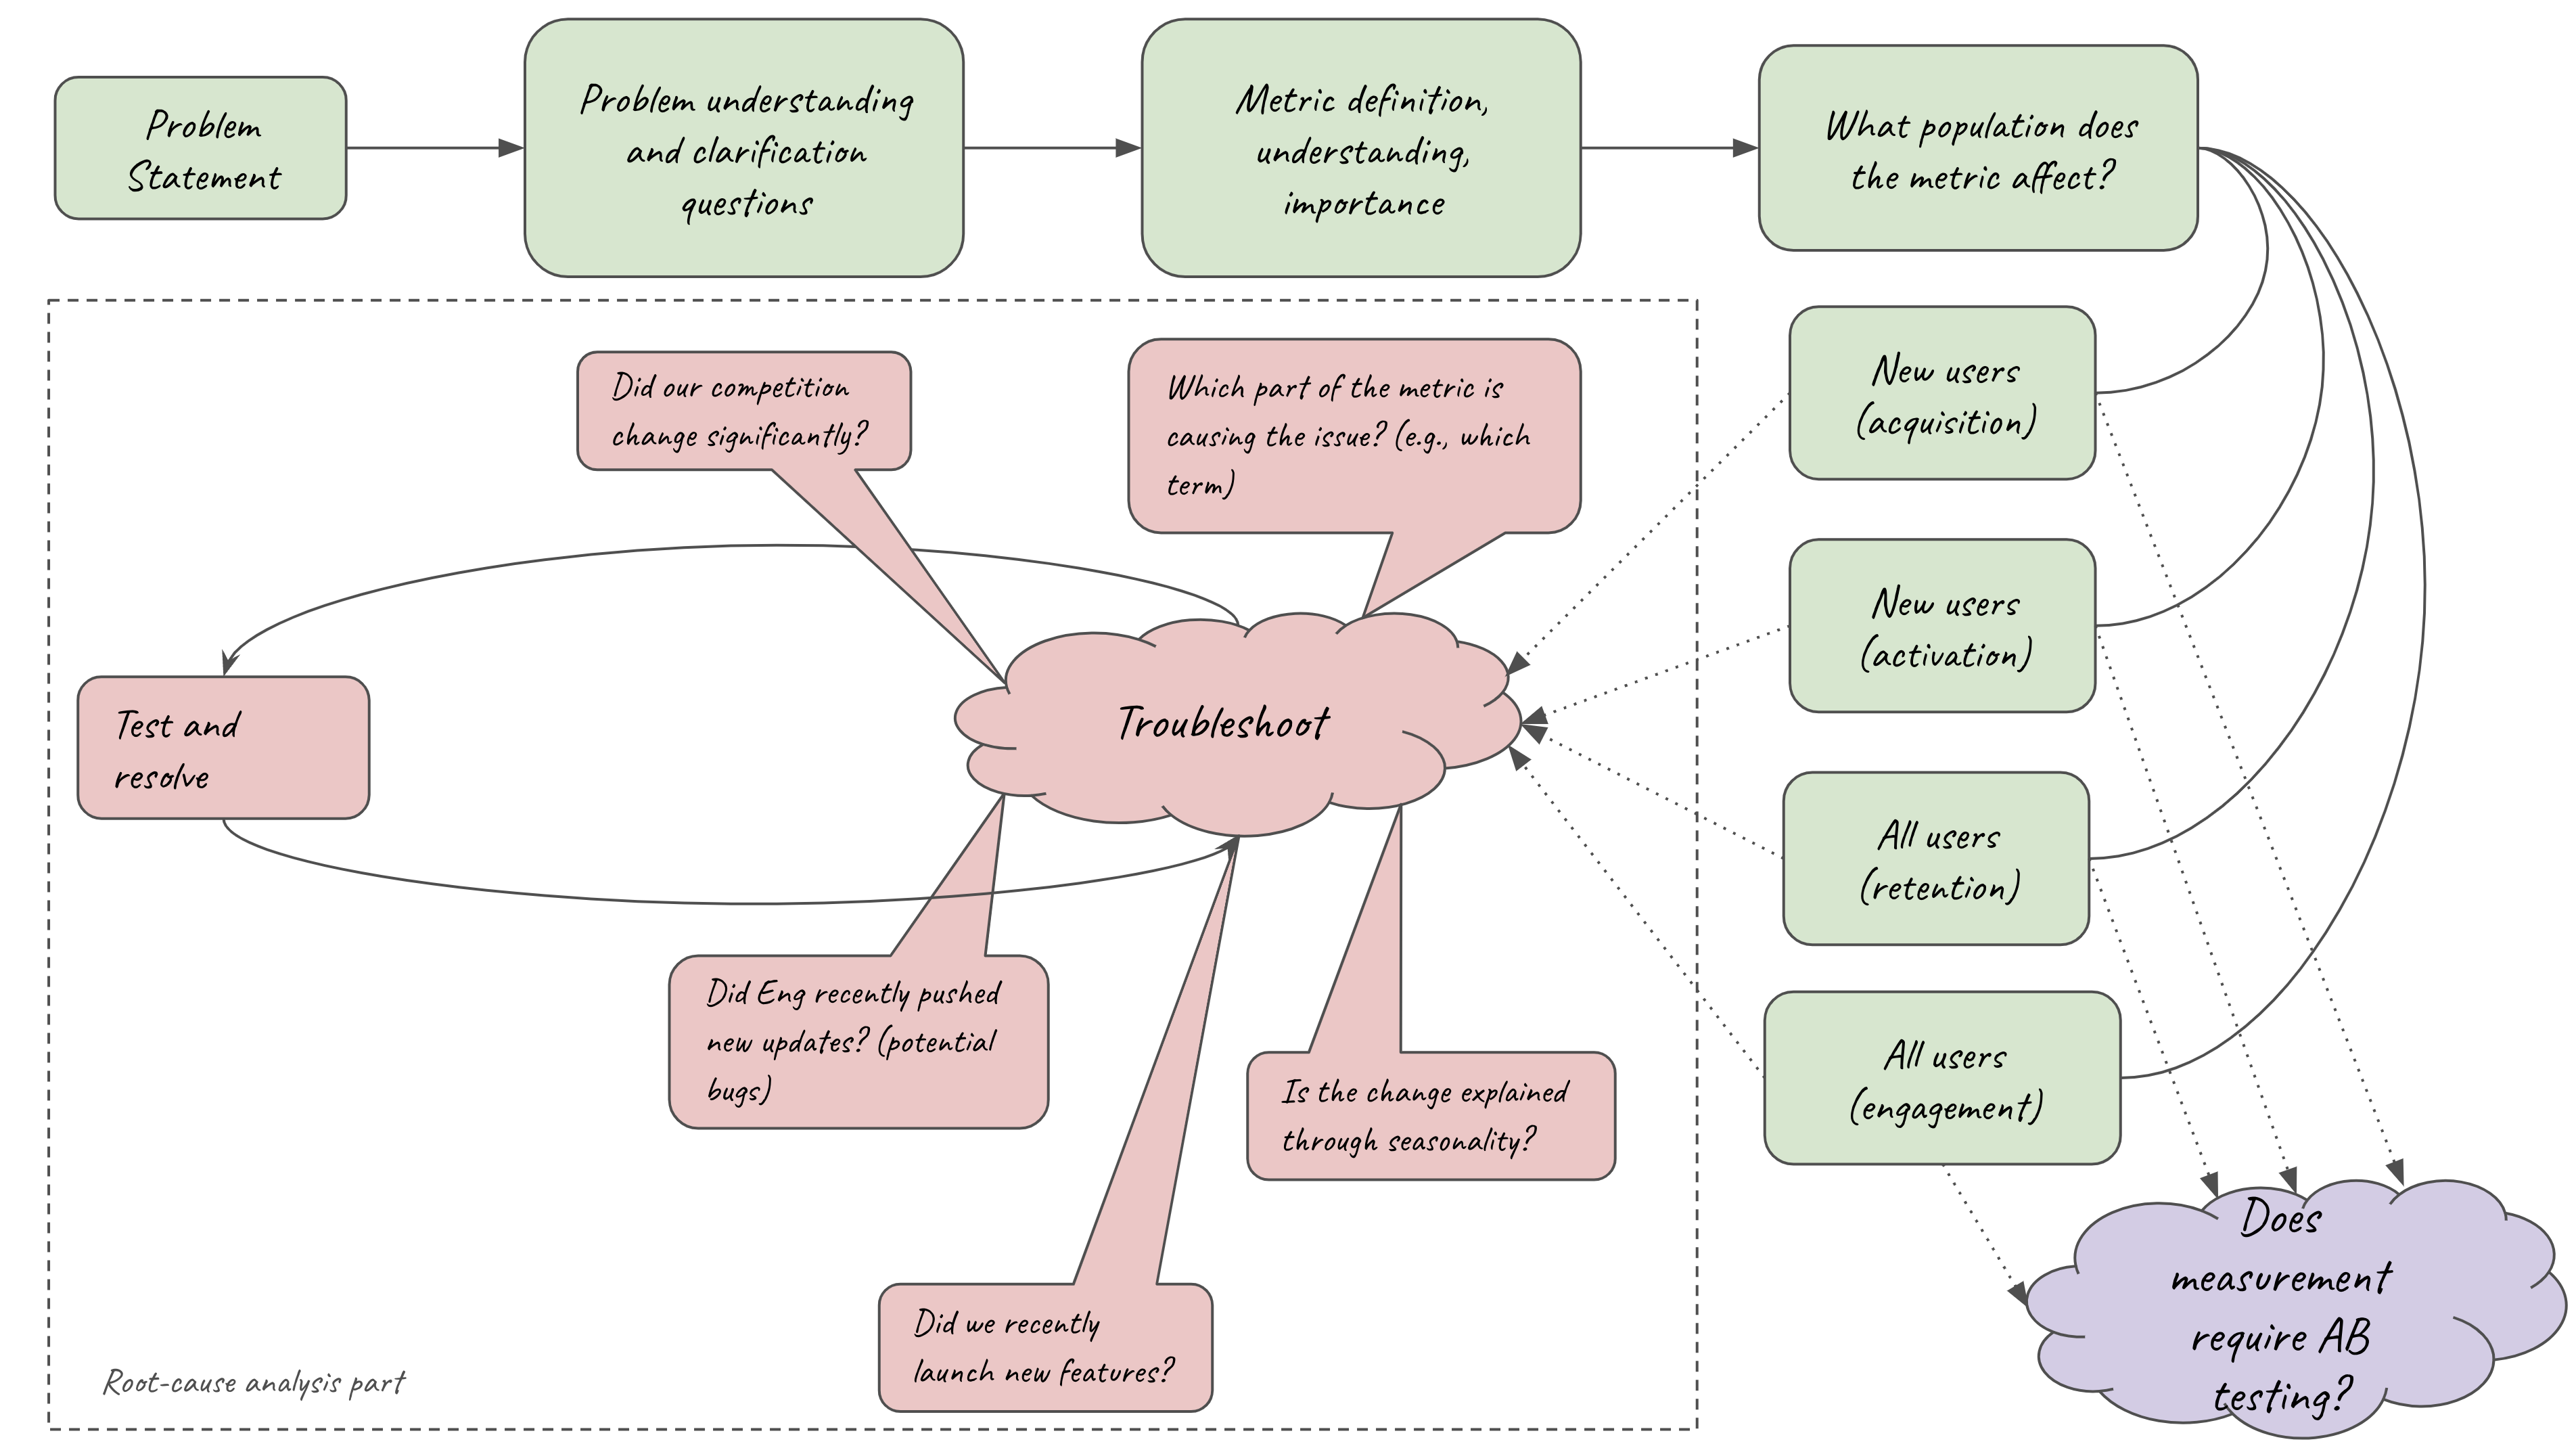
Let’s briefly discuss each component:
Problem Statement: This is the initial description of the problem. Generally speaking, there are two types of problems that involve metrics:
- Measure something for the first time (e.g., How would you measure the revenue impact of reliability efforts?). This type of problem might sometimes require a deep discussion on A/B testing, i.e., the topics of Chapter 3.
- Identify (root cause) why a particular metric has recently changed (typically something has gone bad, and needs to be fixed)
Problem understanding: This is the part where you get to engage (with) your interviewer. Ask questions that are meaningful. Be creative, identify the boundary conditions of the problem, and try to gauge where the interviewer wants you to go (you might even specifically ask the interviewer if they are more interested in talking about A vs. B etc.). Just make sure that after this step, you have a good understanding of the problem.
Metric definition: Depending on your problem:
- If your problem requires you to define new metrics, this is the time to do it. Make sure you define metrics with good characteristics (e.g., representative, measurable in the short term, etc). Don’t forget to define guardrail metrics on top of your north star, goal metrics.
- If your problem focuses on root-cause analysis, try to better understand what goes into the metric of interest (i.e., the terms of the formula). If the metric does not seem correct, bring it up to the interviewer, and the interviewer will guide you on whether or not to ignore that part and focus on the root-causing part.
Population: It is important to understand which population your metric affects – especially if you are required to do root-cause analysis. If your proposed metric does not correctly capture your desired population, you should revisit its definition.
AB test: If your question focuses on AB testing, now is the time to describe how would you design an experimental framework that would ensure that your metric is correct (e.g., to test your formulaic assumptions of how reliability improvements translate to revenue)
Root-cause analysis: More commonly, you will be asked to analyze what went wrong. The framework proposes several reasons of why a metric might have moved. You can suggest all these reasons (and more) if they are reasonable to your interviewer, and your interviewer will guide you on which way to move forward. Once you have a hypothesis of what went wrong, you will be asked to test whether your hypothesis is correct. Sometimes this might include purely checking code, others might include offline data analysis, and sometimes, you might need to run experiments to test whether your hypothesis is correct – it really depends on the problem and the interviewer.
My goal with the above diagram is to give you a guideline to tackle these questions. Hopefully, it will be useful.
6.1 Sudden drop in user engagement
Question: Assume that you are working on a platform that supports a Q & A forum (like Reddit). You notice that suddenly user engagement has dropped. Did something happen?
Answer: We will solve this problem step by step, following the root-cause path of this diagram:

Problem statement: We need to figure out if something has gone wrong that caused engagement to drop.
Problem understanding: Let’s see some example clarification questions we could ask on this problem:
Q: Is it rational to assume that we measure user engagement through some version of Daily Active Users, or should I assume we use something a bit more sophisticated such as the number of posts, likes, etc?
A: You can assume that we track we use a weighted sum of posts, replies, likes, and views.
Q: Measuring this daily might be a very high variance, should I assume that we smooth this over a specific window, say weekly?
A: Yes, you can assume that we monitor weekly averages.
Q: How much did this metric move?
A: Let’s assume that the metric moved 3 standard deviations
Q: Is this metric really important?
A: Internally, we know that a drop of 1 standard deviation of engagement maps to a 2% drop in Ads revenue.
We can keep asking questions but let’s assume that we now have a good understanding of what the interviewer is asking: We need to figure out what went wrong given that 3 standard deviations of change are costing a ton of revenue to the platform.
Metric definition: For this problem, we will use the engagement metric that the interviewer has given us.
Population: Now we can start digging into specifics:
- Q: Is this drop in engagement homogeneous across all users or does it affect any particular population in particular?
- A: Let’s assume that we don’t have any specific information on the type of users that it affects yet. How would you go about it?
- Q: We could break down the population into different cohorts, e.g., new users, tenured users, users across different geographic areas, and different age groups, and see whether this change originates from a particular cohort. Should we assume that indeed one of these cohorts is the problem?
- A: Let’s assume that you run the above analysis, and you find that the drop can be explained only through a drop in new user engagement.
Troubleshoot: We already know that the problem is with new users. The engagement equation involves posts, likes, and responses.
Q: Is the drop in all three components of the engagement? Or is it coming from only some of them?
A: Let’s assume that after looking into the data, we see that the number of posts of new users did not go down, however, there is a drop in likes and responses.
Q: If this is the case, then did something change in the way that new users interact with existing threads?
A: How would you test this?
Q: I would look into any recent product changes that affected the ability of new users to like or respond. One quick and easy test is to see whether the number of likes/responses of new users went to zero.
A: Let’s assume that it is not exactly zero.
Q: How about the correlation between posts and likes/responses?
A: After looking into that, we see that likes and responses are coming only from new users who have made new posts. What does this tell you?
Q: Maybe there was a recent code push that had a bug and restricted the ability of new users to like/respond unless they were first posting a new thread?
A: Exactly!
6.2 Measuring counterfactual impact
Question: Assume that you are working in Ads, where model freshness is particularly important as new information significantly improves the performance of your models. Assume that your company deploys 100s of ML Ad models. The Eng ranking team decides to constantly (e.g., every hour) update all models with new data snapshots.
Despite the overall positive effects of this decision, on-call events more than doubled: more often than ever ML models break and engineers need to figure out what went wrong, causing extensive delays and Eng human hours of work.
Your Eng director comes up with a solution to this issue: They build a meta-predictive framework that rejects data snapshots that are likely to cause on-call events (i.e., it does not allow certain model versions to go into production if their performance during a short testing period is not within some pre-defined range).
As the genius data scientist of the team, you are tasked to measure the impact of this meta-predictive framework. How would you do it? How would you test whether your metrics are accurate?
Answer: We will solve this problem step by step, following the green path of this diagram:
Problem statement: We need to measure the impact of this meta-predictive framework. The framework in simple terms prevents bad models to go into production.
Problem understanding: Let’s see some example clarification questions we could ask on this problem:
Q: How many models are being filtered through this model every hour?
A: You can assume that every hour roughly 1000 models are being filtered.
Q: What percentage of these models are being filtered out?
A: Right now, you can assume that the model filters out roughly 10% of models.
Q: What is the precision and the recall of the system?
A: For simplicity, you can assume that the system has
recall=1andprecision=0.1Q: Is it rational to assume that in order to filter out these models we introduce an additional delay in pushing models to production? How long does it take for each model to be tested and then potentially be filtered out?
A: It takes roughly 10 minutes for each model to be tested.
Q: In this case, is it rational to assume that our measurement should include some sort of revenue loss due to this additional delay that the filter introduces?
A: Correct, this is a trade-off you will need to take into account.
We can keep asking questions but let’s assume that we now have a good understanding of what the interviewer is asking: We need to figure out a way to measure the counterfactual impact of this system that on one hand prevents bad models from going into production (i.e., models that would have cost revenue loss), and on the other hand, introduces delays that cost money.
Metric definition: Now that we have a good understanding of the problem, how could we measure the impact of this system? When filtered models are true positives (i.e., they will end up breaking and cause on-call events) the system saves revenue losses. On average, we can assume that:
\[ \text{Revenue savings} = \Pr(\text{filtered and positive}) * \text{Expected cost of positive} \]
On the other hand, when the model introduces a fixed delay cost by delaying all models to reach production by 10 minutes:
\[ \text{Fixed delay cost} = 10 * \text{Expected revenue increase of a new model per minute} \] Finally, the model introduces an unnecessary delay of roughly an hour when a good model gets filtered out (i.e., False positives)
\[ \begin{align} \text{False Positives delay cost} &= \Pr(\text{filtered and positive}) \\ &* \text{Expected revenue increase of a new model per hour} \end{align} \]
As a result, the total impact of the system will be:
\[ \text{Total impact} \propto \text{Revenue savings} - \text{Fixed delay cost} - \text{False Positives delay cost} \]
- AB test: If you note, in our metric definition, there are several counterfactual components:
- We never observe the actual delay cost since those models never reach production
- We never observe the actual revenue increase that we have missed since these models never reach production
- We never observe the actual cost of an on-call event since the true positives never reach production.
- Then how do we know that our estimates are correct? In practice, we don’t. In theory, we could design an AB test that evaluates the whole system – in practice, the necessary sample size might be too big or the cost of allowing faulty models to go into production extremely high for a director to approve such an A/B test. Perhaps, the best thing we can do is to run AB tests of different versions of models and keep recalculating the expected revenue boost from each new model…
This is one way that you can solve this problem, but there are potentially several others.
You might think that the above question is extreme as it focuses on a niche topic. This might be true, however questions that focus on counterfactual impact are very common.
6.3 Additional Questions
The following metrics questions are included in the complete book that defines the bar for product data science:
| Question | Topics |
|---|---|
| Types of metrics | Types of metrics |
| Characteristics of metrics | Characteristics of metrics |