A.2 Course objectives: what is this course for?
A.2.1 The big picture
Well, here we are in an elective, which means the course material is basically “whatever I decide is a good idea.” So let’s start with the Big Picture. The goal is that at the end of this course you will be able to:
- Apply some core time series methods to new data
- Understand when and whether that’s a good idea
- Work with a boss or colleague to learn and use new time series methods
That third point is really important! Like basically any statistics elective, this course can’t possibly hope to turn you into an expert on the topic. People spend their lives doing time series. The point of this course is to show you some of the common tools of the field, and set you up for learning what you need to know later.
That’s partly about getting a first look at advanced topics, but it’s just as much about building up your statistical communication skills – being able to talk about what you know and don’t know, and relate what someone is telling you to what you’ve already learned.
To this end, the learning goals in this course come in two types or flavors: concepts and skills.
- Concepts are building blocks; you’ll assess your understanding of these in Assessments. This isn’t a theory course, so we won’t spend a lot of time on proofs or asymptotics. The key is that you understand how, why, and when methods work – which also gives you the foundation to learn about new methods later in life.
- Skills are about applying techniques: using real data, actually generating forecasts and analyses, interpreting what they tell you. You’ll demonstrate your skills on a series of projects throughout the semester.
You’ll also build your communication skills by interacting with your classmates (and me!) throughout the semester, both formally and informally. That’s reflected in engagement credits, which you earn by participating in the “class conversation” in different ways.
A.2.2 Specific objectives
There are 22 total learning goals in the course, including 12 concepts and 10 skills. The concepts are grouped into 6 modules or segments of the course. Each module has its own matching Assessment (though of course later modules build on the ideas from earlier ones!). You can see the list of modules below; you’ll get more details about what each one involves as we get closer to it.
Modules:
- Time series plots and descriptives
- TS decomposition
- Regression and forecasting
- ETS and state space models
- ARIMA models (and friends)
- Spectral analysis
There are four course projects, two smaller ones and two larger ones:
- TS descriptives (aka The Little Analysis)
- New topic 1 (aka The Little New Thing)
- New topic 2 (aka The Big New Thing)
- Comparative TS analysis (aka The Big Analysis)
Let me take this moment, though, to remind you that I’m neither omniscient nor omnipotent. Things might change :)
For those of you who like the big picture, here is the tentative list of learning goals for the whole course:
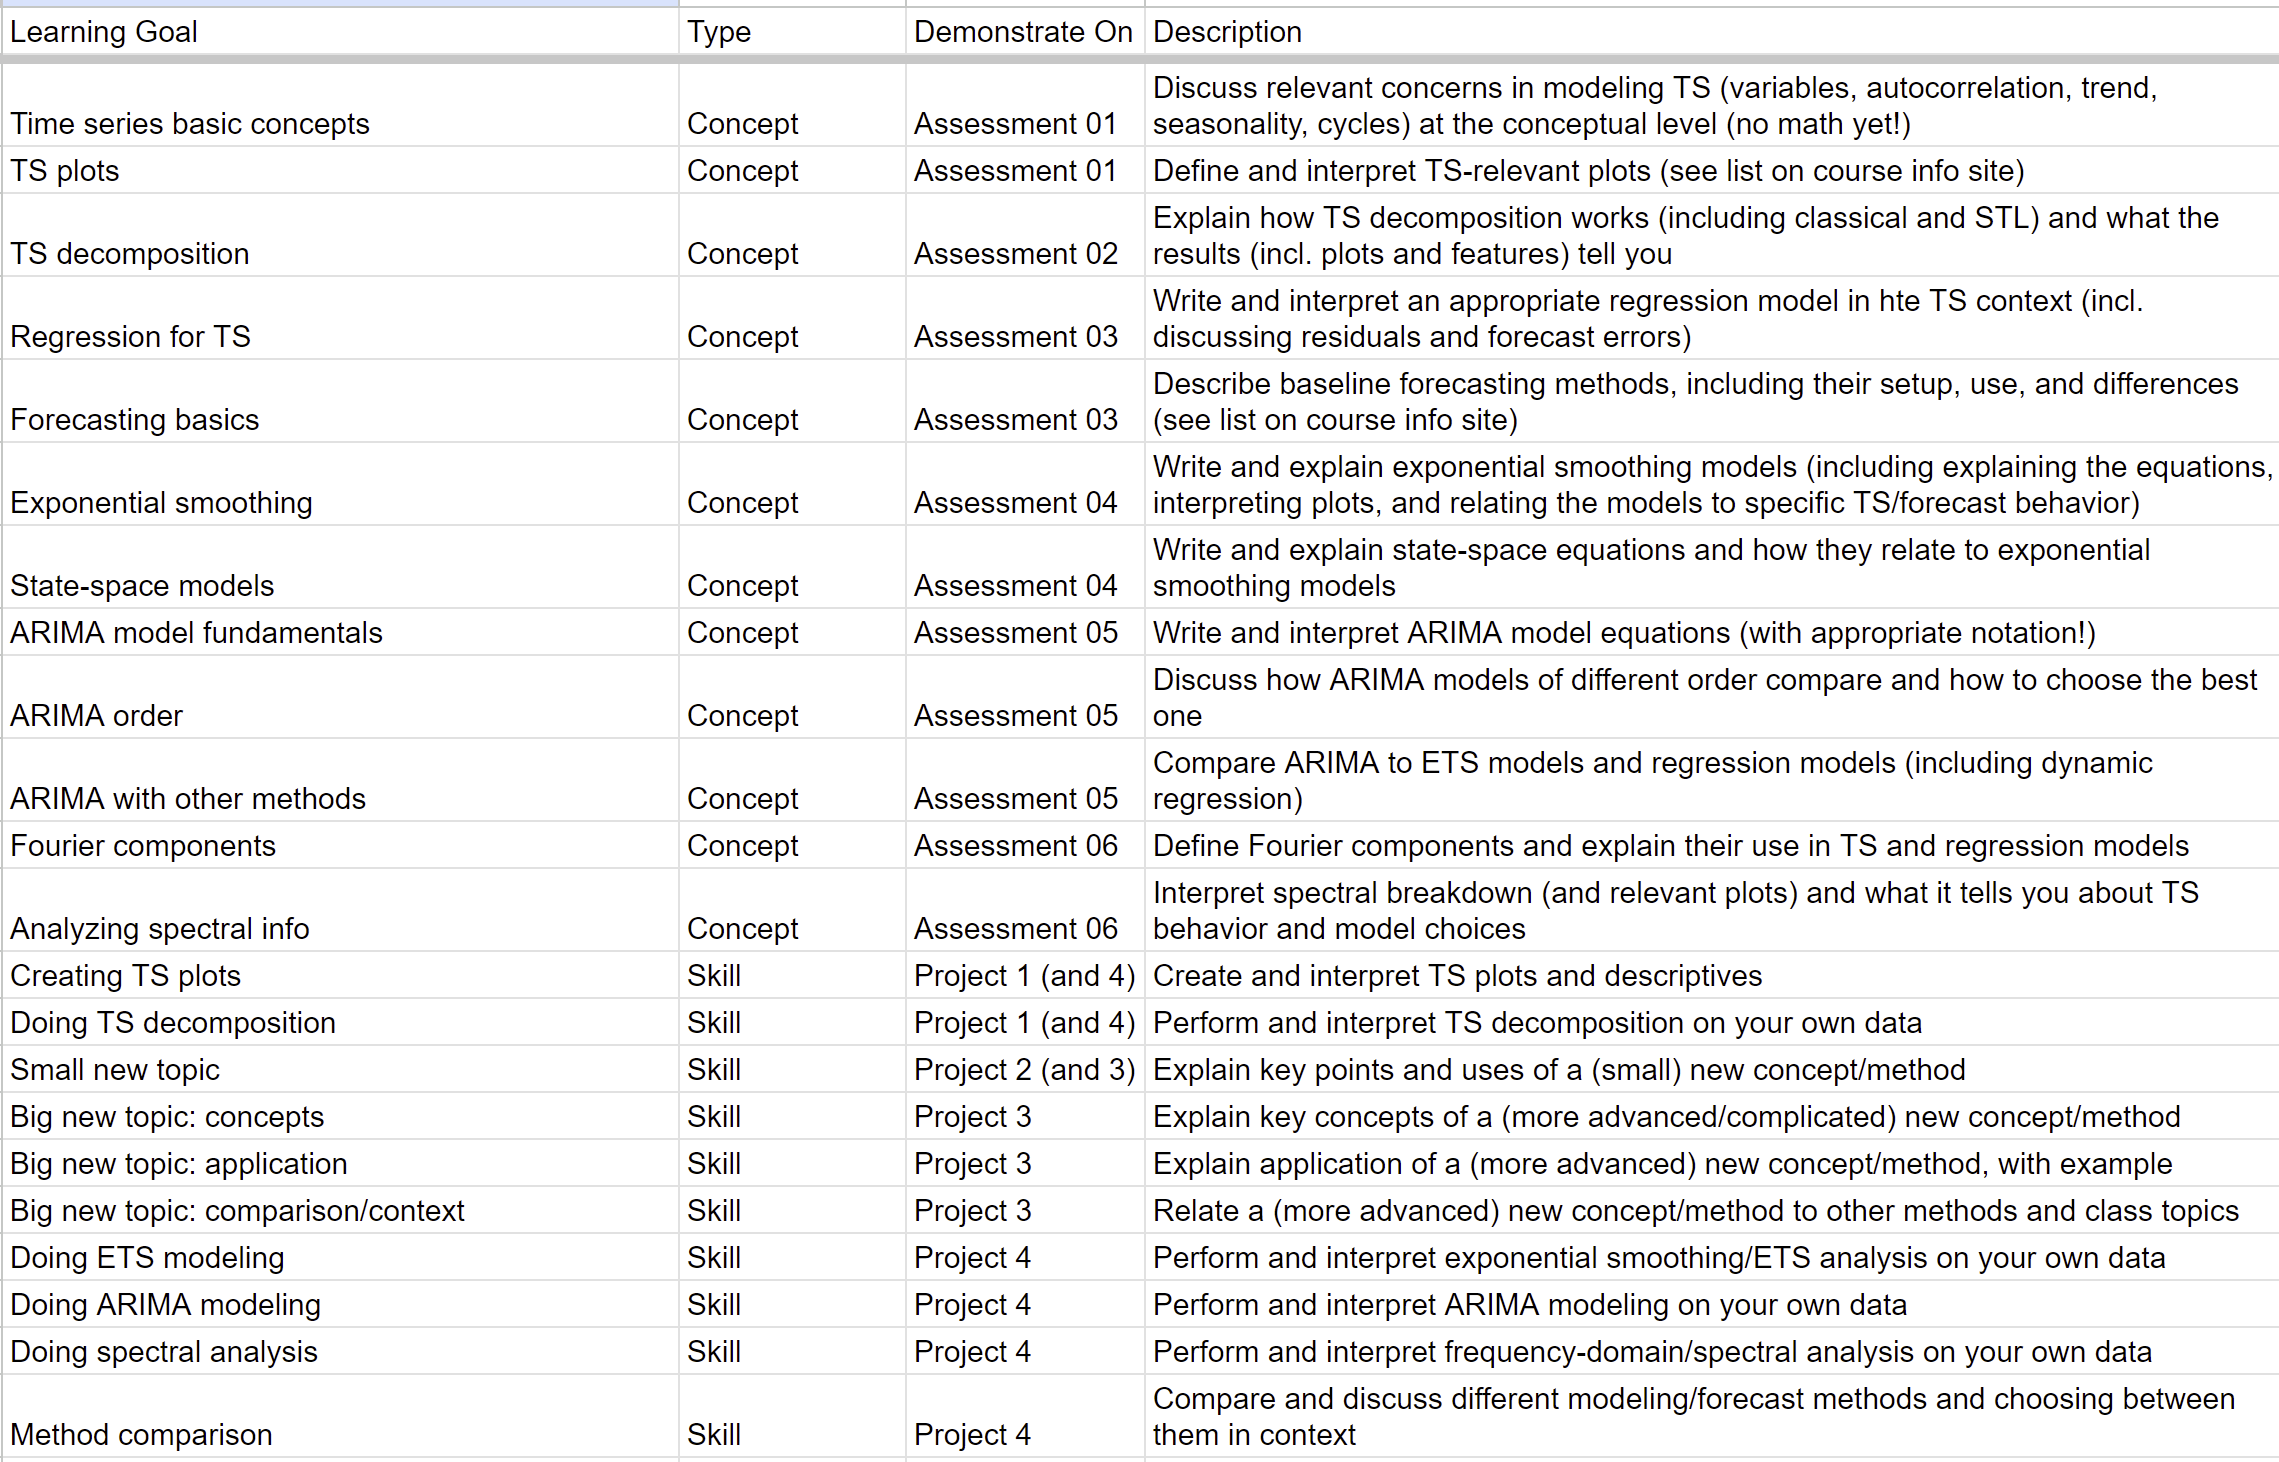
Like all forecasts, this is uncertain! While the total number of learning goals is fixed, I may adjust what exactly is covered in each one or how they are batched across modules. Consider this a general overview of the content :)