RColorBrewer and Barplots
An additional package for coloring plots is the RColorBrewer package. We first need to require the RColorBrewer package to be loaded, which the line below accomplishes. The image that follows displays the color options from RColorBrewer. Note there are individual colors but also spectrums that might be used to some demonstrate patterns in data. You can find more information on RColorBrewer in the documentation here.
require(RColorBrewer)## Loading required package: RColorBrewer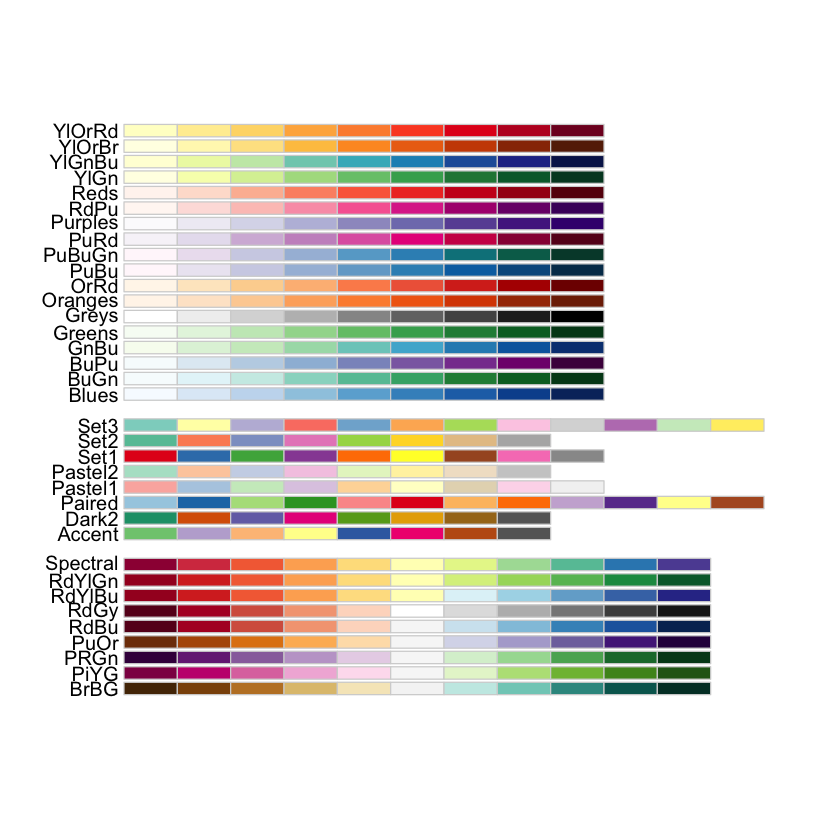
Now, we can just call these colors with the cols brewer.pal command. For example, let’s create a plot with five bars colored purple. We will attach some names to the bars just for fun. Here, the brewer.pal command takes arguments specifying the number of bars that we need to color (5), and the colors that we would like to use (Purples).
bars <- c(4, 3, 5, 4.5, 5.1)
labels <-  c('Anthrax', 'DRI', 'DOA', 'BIOHAZARD', 'Withstand')
barplot(bars, names.arg = labels, col = brewer.pal(5, name = "Purples"))
Practice
The following exercises are meant to let you explore the barplot and RColorBrewer functionality and get used to working in RStudio. You should familiarize yourself with the help functionality in RStudio as a way to examine some additional functionality within the barplot function. Use the help in combination with the above information to generate the following barplots. All of your plots should contain a title, bar labels on axis, and value lables on bars.
A Barplot of 6 different colors of from the standard R palette.
A barplot of 7 diverging values from the RColorBrewer palette.
A barplot with 5 bars displaying a spectrum of colors from RColorBrewer.