Chapter 5 Results
5.1 Descriptive statistics for the engagement measures
First, descriptive statistics for the five engagement variables that were used to estimate the profiles are presented in Table 4.1. These descriptive statistics show high overall levels of cognitive (M = 2.768, SD = 1.063), behavioral (M = 2.863, SD = 1.044) and affective (M = 2.831, SD = 1.051) engagement.
These statistics also show high perceptions of competence (M = 3.000 (SD = 0.952)) and moderate perceptions of challenge (M = 2.270 (SD = 1.117)). There was a similar degree of (moderate) variability across the engagement measures (see the SDs): This variability may be due to the youth, instructional episode, program, and even for unexplained reasons.
5.2 Correlations among the study variables
Correlations between the variables that were used to create the profiles of engagement and the one other variable which was continuous (rather than a code for groups, in particular youths’ gender and URM status), pre-program interest in STEM (Table 4.2), were specified. In addition, relations between these variables and those for the five aspects of work with data were identified. Note that because the five variables were dichotomous, Spearman (rather than Pearson) correlations were also specified but were nearly identical, and only the Pearson correlations are reported. The correlations among the variables used to create the profiles and pre-interest, which range from r = .08 through r = .60 (all statistically significant), represent low to moderate relations among these variables. The relations among the aspects of work with data, which ranged from r = .19 to r = .50 (also all statistically significant), also represented moderate relations among these variables. Relations between the variables used to create the profiles as well as pre-interest and the aspects of work with data were less noteworthy. For pre-interest and the aspects of work with data, the values ranged from r = -.10 to r = .11 (with only the r value of .11 being statistically significant) representing small relations. For the variables used to create the profiles and the aspects of work with data, the values ranged from r = -.06 to r = .03, with only a few of the negative relations (those with r values of -.05 and -.06) being statistically significant.
5.3 Results for Research Question #1
5.3.1 Frequency of the aspects of work with data
Of the 236 instructional episodes used in the analysis, 170 (72%) were coded as involving one or more of the five aspects of work with data. As a reminder, the instructional episode refers to the ten-minute block of time immediately preceding an ESM signal. As presented in Table 4.3, the five aspects of work with data occurred regularly. Making observations was found to be the least frequent of the five aspects, occurring in 24% of instructional episodes. Data modeling was the next most frequent aspect, occurring in 29% of the episodes, followed by asking questions (38%), generating data (43%), and communicating findings (again 43%).
As suggested by the proportions reported in Table 4.3, the different aspects of work with data often co-occurred within a single instructional episode. On average, there were 1.86 (SD = 1.61) aspects of work with data present during each instructional episode. This value indicates that, on average, youth were engaged in around two of aspects of the work with data during each instructional episode. There was a considerable amount of variation in the extent to which these types of work with data were supported in each program. The frequencies by the program are presented in Appendix B.
| Aspect of Work with Data | Proportion of Instructional Episodes | N |
|---|---|---|
| Asking Questions | 0.381 | 90 |
| Making Observations | 0.242 | 57 |
| Generating Data | 0.432 | 102 |
| Data Modeling | 0.288 | 68 |
| Communicating Findings | 0.436 | 103 |
5.3.2 The nature of work with data
The open-ended, qualitative approach used to understand the specific nature of youths’ work with data showed the variety of ways each of the five aspects was enacted in the context of the programs.
5.3.2.1 Asking questions or identifying problems
Among the instructional episodes that involved asking questions, qualitative descriptions revealed that around one-third (39/90, or 43%) involved youth working to understand the phenomenon or problem they were investigating. When doing so, youth were focused on actively constructing predictions and hypotheses about phenomena. For example, in an instructional episode during the Ecosphere program in which youth constructed inclined tables to study how water moved throughout the ecosystem, the youth activity leader prompted youth to generate hypotheses of what would happen when water was poured onto the table, before pouring the water.
Other instructional episodes involved questions that were not focused on predicting or hypothesizing, but instead on asking a more general type of question (21/90; 23%), or involved the instructor (but not youth) posing questions or identifying problems (14/90; 15%). In the former case, youth were found to be asking more general questions about understanding the assignment, task, or even the phenomena. For instance, in the Marine Investigators program, youth visited a water treatment site and were provided opportunities to ask questions about what they observed: However, youths’ questions were not questions that could then be answered with empirical data, but were rather to clarify their understanding. In the latter, instructors were asking youth questions (i.e., questions to elicit youths’ conceptual understanding). The remaining (23/90; 25%) episodes represented themes that were not very common or systematic.
5.3.2.2 Making observations
In the instructional episodes when the STEM-PQA revealed that youth were making observations, the vast majority (53/57, 86%) of these were focused on observing phenomena in the field, or, in the case of engineering-focused programs, noticing what was going on with a particular design. For instance, in the Building Mania program, youth constructed Rube Goldberg machines. During this activity, youth were prompted by activity leaders to notice how changes in their design, which they recorded, led to differences in how far objects were launched or rolled.
In a small number of cases making observations were focused on making observations not of phenomena, but of something more general (10/57; 18%). For example, in the Adventures in Mathematics program, youth observed other youth or the activity leader working through a mathematics problem, but not one that youth identified or discussed. The remaining (17/57; 30%) new uncommon or unsystematic.
5.3.2.3 Generating data
In less than half (40/102; 39%) of the episodes that involved generating data, youth were writing down their observations of a phenomenon, recording information from experiments, or recording the results of a trial (in engineering contexts). For example, in the Marine Investigators program, youth collected pieces of recyclable plastic, bringing them back to the classroom and counting them for each location they were collected.
In a minimal number of cases (2/102; 2%), youth collected but did not write down data. For instance, again in Marine Investigators, youth used nets to collect saltwater organisms, which they then transported in buckets back to the classroom setting for subsequent analysis. Very often, and in the other half of episodes (60; 59%) related to this aspect of work with data, how youth generated data were not very systematic or identifiable. This code was present when youth point out the relations between points in a scatter plot figure (which the instructor then translated into an equation) during the Uptown Architecture program. In another instructional episode during the Zoology Partners program, this code was present as youth solved riddles while traveling on a bus to a community site.
5.3.2.4 Data modeling
A majority (37/68, 54%) of the instructional episodes identified as data modeling were focused on youths’ uses and development of statistical and mathematical models. For example, in the Comunidad de Aprendizaje program, youth accessed nationally-representative data and were tasked to solve problems, like finding out what percentage of people engage in particular activities, like donating to charity. In another example, in the Marine Investigators, youth participated in activities designed to help them understand water quality in their ecosystem. Youth collected trash from sites around their community (in different “districts”) and then brought the trash and recyclable plastic back into the classroom. Then, the youth activity leaders involved youth in an ambitious data modeling activity. The aim was to figure out how much plastic enters local waterways. As a part of this activity, youth activity leaders asked youth not only to determine the quantity of trash that entered the waterways but asked youth about why youth thought about and used math in particular ways. For example, youth activity leaders pressed youth to consider how the quantity of trash collected could be extrapolated across the entire city over the course of the year). For example, during Marine Investigators, the youth activity leader.
Other times (4/68; 6%), data modeling occurred through solving equations provided by the youth activity leader, even when related to real-life (as in buying groceries, how money is spent, and how to budget, in Comunidad de Apendizaje). This type of work with data differs from descriptions of data modeling as the equations provided to youth did not often involve modeling variability, a key component of work with data (see section 2.1). Instead, when youth solved equations, there was one often correct answer that the activity leader sought to guide youth to. Additionally, using equations differed from definitions of data modeling because learners were not developing statistical models themselves, a key part of data modeling (Hancock et al., 1992; Lehrer, Kim, & Schauble, 2007; Lehrer, Kim, & Jones, 2011). Using already-created equations may be less engaging than activities that challenge youth to use and develop data models from scratch, work which may be more engaging, especially when youth perceive themselves to be good at such activities (Schneider et al., 2016; Shernoff et al., 2016). During some episodes (6/68; 9%), data modeling involved reasoning about a model based on data with ambiguous origins. In many of these cases, the model was a physical model, such as during the Crazy Machines program, in which youth saw how changes to their Rube Goldberg machine worked or did not work. Such uses were similar to those in which the youth activity leader, rather than the youth (3/68; 4%) used the model (to convey ideas to youth). For instance, in the Marine Investigators program, a youth activity leader used a plush toy seal designed to teach youth about anatomy and the dangers of aquatic mammals consuming trash and recyclables. The remaining data modeling-related episodes (18/68; 26%) were not systematic or very common.
5.3.2.5 Interpreting and communicating findings
In less than one-half (39/103, 38%) of the instructional episodes in which youth were interpreting and communicating findings, youth were sharing what they found from an investigation or the results of using the product they designed. For instance, in the Comunidad de Aprendizaje program, youth participated in an activity designed to support their thinking about creating a product to bring to market; the youth activity leaders described this as being akin to the television show the Shark Tank. In one instructional episode, the youth activity leader asks youth to think of an idea that would make an investor willing to invest in. In this episode, youth shared their ideas, describing what their ideas was, why it was a good idea, how much they could sell it for, and what their profit would be (all while fielding questions from youth activity leaders and their peers). Interpreting and communicating findings was also commonly present in instructional episodes in which youth were debating the findings of an investigation, such as the results of calculations for the number of recyclables entering waterways (in Marine Investigators).
In the other instructional episodes that were not focused on youth sharing what they found from an investigation, youth were most commonly communicating about topics other than the results of an investigation or design process (3/103, 3%). For example, during these episodes, youth tried to find out the answer to a discrete question posed by the youth activity leader or the youth activity leader. In other, episodes focused on interpreting and communicating findings (4/103, 4%), the youth activity leader, and not youth, were communicating the findings of an investigation. For instance, during the Building Mania program, the youth activity leader noted youth struggled to find a business’ profit and loss, and so worked through and shared the results of his problem-solving. In this type of interpreting and communicating findings (the youth activity leader doing the interpreting and communicating), youth commonly engaged in other aspects of work with data (i.e., generating data), but the youth activity leader compiled, modeled, and then interpreted the data that the youth generated, rather than youth doing such activities themselves. The remaining episodes focused on communicating findings (57/103, 55%) were not very systematic or common.
5.4 Results for Research Question #2: What profiles of youth engagement emerge from experiential data collected in the programs?
On the basis of fit statistics and statistical tests (see Table 4.4) and concerns of interpretability and parsimony, a solution with six profiles of engagement was selected. Note that only models associated with the varying means, equal variances, and covariances fixed to 0 specification (referred to as the “model 1 type”) and the varying means, equal variances, and equal covariances (referred to as the “model 2 type”) converged, and so only solutions associated with these two model specifications were considered.
For solutions associated with model 1, the decrease (indicating a preferred model) in the information criteria (AIC, BIC, SABIC) becomes smaller as the number of profiles increases from 5 to 6 and 6 to 7. The BLRT suggests that, until the log-likelihood is not replicated, every more complex model be selected. The six and seven profile solutions are compelling because both show profiles that are distinguished by dimensions of engagement and its conditions (challenge and competence) and have lower values on the information criteria than the solutions with fewer profiles. For solutions associated with model 2, only those associated with 2-5 profile solutions were associated with log-likelihoods that were replicated. For these four models, the log-likelihood decreased in a mostly consistent way, such that changes in the decrease are not as evident as those associated with model 1. The BLRT suggest that the more complex model be selected and so did not provide clear information about which solutions are to be preferred. Taken this information into consideration, either a model one type, six profile solution or a model one type, seven profile solution was found to be most reasonable. The seven profile solution, described in Appendix D, was used for the analyses for research questions 4 and 5. The results from these analyses were comparable to those for the six profile solution, and so the six profile solution was chosen on the basis of parsimony and its greater interpretability.
The result of this model selection process was the estimation of six distinct profiles identified from the data, as presented in Figures 4.1 and 4.2. Figure 4.1 shows the profiles with variables that were centered to have a mean of 0 and a standard deviation of 1. Thus, the y-axis for this plot is labeled “Z-score”). Figure 4.2 shows the profiles with the raw data (not transformed). Thus, the y-axis for this plot is labeled “Value.” This solution represents the profiles of engagement identified to answer this research question and for use in subsequent analyses.
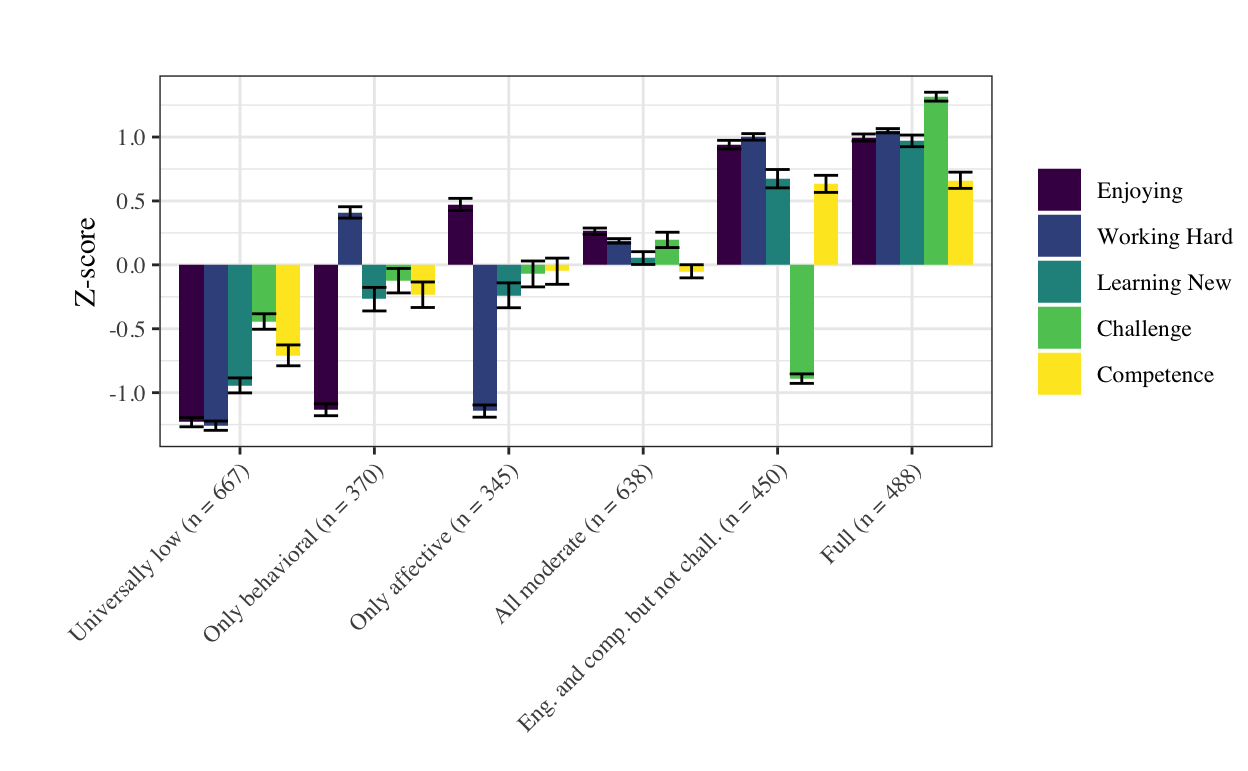
Figure 5.1: The six profiles of engagement (with variable values standardized)
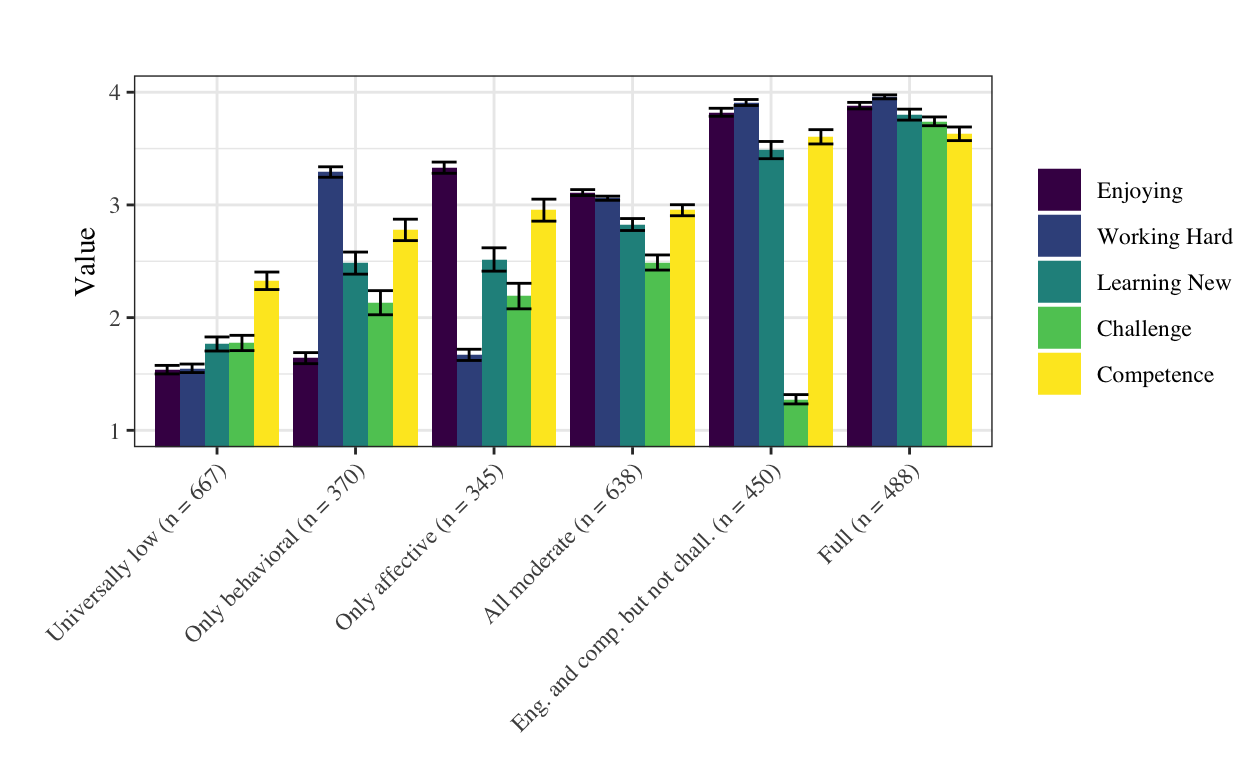
Figure 5.2: The six profiles of engagement (with raw variable values)
The two plots are presented because they provide a different view into the composition of the profiles: Those with the centered variables highlights positive and negative departures from the mean value for each variable, making differences between the profiles distinct. The plot with the raw data instead highlights the reported values of the variables, emphasizing the values of the variables in the profiles in the same units that youth were asked to consider when they responded (and potentially highlighting similarities that may seem very different in the plot with the centered data).
The six profiles are characterized by both varying levels on both the indicators of engagement (cognitive, behavioral, and affective) and perceptions of challenge and competence. Also, the number of observations across the profiles is relatively balanced (with no profiles associated with a very large or small number of observations). The universally low profile was associated with the most substantial number of observations (n = 667), followed by the all moderate profile (n = 638); each of the other four profiles was associated with 300 to 400 observations. The results for research questions 3-5 use this solution and the six profiles in subsequent analyses.
A MANOVA was carried out to determine whether the values of variables differ across the profiles, with multiple ANOVAs used to determine which variables (and for which profiles) there were differences. Note that for the profiles (and their presentation in Figures 4.2 and 4.3 and Table 4.5), each response is associated with the probability of profile membership at a particular moment. Because, across all responses, the highest probability for each response was on average quite high (the entropy statistic was .888), the probability was appropriate to use to classify each response into one profile. These classifications were subsequently used to calculate the number and percentage of responses in each profile. They were also used for the analyses comparing the mean levels of each variable across profiles (with a MANOVA and with the follow-up ANOVAs).
The MANOVA was statistically significant (Pillai-Bartlett = 0.633, p < .001). The table with the raw values, with subscripts indicating values the mean values that were not statistically significantly different is presented in Table 4.5. Note that the F-test associated each ANOVA was also statistically significant. Descriptions of each the profiles taking account of their size (in terms of the number of responses for which the profile was most likely), their variable values, and what the profiles suggest about youth engagement follow.
A universally low profile consisted of a substantial proportion of responses (22.55%) was identified. This profile was characterized by low levels of working hard, learning something new, and enjoying the activity, and perceptions challenge and competence. For responses in this profile, mean values were lower than their values in every other profile for every variable except challenge, which was even lower in the *engaged and competent but not challenged profile. Note that concerning their raw values and not only their levels relative to the levels of the variables for the other profiles, youth report very low levels (below two on the one-four scale used) of all of the variables. In all, this profile reflects very low levels of youth engagement during the specific instructional episodes during which youth were signaled to respond.
An only behaviorally engaged profile with a small proportion of responses (12.51%) was identified. This profile was characterized by moderate levels of working hard, very low enjoyment of the activity, and moderate levels of learning something new and challenge and competence. The levels of reporting learning something new, challenge, and competence were not distinguishable from those found in the responses that make up the only affectively engaged profiles. Levels of working hard, an indicator of behavioral engagement, was higher than in every profile except fully engaged and engaged and competent but not challenged. These responses suggest that youth perceive themselves to be working hard, but to not be enjoying what they were doing and to not report learning something new, nor to be particularly challenged or good at what they were doing when signaled.
An only affectively engaged profile with a small proportion of responses (11.66%) was identified. This profile was characterized by moderate levels of enjoyment, low levels of hard work, and moderate levels of learning something new, challenge, and competence. Levels of competence were the same as in the all moderate profile. Youths’ reports of enjoying what they were doing at the time they were signaled, an indicator of affective engagement, was higher than in every profile except fully engaged and engaged and competent but not challenged. When youth report this response, they enjoy what they were doing, but were not working hard or learning something new, nor do youth report being challenged by or good at the activity they were doing.
An all moderate profile with a large proportion of responses (21.57%) was identified. This profile was characterized by moderate levels of the three indicators of working hard, learning something new, enjoying the activity, challenge, and competence. Levels of all of the variables were, on average, lower for the responses that make up this profile than among the responses associated with the engaged and competent but not challenged nor the full engagement but were still quite high on the one-four scale used. In sum, for youth reporting all moderate engagement were engaged, but may have the potential to be more highly engaged (and challenged by and good at the activity).
An engaged and competent but not challenged profile with a modest proportion of responses was identified (15.21%). This profile was characterized by high levels of working hard, learning something new, enjoying the activity, and competence, but low levels of challenge. Levels of competence, enjoying, and working hard were identical between the responses associated with this profile and the responses associated with the fully engaged profile, while levels of challenge were very low: levels of challenge for these responses were lower than those for every other profile. Levels of learning something new were slightly lower than those in the responses that make up the fully engaged profile but were higher than their levels in the other four profiles. This profile suggests youth can be highly engaged, while not being challenged by the activity they were involved in at the time they were signaled.
A full profile with a modest proportion of responses (16.50%) was identified. This profile was characterized by high levels of working hard, learning something new, enjoying the activity, challenge, and competence. These responses reflect a very high level of engagement, both relative to the other profiles and in absolute terms: All of the mean levels were above 3.50, and, for working hard, youths’ responses averaged 3.96 on a one-four scale. Thus, when youth report engagement in ways that were associated with this profile, they report being challenged and good at what they were doing and, on the basis of these variables and the indicators of engagement, youth very highly engaged.
5.5 Results for Research Question #3: What sources of variability were there for the profiles of engagement?
For all six profiles, the ICCs (for the model with only the youth, instructional episode, and program levels themselves, but not variables at the levels) represent the systematic variability (the proportion of variance explained) associated with each of the levels for each profile. Thus, the different levels can have different proportions of variance explained for different profiles, as presented in Table 4.6. The systematic variability at the youth level, for example, could be .10 for the Full profile and .025 for the Universally Low profile. At the program level, the ICCs were found to be small, with values ranging from 0.00 to 0.023, suggesting that little variability can be explained by the program. For the instructional episode level, the ICCs were also small, ranging from 0.004 to 0.01. Finally, at the youth level, the ICCs ranged from .093 to .432.
In terms of ICCs at youth level across the six profiles, the value for the youth-level ICC was highest for the Full profile (ICC = .432), suggesting that some youth have a strong tendency to be fully engaged (possibly due to their initial interest or other individual characteristics and differences). The other profile characterized by a consistent pattern across all of the variables–the Universally low profile–had a modest value for the ICC at the youth level (ICC = .267). Finally, a significant amount of variability is associated with the residual (variance that was not associated with the program, instructional episode, or youth levels). This suggests that there is wide variation in youths’ responses that may not be readily explained or predicted by variables at one level alone. Remaining unexplained variability was captured by the residual term. Some youth from particular programs may engage during some episode instructional episodes in very high or low ways that were not captured by modeling the variability at each of these levels alone.
The ICCs lend insight into the sources of variability for a specific profile; within-youth stability in terms of how frequently they reported particular profiles could lend further insight by considering variability across profiles. This analysis can be particularly useful for understanding variability at the youth level, which the ICCs show to be associated with the most systematic variability. Each youth has a most-frequently reported profile. Results show that for some youth, the profile was very dominant, occurring in a substantial proportion of youths’ responses; for others, it occurs not that frequently, meaning that youth report a variety of different profiles.
As presented in Figure 4.3, the mean proportion of responses for each youth in the profile they reported most varied widely across youth. Specifically, on average, youth reported their most-reported profile in .540 (SD = .194, min = .182, max = 1.00) of their responses. There was a small number of youth who reported the same profile in all of their responses, but for most youth, the profile they reported most made up only a portion of all of their responses. For most youth, the most common profile was observed just over 50% of the time. Instructional episodes that involved work with data were compared to those without work with data. Like for the other models, these models were specified with the dependent variable as the probability of a response being associated with a profile for each of the six profiles. However, there was no difference in terms of the regression (\(\beta\)) coefficients associated with this variable for any of the six profiles.
In sum, these findings show that there was substantial variability in the profiles present at the youth level. Less variability was explained by either the program youth were in or the nature of the particular instructional episode present when youth were signaled. These results set the stage for those for the next two research questions, on the relations between the aspects of work with data (for research question #4) and the youth characteristics (for research question #5) and the profiles of engagement.
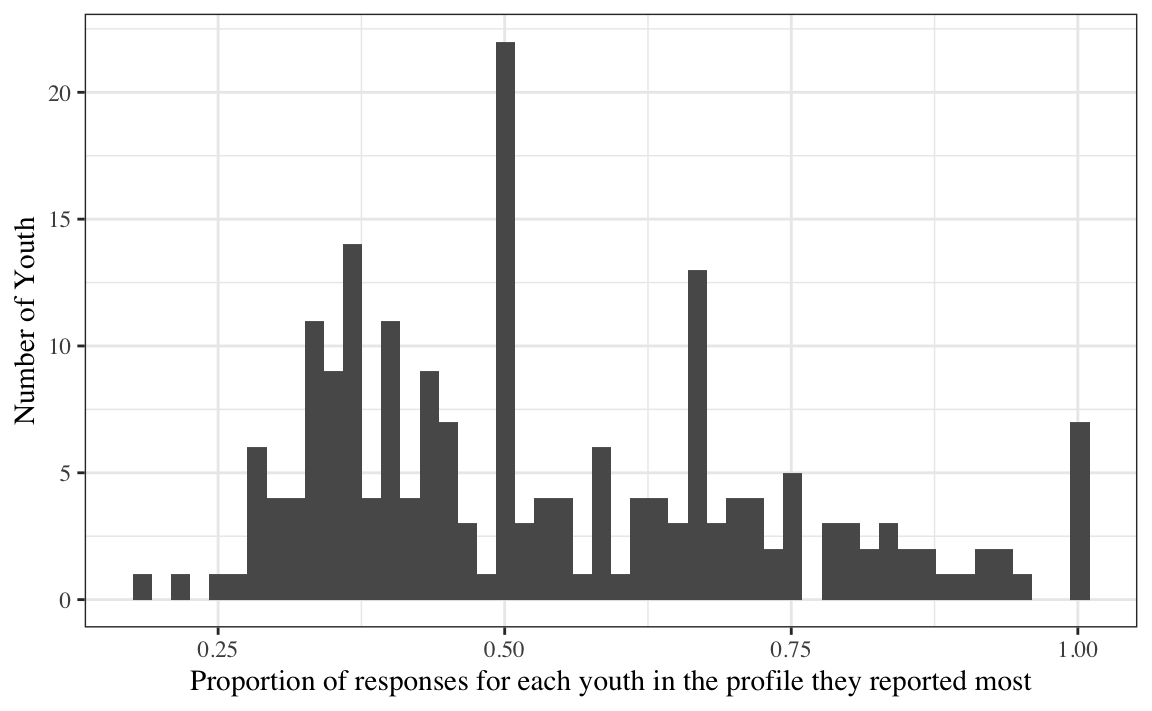
Figure 5.3: Histogram of the proportion of responses for each youth in the profile they reported most
5.6 Results for Research Question #4: Aspects of work with data and engagement
To understand how aspects of work with data were related to engagement, six analytic models were specified – one for each engagement profile. In each model, the dependent variable was the probability of a response being classified in a particular profile (for example fully engaged), as determined by the Latent Profile Analysis. The five aspects of work with data were the predictor (or independent) variables. Various aspects of work with data tended to co-occur and so simultaneously entering indicators for all five aspects served to isolate the association for any single aspect while controlling on the presence of the others. All models also include some youth characteristics which will be used to answer research question five below.
Associations between the five aspects of work with data and the six engagement profiles are presented in the bottom half of Table 4.7. In this table, each column represents the output from one of the six different models. As an example, the first column reports the coefficients for the associations between the predictor variables and the Only behavioral profile. Because the outcome was in the form of a probability (ranging from 0.00 to 1.00), it can be interpreted as the change in the probability of a response being associated with each profile. Note that the p-values were calculated using the most conservative and recommended by recent research Kenward-Rogers approximation (Halekoh & Hojsgaard, 2014).
The only engagement profile that was significantly associated with any aspects of work with data was the Full profile (see the column with the column name Full for these results). When program activities involved modeling data, youth were around 3% more likely to be fully engaged (\(\beta\) = 0.034 (0.017), p = .020; partial \(R^2\) = .002). In other words, when program activities included modeling data, youth were more likely to report working harder, learning more, enjoying themselves more, and feeling more competent and challenged.
Youth were also more likely to be in the Full engagement profile when program activities included generating data (\(\beta\) = 0.027 (0.015), p = .033; partial \(R^2\) = .002). These particular program activities increased the probability of full engagement by around 3%. To sum up these two findings, modeling data and generating data were associated with a (very) positive form of engagement, that exhibited by the Full profile. However, the effect sizes indicate quite small effects in substantive terms. Note that interactions between the individual aspects of work with data and youth characteristics were also specified. However, none of these interactions were found to be statistically significant.
Sensitivity analysis was carried out for the statistically significant two effects was carried out to determine just how robust they were. This follow-up analysis revealed that the effect of modeling data on Full engagement much more robust than that for generating data: 9.835% of this effect (of data modeling) would have to be due to bias to invalidate the inference about its effect. For generating data, only 1.884% of the effect of generating data would need to be due to bias to invalidate the inference about its effect. These values were not minuscule but were also not very large (Frank, 2003). So, while statistically significant, the effect of data modeling seems to be a more robust effect than the effect of generating data, which does not seem to be a very robust (and should, therefore, be interpreted with some caution).
5.7 Results for Research Question #5: Youth characteristics and engagement
Associations between youth characteristics and the six profiles are reported in the top half of Table 4.7. Youth who enter the program with higher levels of interest (in STEM) were more likely to report being in the engaged and competent but not challenged profile (\(\beta\) = 0.039, p = .009; partial \(R^2\) = .001). In other words, youth who were more interested at the outset of the program report working harder, learning more, enjoying themselves more, and feeling more competent when they were involved in program activities, though they also report lower levels of challenge. For this effect, 17.879% would be needed to invalidate the inference, suggesting a moderately robust effect.
In terms of youths’ pre-program interest, these analyses show that youth who enter the program with higher levels of interest (in STEM) were more likely to report being in the Engaged and competent but not challenged profile (\(\beta\) = 0.039, p = .009; partial \(R^2\) = .001). For each one-unit increase in pre-program interest in STEM, youth were around 4% more likely to report this profile. In other words, youth who were more interested at the outset of the program report working harder, learning more, enjoying themselves more, and feeling more competent when they were involved in a program’s activities, though they also report lower levels of challenge. For this effect, 17.879% would be needed to invalidate the inference, a slightly larger value for the follow-up sensitivity analysis than those found for the (statistically significant) relations involving the aspects of work with data, suggesting a moderately robust effect.
There were not any statistically significant effects of youths’ URM status. This lack of relations between URM status and youth engagement may be a function of the large proportion of youth from under-represented (in STEM) racial and ethnic groups. Hispanic (48%), African American or Black (36%), and youth who identify as being from multiple racial and ethnic groups (3%) made up 87% of the youth in the programs, so there were not many youth not from under-represented groups in the sample, suggesting that the absence of findings may be due to this small sample (and low statistical power). Nevertheless, no relations between URM status and youths’ engagement were found, indicating that there is at least no evidence that youth from such backgrounds do engage in different ways.
These (somewhat minimal) findings for the youth characteristics were more surprising than those observed for the aspects of work with data. The results of research question #3, on the sources of variability for the profiles of engagement, suggested that there was much systematic variability at the level of the youth (there were large ICCs at the youth level, with smaller ICCs at the instructional episode level). Because pre-interest, gender, and URM status were variables at this level, it could be expected that they would have meaningful relations with the profiles of engagement. However, it appears that the particular youth characteristics considered were not useful at explaining much of this variability; possible reasons why are discussed in the next section.