Chapter 1 Basics of R and RStudio
This is a discussion of a very-brief history and context for the R programming language and the RStudio interface software.
1.1 Learning Objectives:
- Learn a bit of background and history about R and RStudio.
- Understand the use of RStudio to interface with R;
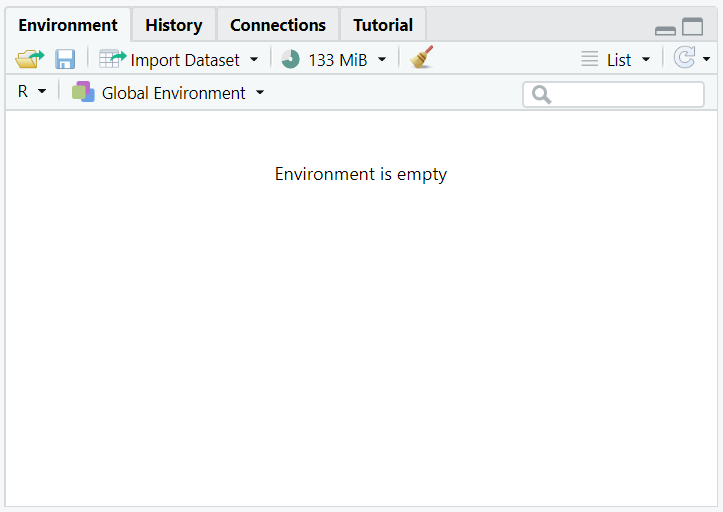
- Understand basic utility of each quadrant in RStudio, and utilize each quadrant (via an example).
1.2 What is R?
R is a software program, originally written by statisticians, for statisticians.
- More recently, interface tools (
dplyrandggplot2particularly) have been added to enhance the programming flow and to assist data-science goals. - Originally started as project for teaching statistics in early 1990’s by two statisticians, Ross Ihaka and Robert Gentleman - announcement found in article “R: A Language for Data Analysis and Graphics” (R. Ihaka 1996)
- Freeware program; became open-source in mid 1990’s
- More historical context available here
- First public release (version 1.0.0) in February 2000. See original announcement.
- Updateable via packages – hence constantly morphing and revising.
- Multiple software releases per year: current version, R v. 4.2.3 (released 3-16-23, each with its own nickname.
- Interface: Command-line based, very stark and trim
Where to download: https://cran.r-project.org/
Purpose: This is the software that translates the code, performs computations, and produces statistical summaries.
1.3 What is RStudio?
RStudio is a software program, serving as a “wrapper” / interface with quadrants providing various information.
- Quadrants are re-sizable, with specific purposes.
- Freeware (for individual desktop versions) interface program.
- First released in 2011, widely usable by 2013-14, now is the nearly ubiquitous interface tool for R
- Must have R installed first
- Simply a user-friendly window to interact with R’s capabilities - RStudio then communicates code to be run in R
- Multiple releases per year, RStudio Desktop current version: 2023.03.0+386 (released: 2023-03-16)
- Interface: much sleeker and more window- and mouse-based
Where to download: https://www.rstudio.com/products/rstudio/download/
Purpose: This is where you enter code and interface with code files.
1.4 How do we use RStudio?
Key: recognize that RStudio is a “wrapper” (tool for interfacing) for programming in R.
We only need to directly open RStudio.
- This is our interface with code and output.
- Menus and interact-ability with the mouse provide more familiar navigation.
Reference Notes
Starting R sheet: may be printed from https://www.datacamp.com/cheat-sheet/getting-started-r
