5 Assessment Dashboard
5.1 What’s included in the Assessment Dashboard?
5.1.1 Temporal scope
The Assessment Dashboard is intended to facilitate the review of preliminary assessments derived from the current IR period of record. As such, the assessment categories displayed here do not incorporate assessments from previous IRs (e.g. an AU may be green for fully supporting in the app, but have a previous listing that will override the reported category in the published IR). Assessment units have been prioritized for review by identifying AUs with new listings (by parameter), priority permits, & new insufficient data with exceedances (by parameter).
IMPORTANT
If you find a major bug or potential programming error, please notify the IR team ASAP (We have thick skin! And these are all new tools! We can re-generate the IR with needed tweaks in under 30 minutes if necessary.).
Please do not spend a bunch of time trying to review something that seems broken or that may have wide-ranging impacts on the assessment and review process.
5.1.2 Assessment types in the map
On the map, AU assessment categories reflect the results of conventionals, toxics, E. coli, lake profiles, biological tissue (GSL egg selenium & fish mercury), and high frequency dissolved oxygen assessments. All of these except lake profile assessments are also reflected in the ‘Assessed sites’ data layer. Lake profile assessments were only carried into the assessment dashboard at the AU level, but these assessments can be reviewed through the lake dashboard (talk to Jake about using this app).
5.1.3 Data types in analysis tools
The analytical tools here are predominately focused on the toxics, conventionals, and E. coli datasets. Talk to the IR team if you are interested in further reviewing lake profile, tissue, or high frequency dissolved oxygen assessments.
The data included here are all data that passed IR screening and QA/QC type checks. These are values pre-daily time-step aggregation, meaning there may be multiple values for a parameter at a single site and date on the figures. For assessment purposes, the daily min, max, mean, or geomean is generated as appropriate for each criterion. Supplementary and correction factor parameters are also available for plotting including flow, calcium, magnesium, and hardness. Specific correction factors used to calculate criteria
Note:
There was an error importing the Salt Lake County cooperator data to WQP. These data will be evaluated separately when they are available and are not currently included in the application.
5.2 Launching the app
Launch the site validation app using the code below. Pressing enter will launch the app into a browser window.
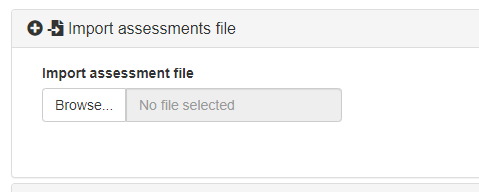
5.3 File upload
To start, upload your desired reviewer input file by clicking the ‘Browse’ button and navigating to your file. The reviewer input files are pre-generated data files containing preliminary assessment categories at the MLID, beneficial use, & parameter scale. These are used to populate the reviewer map and select data to view. Input files are broken up by watershed management unit and reviewer type. Navigate to your folder on the 2022 IR Secondary Review Drive folder to locate your customized input files.
Once your site file has been uploaded (indicated by “Upload complete” on the progress bar), collapse the “Import assessments file” menu and open the “Review map” menu.
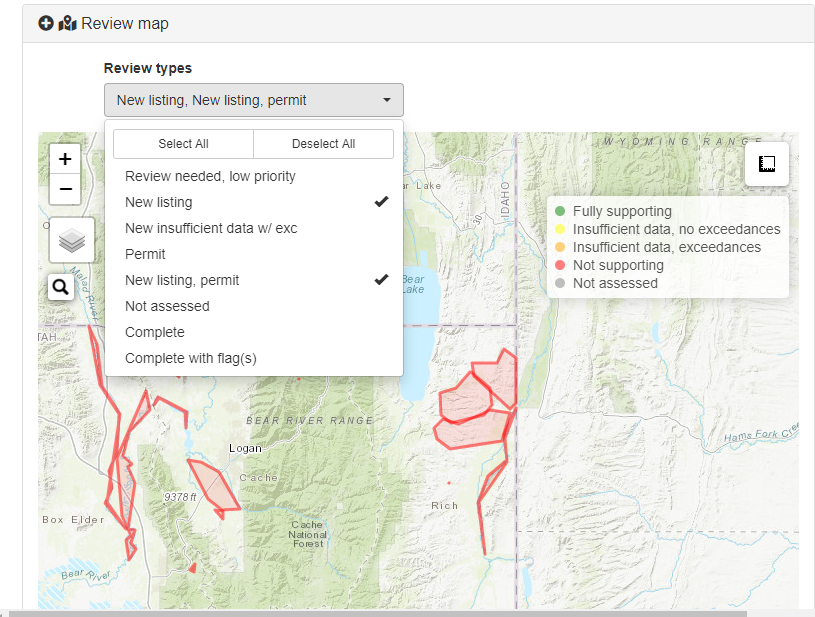
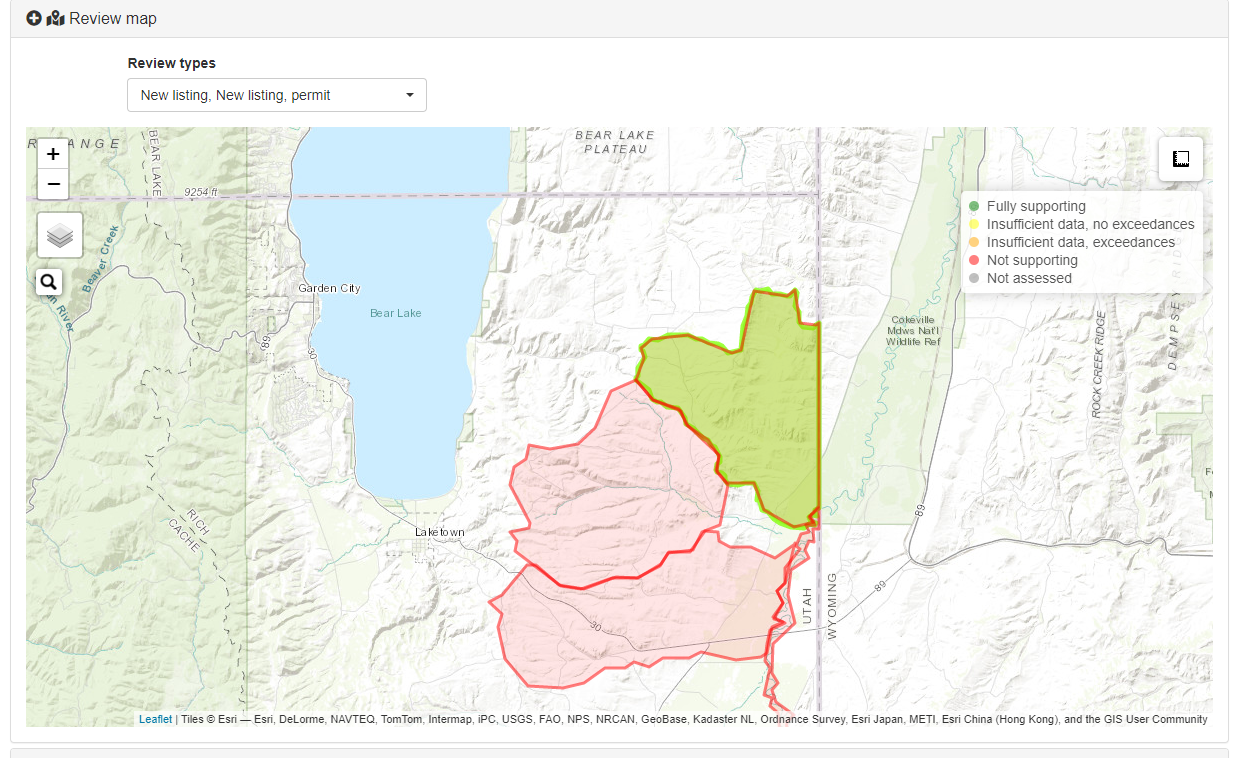
5.4 Assessment map
The “Review map” section will open to a map of assessment units in your input file. The AUs are color coded by preliminary assessment category. The default filters are for AUs with new listings & AUs with new listings containing priority permits. To review the review priority categories and update the filters on your map, click the ‘Review types’ dropdown menu and select your desired categories.
The IR team recommends not collapsing the map panel once a map has been generated, as this occasionally causes map rendering to fail.
Note that in addition to the AUs in need of review, you can also turn on and off additional layers (e.g. beneficial uses, site-specific standards, by hovering over the layers tile on the left hand side of the map.
5.5 Building analysis & review tools
To start reviewing preliminary assessments, zoom and pan the map to your AUs of interest. As you hover over an AU, you will see information about preliminary assessments for that AU. Click an AU. You will know the AU has been selected if it is highlighted green.
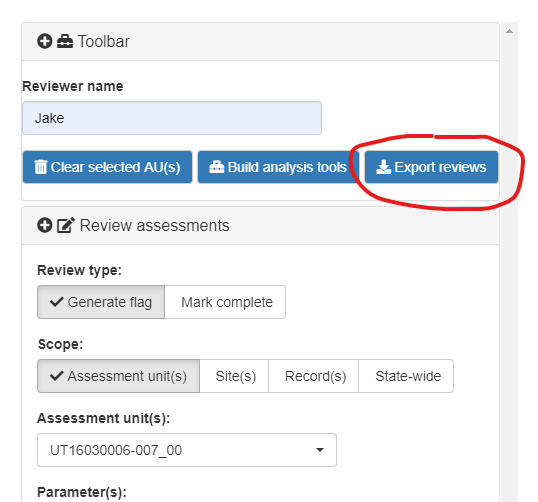
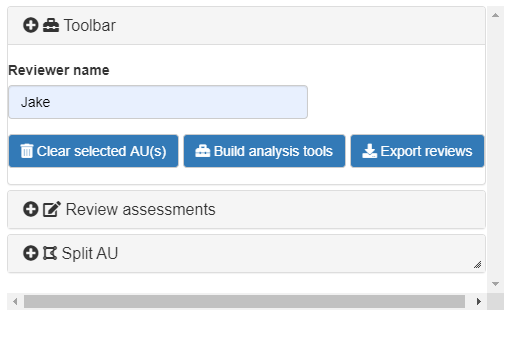
Once you have selected your sites, navigate to the reviewer toolbar on the right hand side of the screen. Enter your name in the ‘Reviewer name’ box. The first three buttons on this toolbar allow you to clear the AUs you selected on the map (you can also do this by clicking that AU again),
build tools to analyze and review the assessment, and to export your reviews.
Click the ‘Build analysis tools’ button to generate figures and reviewer flag tools. To speed up the application and prevent potential errors, the analysis and flags portions of the app do not update until you click the ‘Build’ button.
So, if you want to switch the AUs in those parts of the app, you must select a new AU and click the ‘Build’ button again. A warning will flash in the toolbar to recommend a re-build when AU selections in the map are altered. Note that selecting multiple AUs is allowed
to enable comparisons of data among AUs, but you may prefer to work through AUs one at a time during this review process.
5.6 Analytical tools
Scroll down the left panel of the app to see the analytical tools available to reviewers. These tools include a set of figures, the ability to view and export data and assessment summaries, and a link to download raw data from the Water Quality Portal. Use these tools to review, confirm, or identify potential issues with the preliminary assessments. Many figures also include criteria applicable to the data in the plot and used for assessments. All of the figures on the figures panel are interactive meaning you can zoom, pan, select, and hover or click on data points to view information about them. You can also click/double click labels in the plot legends to turn individual traces on and off. Note: if the ‘Concentration map’ does not render blue points on the map, update the selected parameter in the drop down menu above (even if you just change it back to what it was - updating the selected parameter triggers the map to generate sites).
5.7 Reviewer flags
IMPORTANT: Your “Export reviews” button is your SAVE button. The only way to save progress on your site reviews is to export your work. You can click “Export reviews” as many times as you want throughout the session, and periodically downloading your edits to the site file is highly recommended.
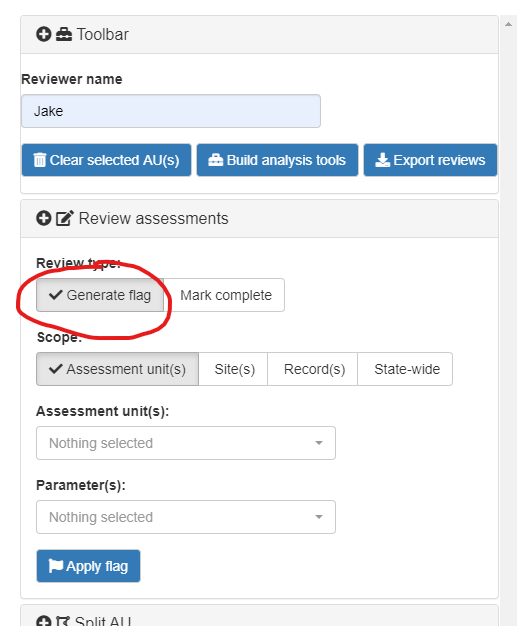
Under ‘Review assessments’ on the reviewer toolbar, reviewers can either generate a flag or mark their review as complete for an AU.
5.7.1 Generating flags
Reviewers can generate flags associated with an assessment at multiple ‘scopes’: assessment unit, site, record, or state-wide. To generate a flag, select the ‘Generate flag’ check-button, then select the appropriate review scope. Each review scope has a separate interface to help narrow down the AUs, sites, parameters, or records for which the flag applies. Flags require all boxes to be filled in and selections to be made before proceeding. Once you have generated the info for your flag, click the ‘Apply flag’ button to apply and save your flag.
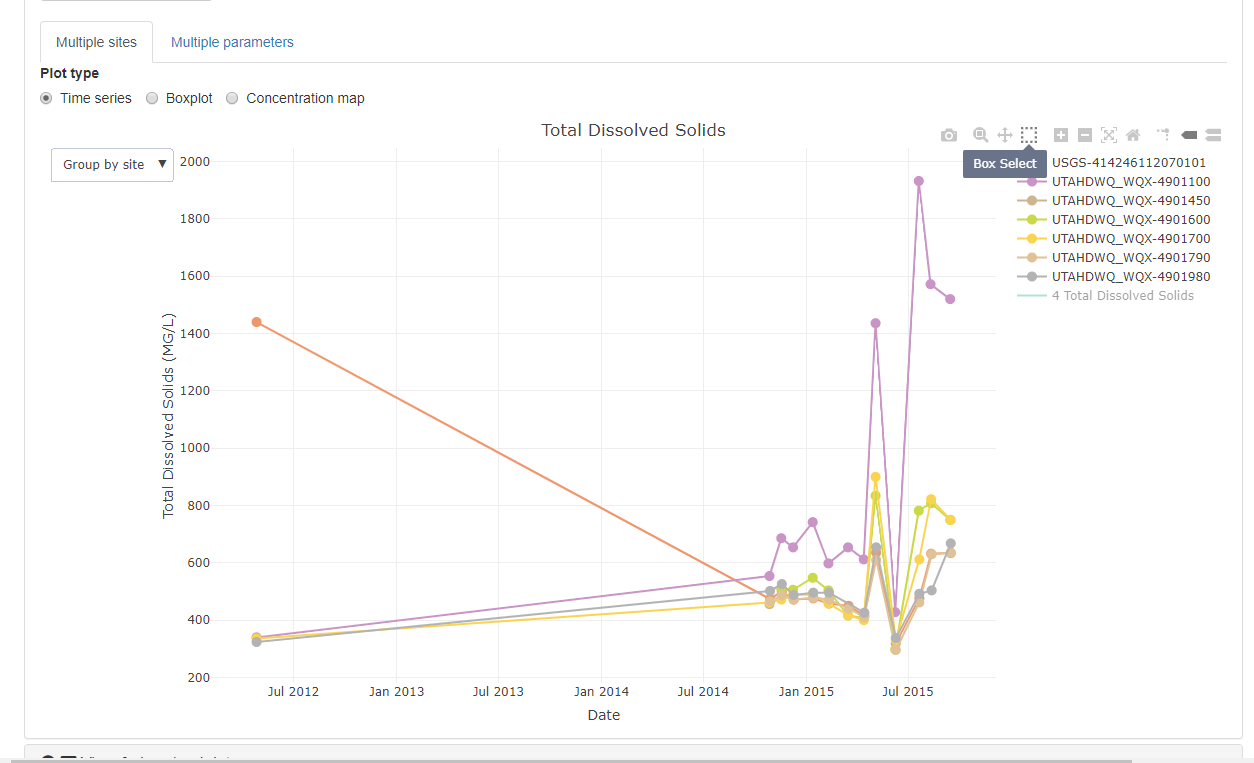
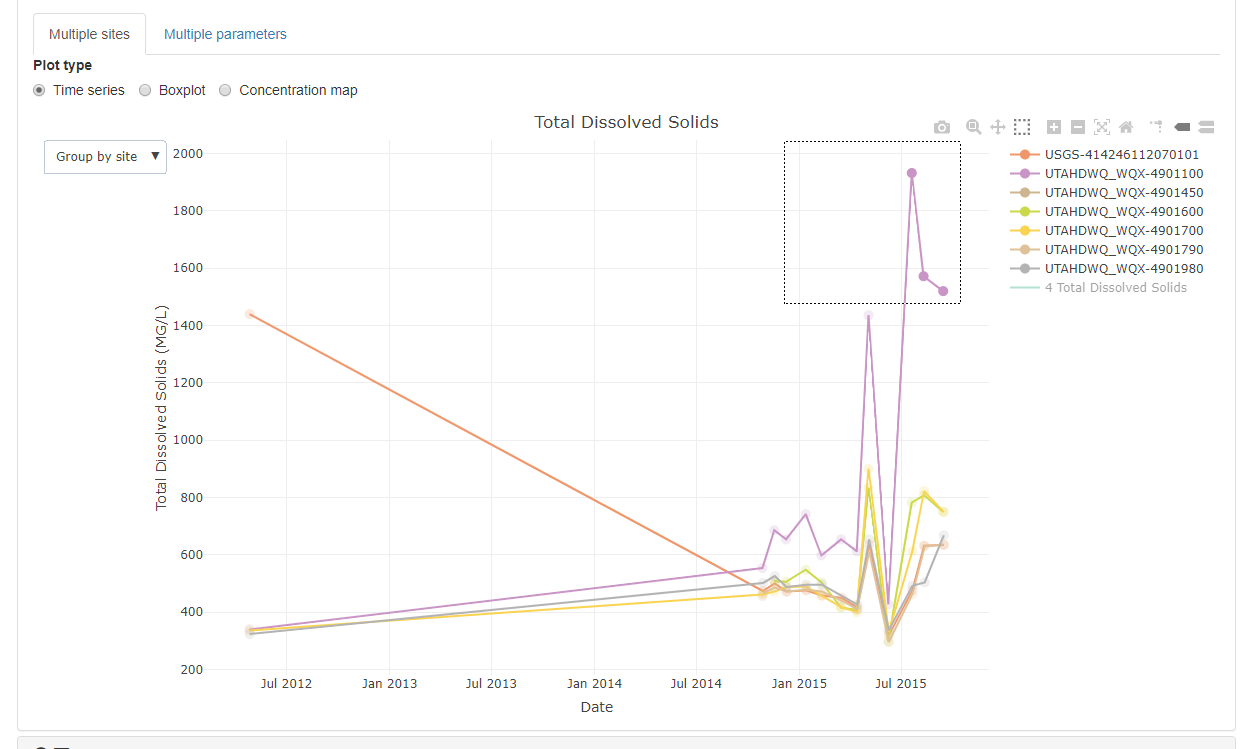
The record flag scope requires the user to select datapoints from the ‘Figures’ panel. To generate record-specific flags, navigate to the multiple site time series figure (Figures panel -> Multiple sites tab -> Time series radio button). Select the parameter to flag in the dropdown menu above. Hover over the plot to display a toolbar in the top right corner of the plot. Select the ‘Box select’ tool, then draw a box around the points you want to flag and comment on. Fill out your comment and click the ‘Apply flag’ button.
Selecting the ‘Box select’ tool:
Selecting data points
5.7.2 Recommending an AU split
Reviewers can also recommend splitting or re-segmenting an AU to more accurately convey assessments if desired. Note that this is just a recommendation similar to reviewer flags which will prompt the IR team and reviewers to further investigate whether a re-segmentation would be appropriate for this AU. Splits are only allowed one AU at a time.
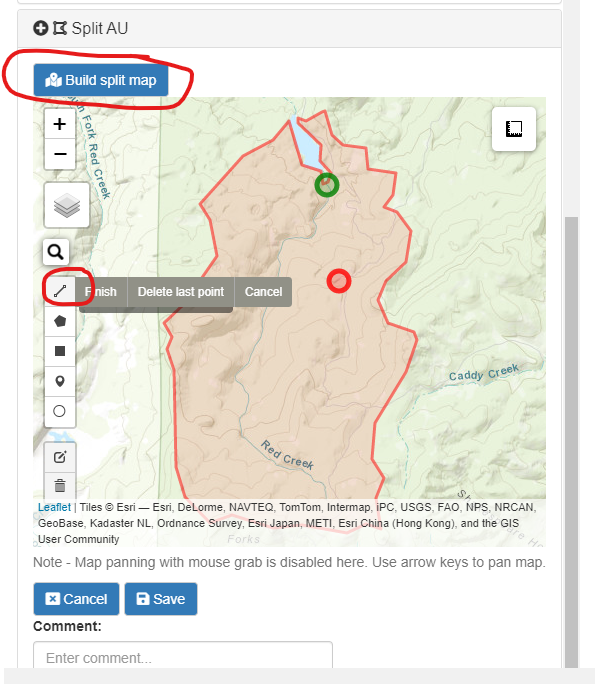
To recommend a split, navigate to the ‘Split AU’ panel on the reviewer toolbar and click the ‘Build split map’ button. On the map, you will see your selected AU along with the assessed sites from this period of record. To start drawing a split, select one of
the drawing tools from the toolbar on the left-hand side of the map window (the line drawing tool is probably preferred).
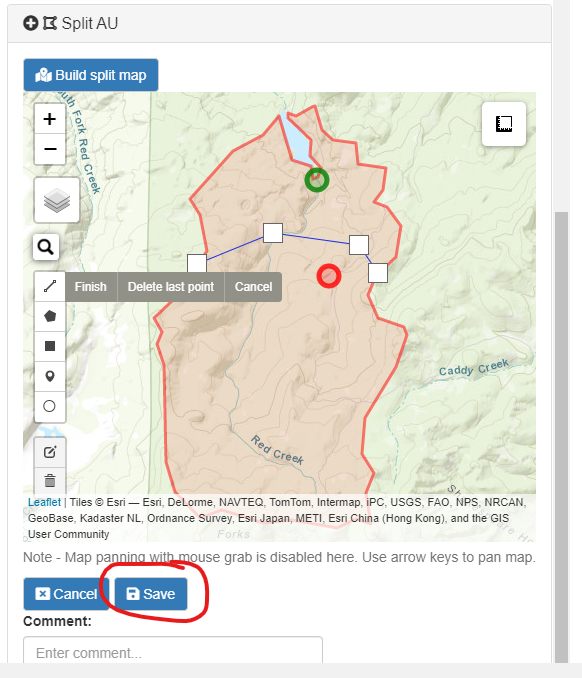
Then, start drawing your recommended split. No need to be exact here - this is just to identify a potential splitting candidate and approximate the recommended split location. To finish drawing, either click the ‘Finish’ button on the drawing toolbar or double
click the last point on your line path. You can recommend one or multiple splits for an AU. When finished drawing recommended splits, enter a comment if desired, and click the ‘Save’ button to save your splits.
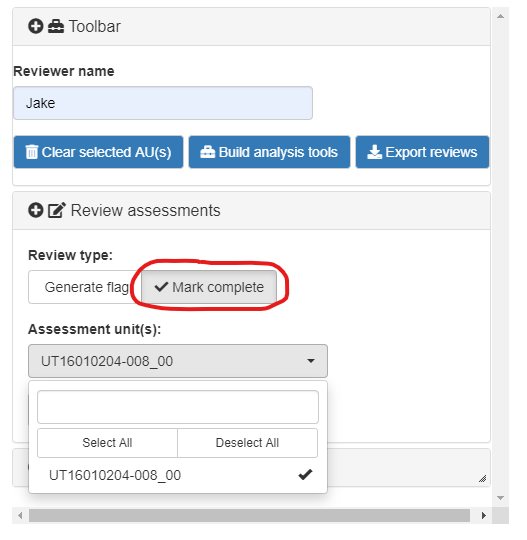
5.7.3 Marking an AU review as complete
After performing a review, you will mark your review as complete for applicable AUs. Select the ‘Mark complete’ box, select the AUs for which your complete review applies, then click the ‘Mark complete’ check-button. If your review confirmed the preliminary assessment without additional flags, the review type category for this AU will update to ‘Complete’. If you generated flags during the review of the AU, the review type category will update to ‘Complete with flag(s)’.
5.8 Exporting (saving) reviews
CANNOT STRESS ENOUGH: Your “Export reviews” button is your SAVE button. You can click “Export reviews” as many times as you want throughout the session, and periodically downloading your edits to the site file is highly reccommended.
The export will contain all sites & AUs from the initial upload file. Exported files can be re-uploaded at a later time for further review/editing.