3 Review and analysis applications
3.1 Site review and assessment review Apps
Remember: Every time you double click the icon to open up the R console, you will need to run the following code to enable the irTools review apps.
3.1.1 Site review
There are two main applications available to secondary reviewers. These applications are supported by Shiny, a platform for interactive computing supported by RStudio. Moving chronologically through the assessment process, secondary reviewers are first tasked with reviewing sites at which water quality data are readily available. We will perform these reviews using the Site Review App. The irTools package performs the bulk of automated site validation, but there are some aspects of the sites that require reviewer expertise. Sites in need of review are flagged and placed on a map for spatial and metadata inspection. To run the Site Review App, type the following into the console and hit enter.
This function will open a browser window containing the app. When you are done reviewing sites, ensure you’ve exported your reviews, close out of the browser containing the app, AND hit the Esc button on your keyboard to stop running the app.
3.1.2 Assessment Review
After all possible sites are accepted or rejected, the irTools package takes the subset of water quality data from accepted sites and assigns detection limits, screens data for important metadata components, and preps data for assessment. It then runs assessments on the accepted data, identifying exceedances, and assigning categories at the site and assessment unit level. Once all data are assessed, it is once again your turn to review the assessments and take a look at the data used to make those assessments. Automation is great but it can’t replace your expertise and well-trained eye. Assessment reviews largely occur using the Assessment Dashboard App. However, lake profile reviews and high frequency dissolved oxygen data reviews require the use of other applications, described in the following section of this chapter.
This function will open a browser window containing the app. When you are done reviewing assessments, ensure you’ve exported your reviews, close out of the browser containing the app, AND hit the Esc button on your keyboard to stop running the app.
3.2 Other Apps
3.2.1 High Frequency DO App
The purpose of the high frequency DO app is to view time series of the data, zoom in to specific time periods of interest, and review exceedance frequencies of the different standards. The data are built into the app, so any comments or notes need to be written up in a spreadsheet or document and sent to the IR Team via Trello or email.
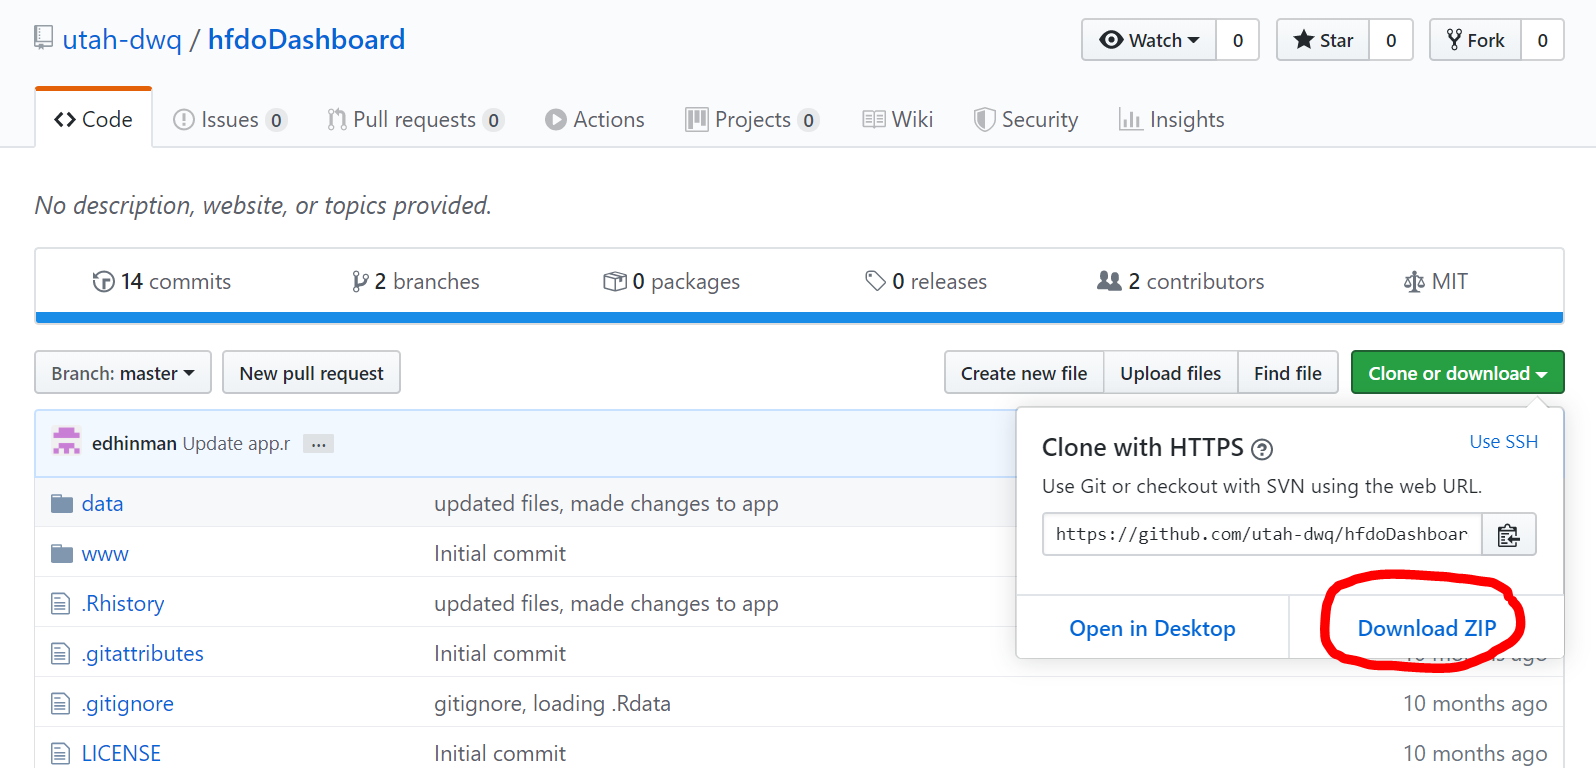
Unlike the site review and assessment review apps, the high frequency dissolved oxygen review app is not within irTools. Instead, it has its own hfdoDashboard repository at DWQ’s GitHub. Head to the repository page and download the application to a zip file.
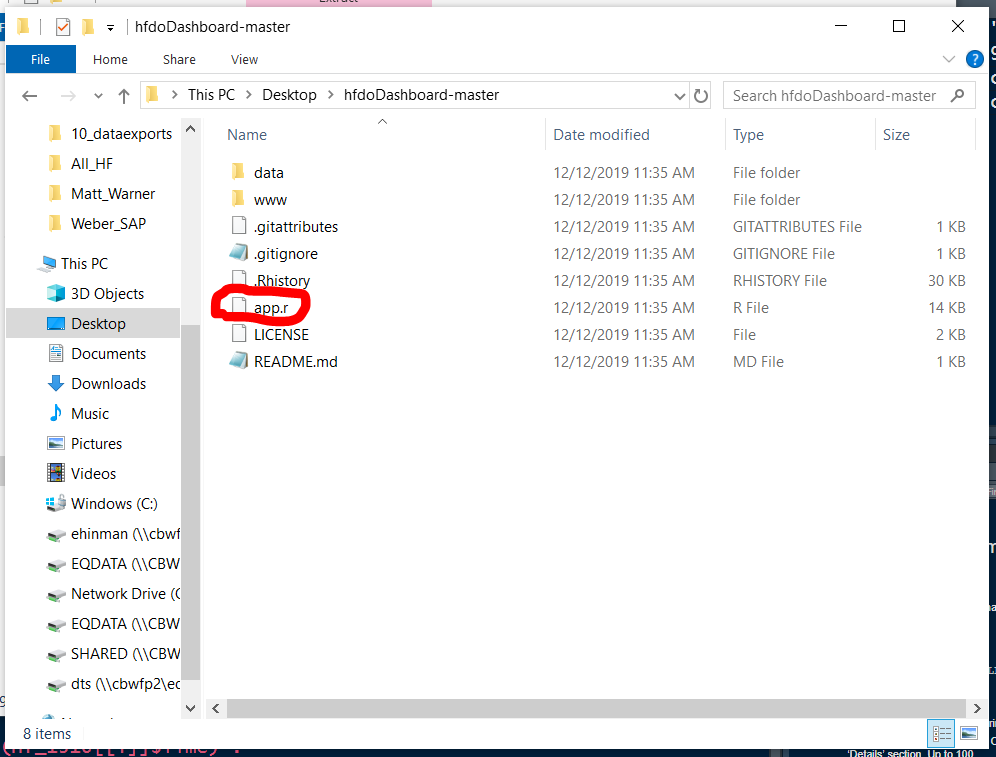
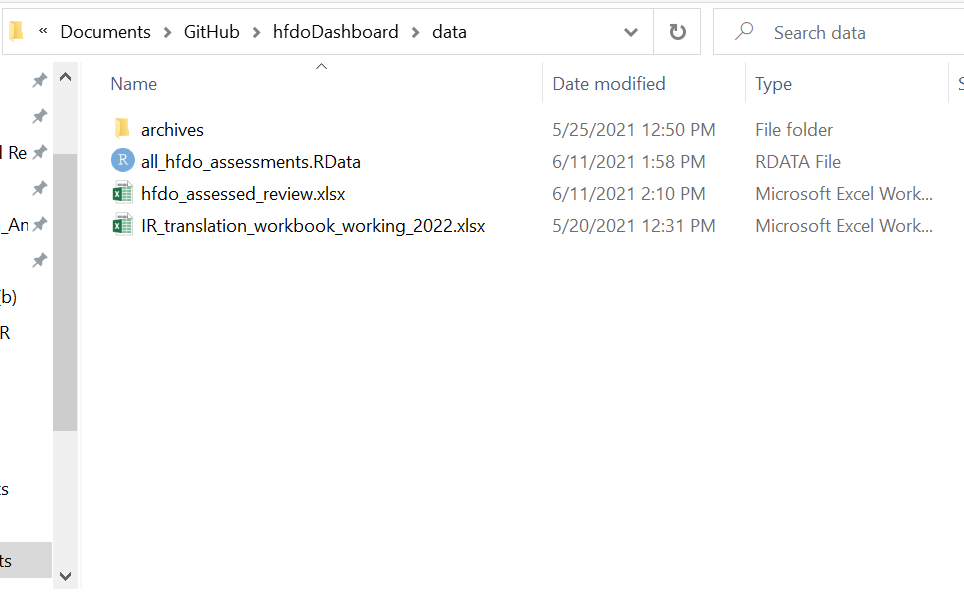
After extracting the folder to a location of your choice, open up the folder and select the app file.
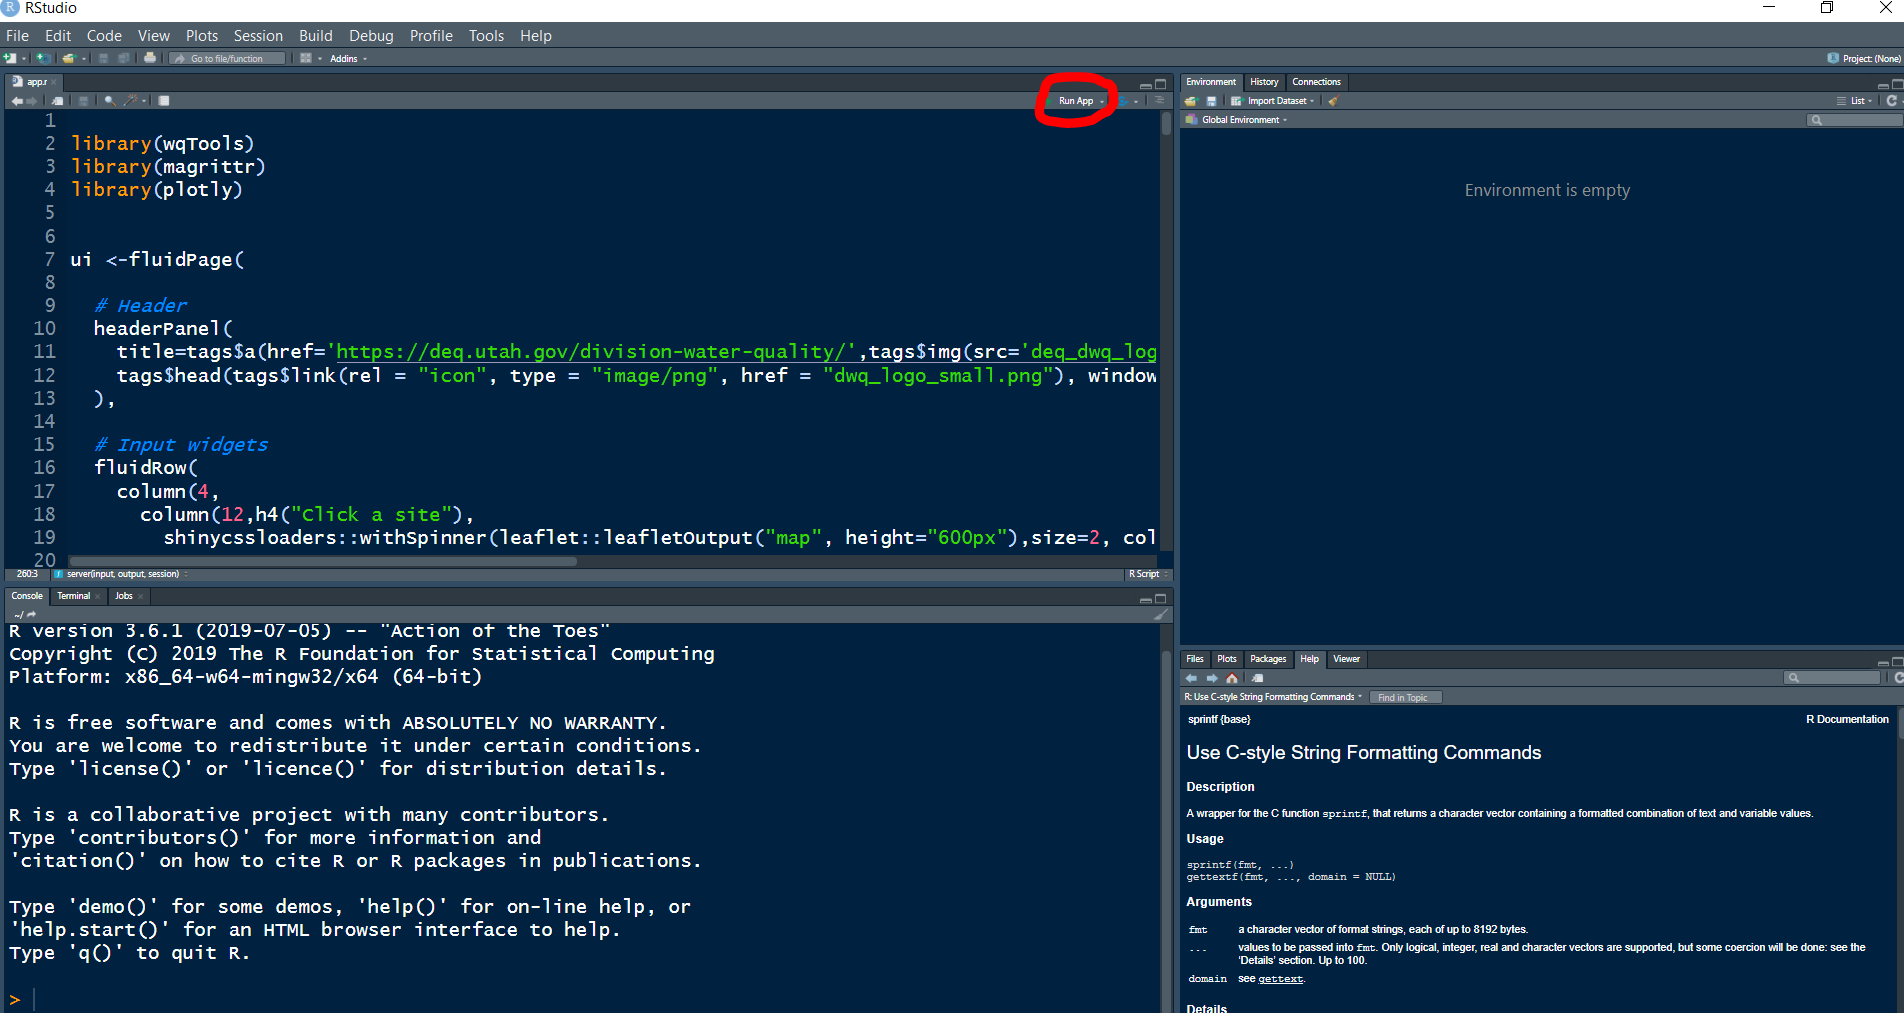
Open the app.R file using RStudio. This will bring up a long script in the upper left hand pane of the RStudio program. Next, navigate to the “Run App” button on the upper right side of the script pane. Click the small white down arrow to the right of the “Run App” text and make sure the setting is to “Run External”. This will cause the app to open in an internet browser.
The app takes a little time to load, so do not fret if it takes a few seconds to minutes. A map will appear on the left hand side with the high frequency DO sites represented by hollow circles. Click one of the sites and wait for the time series to appear on the right side of the window.
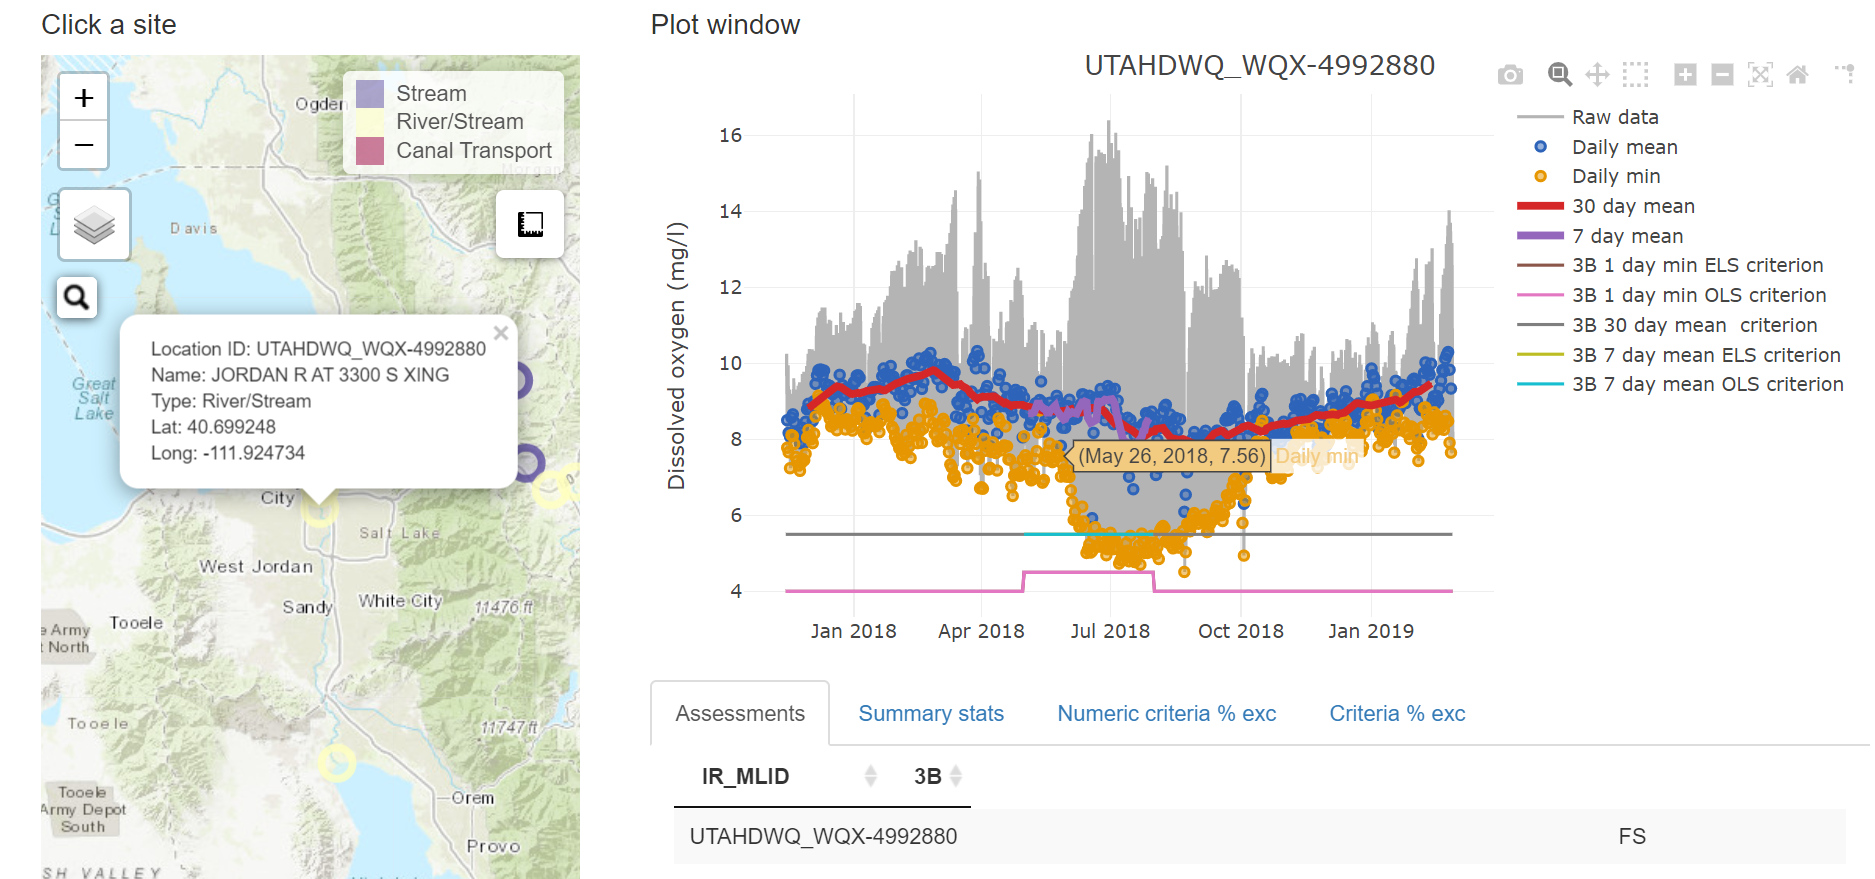
The timeseries are built in an R package called plotly, which allows the user to zoom into particular sections using the zoom tool from the toolbar in the upper right side of the plot. You can also turn on and off certain layers by clicking their icons in the legend.
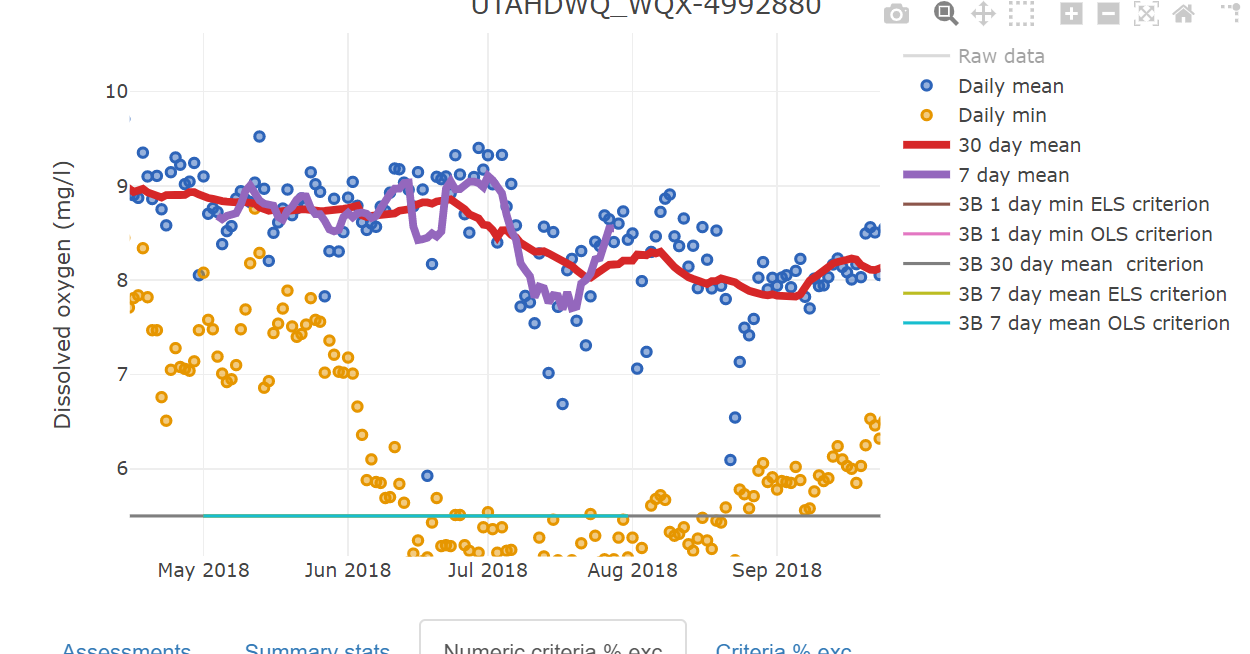
Finally, use the set of tables at the bottom of the app window to understand the frequency with which the data exceed the criteria.
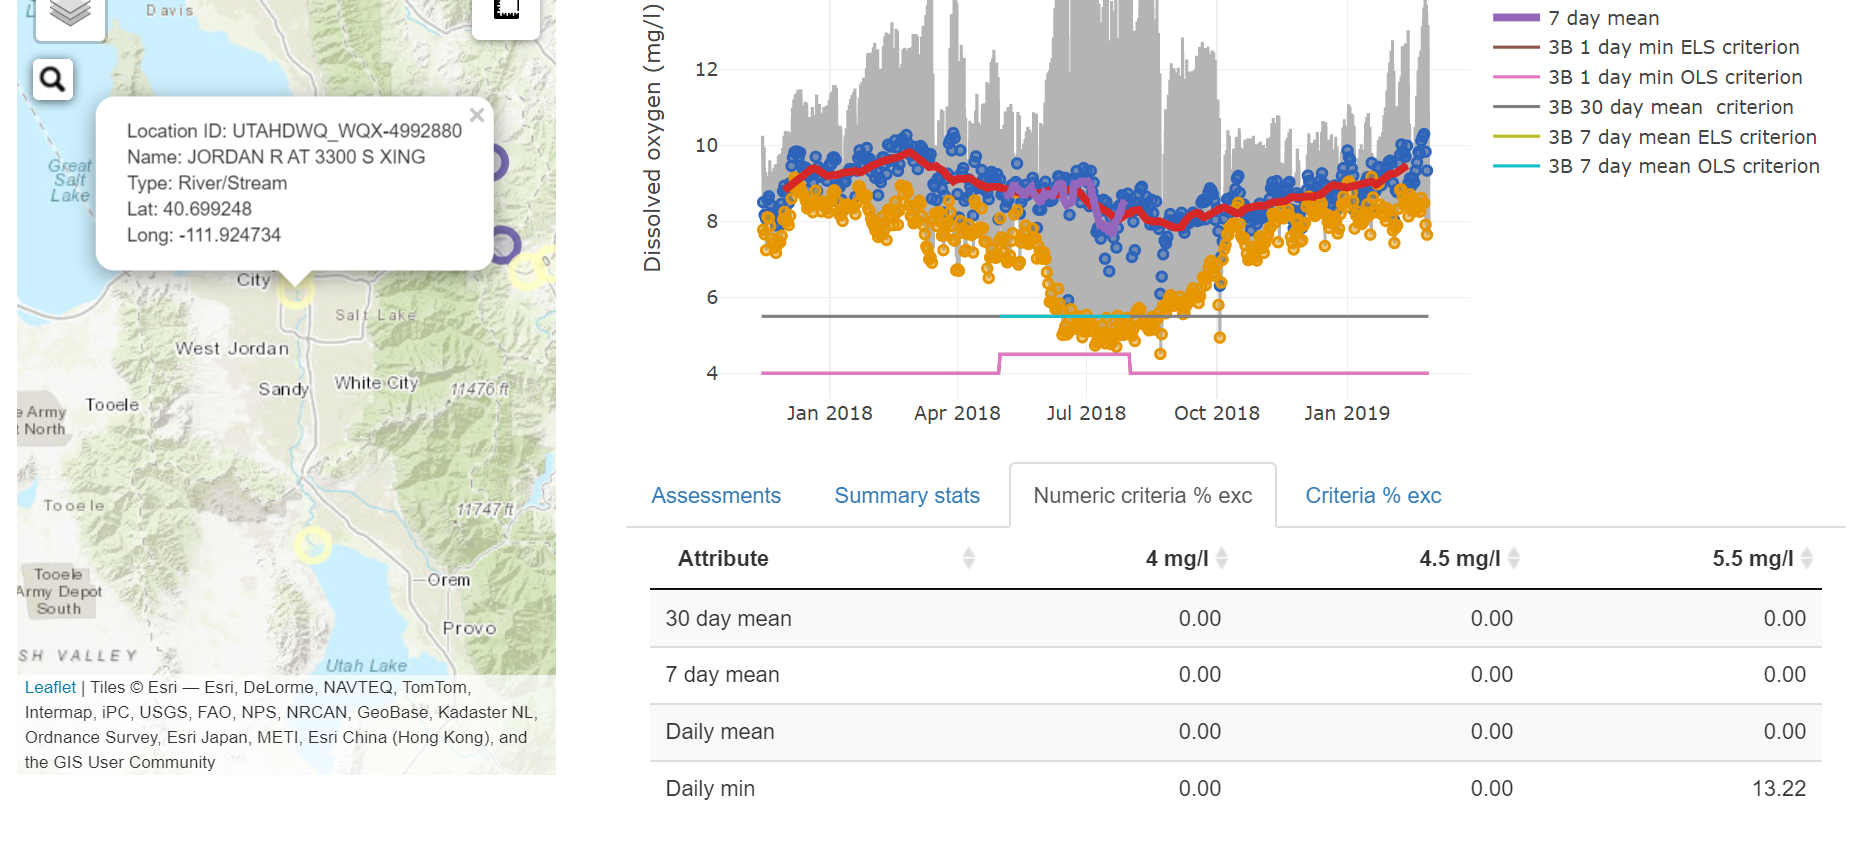
When you want to look at another site, just click the corresponding point on the map to refresh the time series pane and table information. Again, note that the sheer size of the dataset can cause the app to run slowly.
Summaries of the high frequency assessments in an Excel workbook can be found here:
3.2.2 Lake Profile Assessment App
User guide
irTools::lakeDashboard()