Capítulo 4 Classificação
4.1 Inibina B como marcador
Avaliar a inibina B como marcador da reserva ovariana de pacientes submetidas à fertilização in vitro
library(readxl)
library(tidyverse)
## ── Attaching packages ────────────────────────────────────────────────────────────────────────────────────────── tidyverse 1.3.2 ──
## ✔ tibble 3.1.8 ✔ purrr 0.3.5
## ✔ tidyr 1.2.1 ✔ dplyr 1.0.10
## ✔ readr 2.1.3 ✔ forcats 0.5.2## Warning: package 'readr' was built under R version 4.2.2## Warning: package 'dplyr' was built under R version 4.2.2## ── Conflicts ───────────────────────────────────────────────────────────────────────────────────────────── tidyverse_conflicts() ──
## ✖ dplyr::filter() masks stats::filter()
## ✖ dplyr::lag() masks stats::lag()
## ✖ purrr::lift() masks caret::lift()
## ✖ dplyr::select() masks MASS::select()library(readxl)
library(ggthemes)
library(plotly)## Warning: package 'plotly' was built under R version 4.2.2##
## Attaching package: 'plotly'
##
## The following object is masked from 'package:MASS':
##
## select
##
## The following object is masked from 'package:ggplot2':
##
## last_plot
##
## The following object is masked from 'package:stats':
##
## filter
##
## The following object is masked from 'package:graphics':
##
## layoutlibrary(knitr)
library(kableExtra)## Warning: package 'kableExtra' was built under R version 4.2.2##
## Attaching package: 'kableExtra'
##
## The following object is masked from 'package:dplyr':
##
## group_rowslibrary(rpart)
library(rpart.plot)
library(caret)
library(MASS)
library(httr)##
## Attaching package: 'httr'
##
## The following object is masked from 'package:plotly':
##
## config
##
## The following object is masked from 'package:caret':
##
## progresslibrary(readxl)
library(tibble)
library(e1071)
library(neuralnet)## Warning: package 'neuralnet' was built under R version 4.2.2##
## Attaching package: 'neuralnet'
##
## The following object is masked from 'package:dplyr':
##
## computelibrary(factoextra)## Warning: package 'factoextra' was built under R version 4.2.2## Welcome! Want to learn more? See two factoextra-related books at https://goo.gl/ve3WBalibrary(ggpubr)## Warning: package 'ggpubr' was built under R version 4.2.24.2 Conjunto de dados
Conjunto de dados disponibilizado pela professora Dra.Olga para a aula de Big Data & Analytics no IPT.
Inibina: inibina.xlsx
httr::GET("http://www.ime.usp.br/~jmsinger/MorettinSinger/inibina.xls", httr::write_disk("../Cadernos_Josias/dados/inibina.xls", overwrite = TRUE))## Response [https://www.ime.usp.br/~jmsinger/MorettinSinger/inibina.xls]
## Date: 2022-12-07 00:27
## Status: 200
## Content-Type: application/vnd.ms-excel
## Size: 8.7 kB
## <ON DISK> C:\Users\Josias\Documents\IPT\BD\Cadernos_Josias\dados\inibina.xlsinibina <- read_excel("../Cadernos_Josias/dados/inibina.xls")Adicionando coluna com a diferença entre pré e pós e ajustando a variável resposta para categórica:
Distribuição das respostas do conjunto de dados:
kable(inibina) %>%
kable_styling(latex_options = "striped")| ident | resposta | inibpre | inibpos | difinib |
|---|---|---|---|---|
| 1 | positiva | 54.03 | 65.93 | 11.90 |
| 2 | positiva | 159.13 | 281.09 | 121.96 |
| 3 | positiva | 98.34 | 305.37 | 207.03 |
| 4 | positiva | 85.30 | 434.41 | 349.11 |
| 5 | positiva | 127.93 | 229.30 | 101.37 |
| 6 | positiva | 143.60 | 353.82 | 210.22 |
| 7 | positiva | 110.58 | 254.07 | 143.49 |
| 8 | positiva | 47.52 | 199.29 | 151.77 |
| 9 | positiva | 122.62 | 327.87 | 205.25 |
| 10 | positiva | 165.95 | 339.46 | 173.51 |
| 11 | positiva | 145.28 | 377.26 | 231.98 |
| 12 | positiva | 186.38 | 1055.19 | 868.81 |
| 13 | positiva | 149.45 | 353.89 | 204.44 |
| 14 | positiva | 33.29 | 100.09 | 66.80 |
| 15 | positiva | 181.57 | 358.45 | 176.88 |
| 16 | positiva | 58.43 | 168.14 | 109.71 |
| 17 | positiva | 128.16 | 228.48 | 100.32 |
| 18 | positiva | 152.92 | 312.34 | 159.42 |
| 19 | positiva | 148.75 | 406.11 | 257.36 |
| 20 | negativa | 81.00 | 201.40 | 120.40 |
| 21 | negativa | 24.74 | 45.17 | 20.43 |
| 22 | negativa | 3.02 | 6.03 | 3.01 |
| 23 | negativa | 4.27 | 17.80 | 13.53 |
| 24 | negativa | 99.30 | 127.93 | 28.63 |
| 25 | negativa | 108.29 | 129.39 | 21.10 |
| 26 | negativa | 7.36 | 21.27 | 13.91 |
| 27 | negativa | 161.28 | 319.65 | 158.37 |
| 28 | negativa | 184.46 | 311.44 | 126.98 |
| 29 | negativa | 23.13 | 45.64 | 22.51 |
| 30 | negativa | 111.18 | 192.22 | 81.04 |
| 31 | negativa | 105.82 | 130.61 | 24.79 |
| 32 | negativa | 3.98 | 6.46 | 2.48 |
plot(inibina$difinib ~ inibina$resposta, ylim = c(0, 400))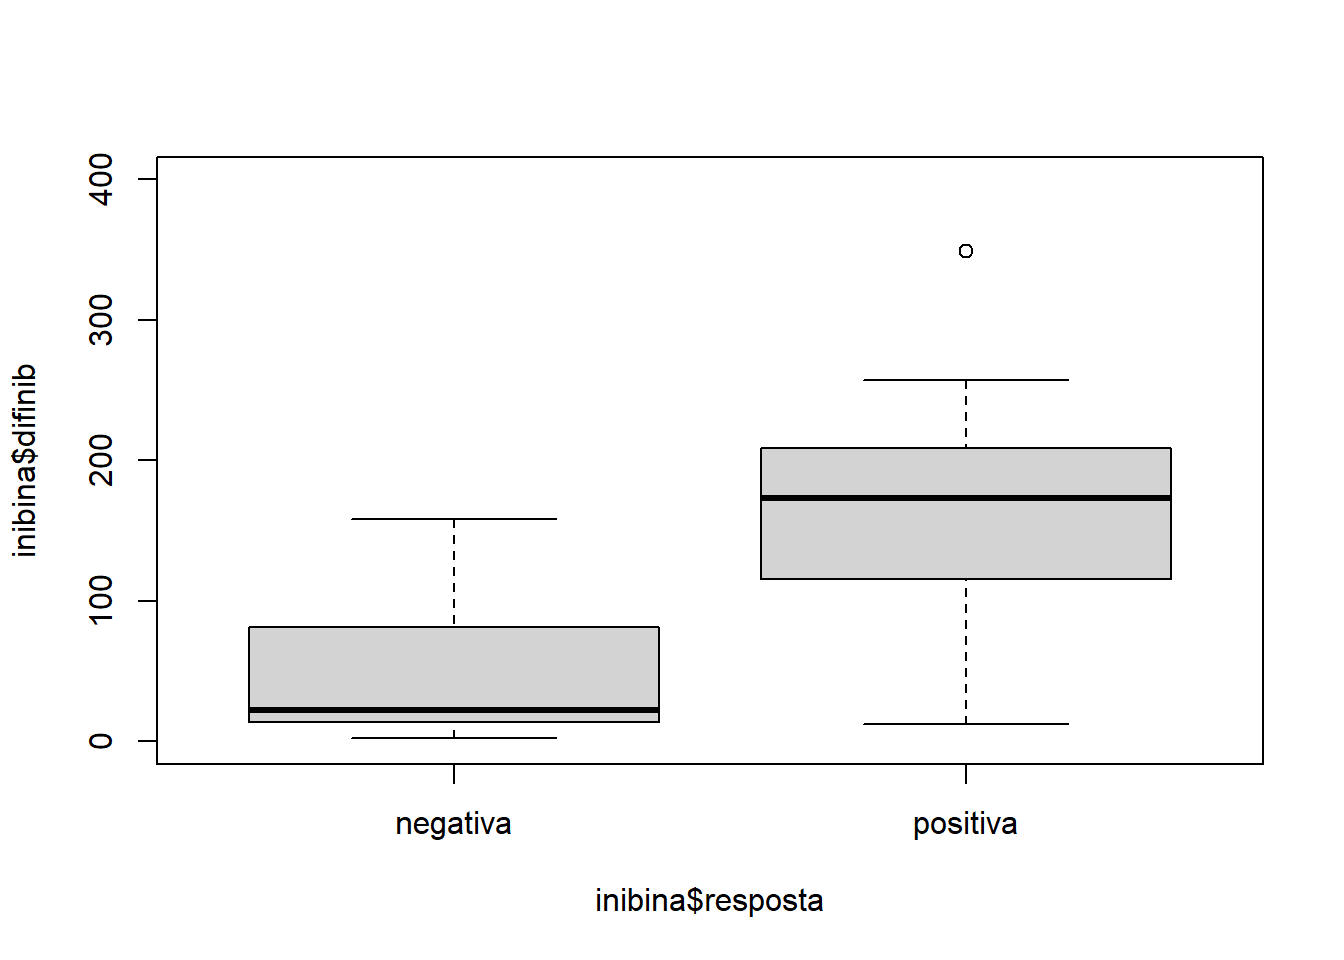
summary(inibina)## ident resposta inibpre inibpos difinib
## Min. : 1.00 negativa:13 Min. : 3.02 Min. : 6.03 Min. : 2.48
## 1st Qu.: 8.75 positiva:19 1st Qu.: 52.40 1st Qu.: 120.97 1st Qu.: 24.22
## Median :16.50 Median :109.44 Median : 228.89 Median :121.18
## Mean :16.50 Mean :100.53 Mean : 240.80 Mean :140.27
## 3rd Qu.:24.25 3rd Qu.:148.93 3rd Qu.: 330.77 3rd Qu.:183.77
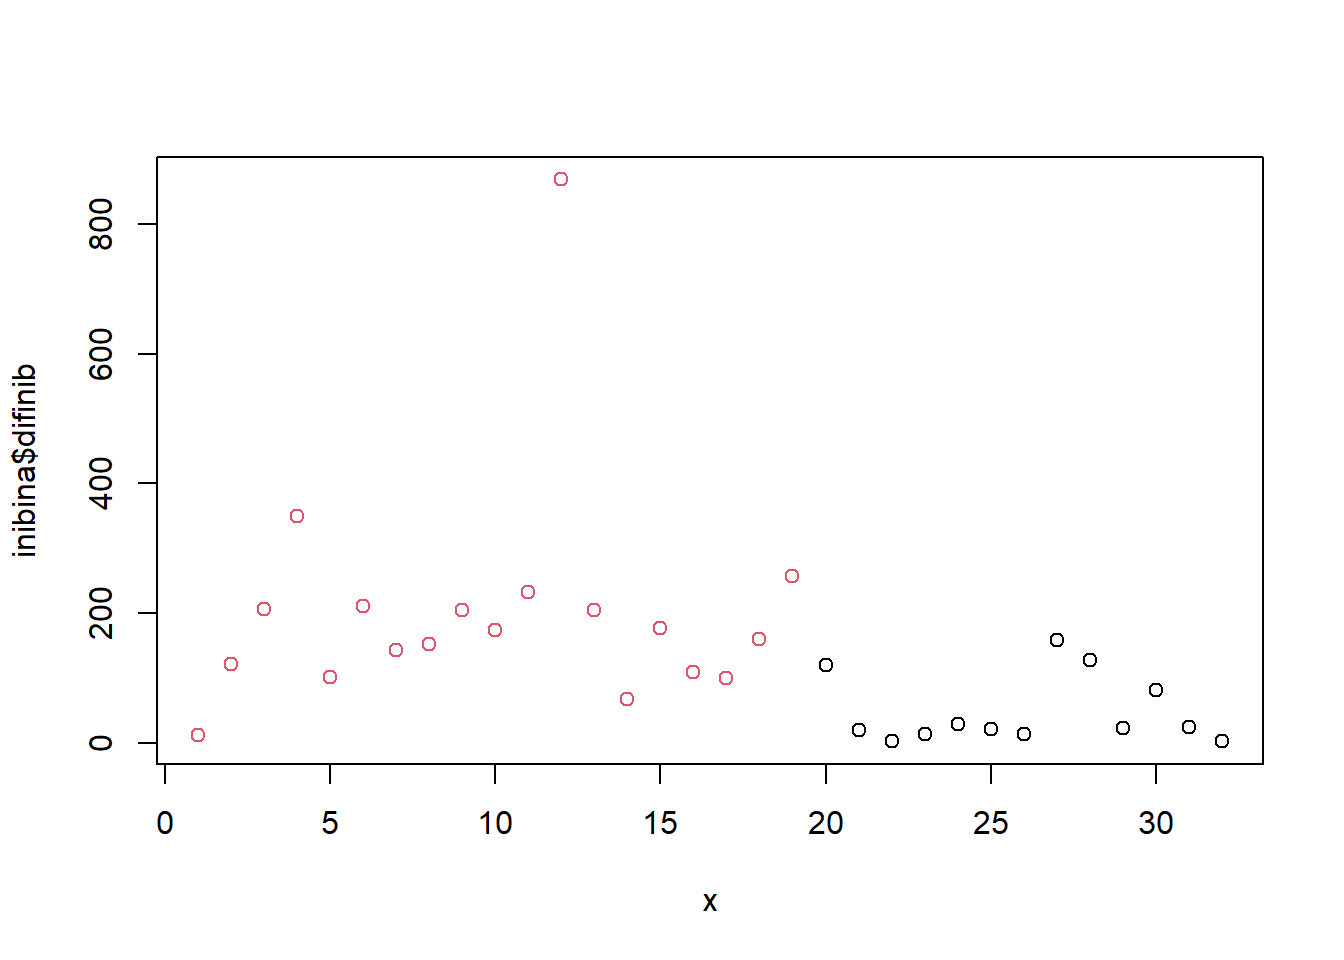
## Max. :32.00 Max. :186.38 Max. :1055.19 Max. :868.81Distribuição:
x = 1:32
plot(inibina$difinib ~ x, col = inibina$resposta)