4 Exploratory data analysis
- Mapping out the underlying structure
- Identifying the most important variables
- Univariate visualizations
- Multivariate visualizations
- Summary tables
4.1 Mapping out the underlying structure
The final dataset has 3704 movie records with 8 variables. movieId shows the identifiers of the related movie on the MovieLens, title shows the original title, budget shows the estimated budget of movie, profit indicates the worldwide gross profit, studio shows the company that releases the movie. The last three numerical columns show the numbers of genders of the first two characters (stars) of the movie.
#> tibble [3,704 x 10] (S3: tbl_df/tbl/data.frame)
#>  $ movieId     : num [1:3704] 1 2 3 4 5 6 9 10 11 16 ...
#>  $ title       : chr [1:3704] "Toy Story" "Jumanji" "Grumpier Old "..
#>  $ year        : num [1:3704] 1995 1995 1995 1995 1995 ...
#>  $ genres      : chr [1:3704] "Adventure|Animation|Children|Comedy"..
#>  $ budget      : num [1:3704] 3.0e+07 6.5e+07 2.5e+07 1.6e+07 3.0e+..
#>  $ profit      : num [1:3704] 3.75e+08 1.98e+08 4.65e+07 6.55e+07 4..
#>  $ studio      : chr [1:3704] "Walt Disney Pictures, Pixar Animati"..
#>  $ star_female : int [1:3704] 0 0 0 2 1 0 0 0 1 1 ...
#>  $ star_male   : int [1:3704] 2 2 2 0 1 2 2 2 1 1 ...
#>  $ star_unknown: int [1:3704] 0 0 0 0 0 0 0 0 0 0 ...
4.2 Identifying the most important variables
The main question is based on the relation of budget with the profit, so most important variables are ww_gross (worldwide income) and budget.
4.3 Univariate and Multivariate Visualizations
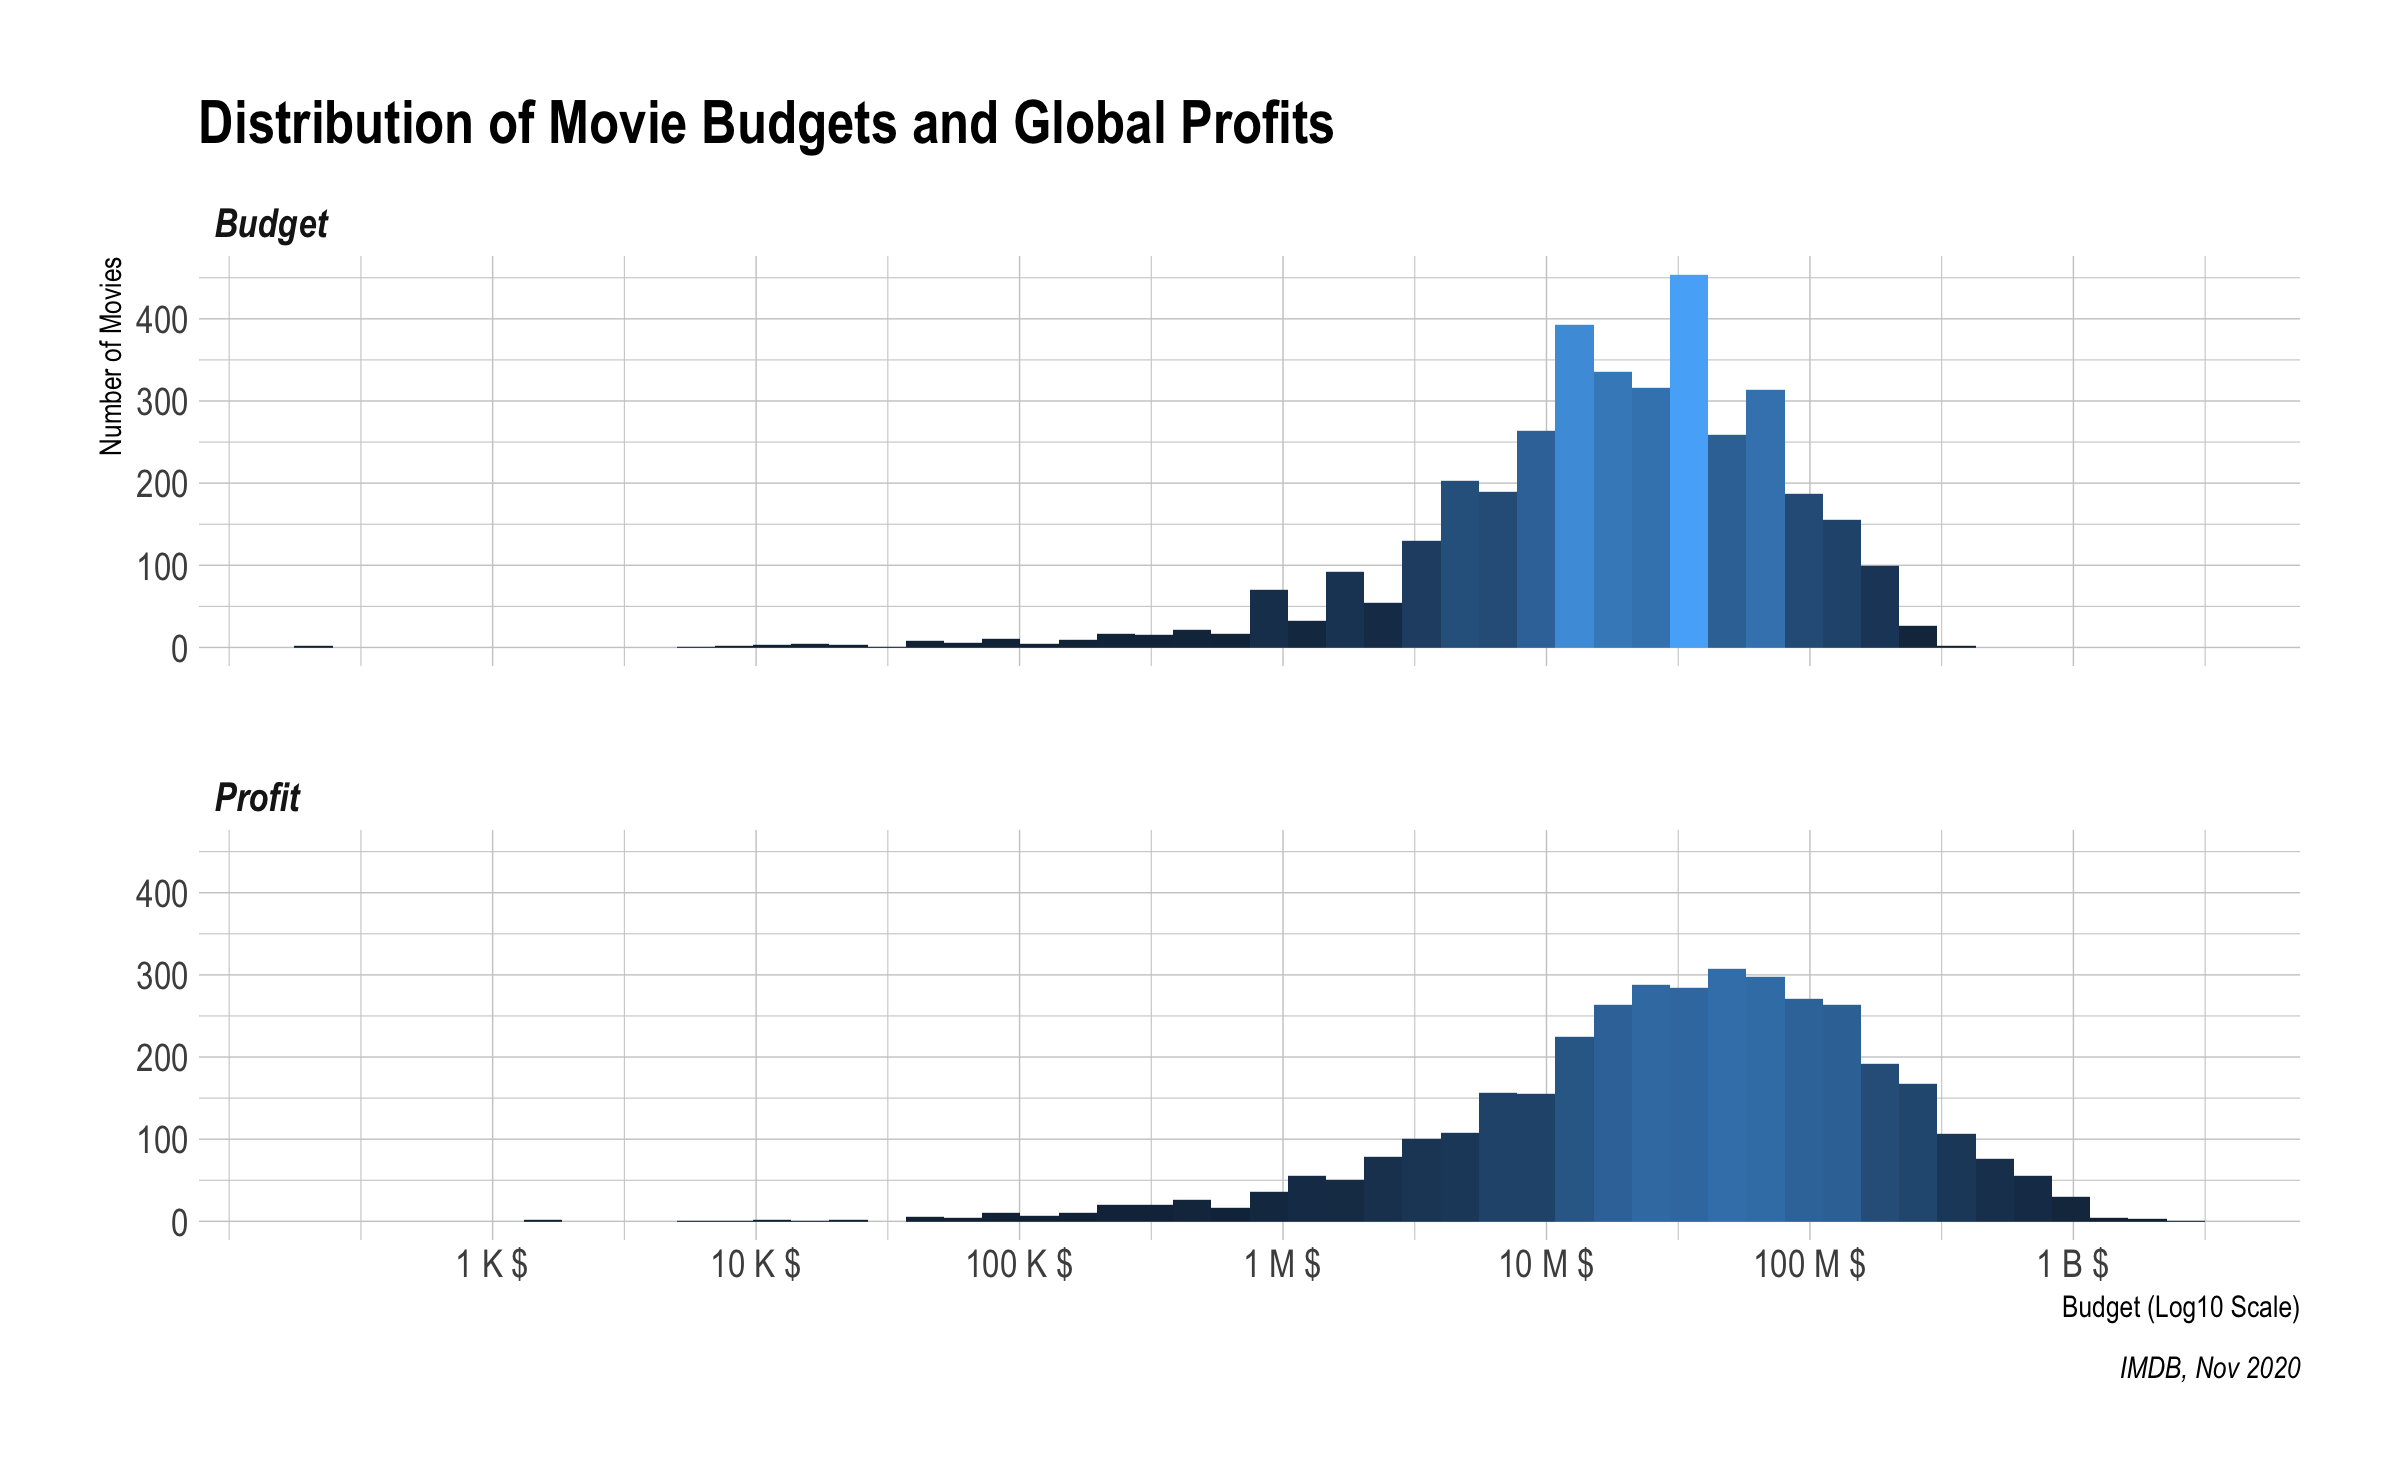
The budgets and worldwide revenues of the films range predominantly between $ 10 million and $ 100 million. Both variables show negative skewness with partially normal distribution.
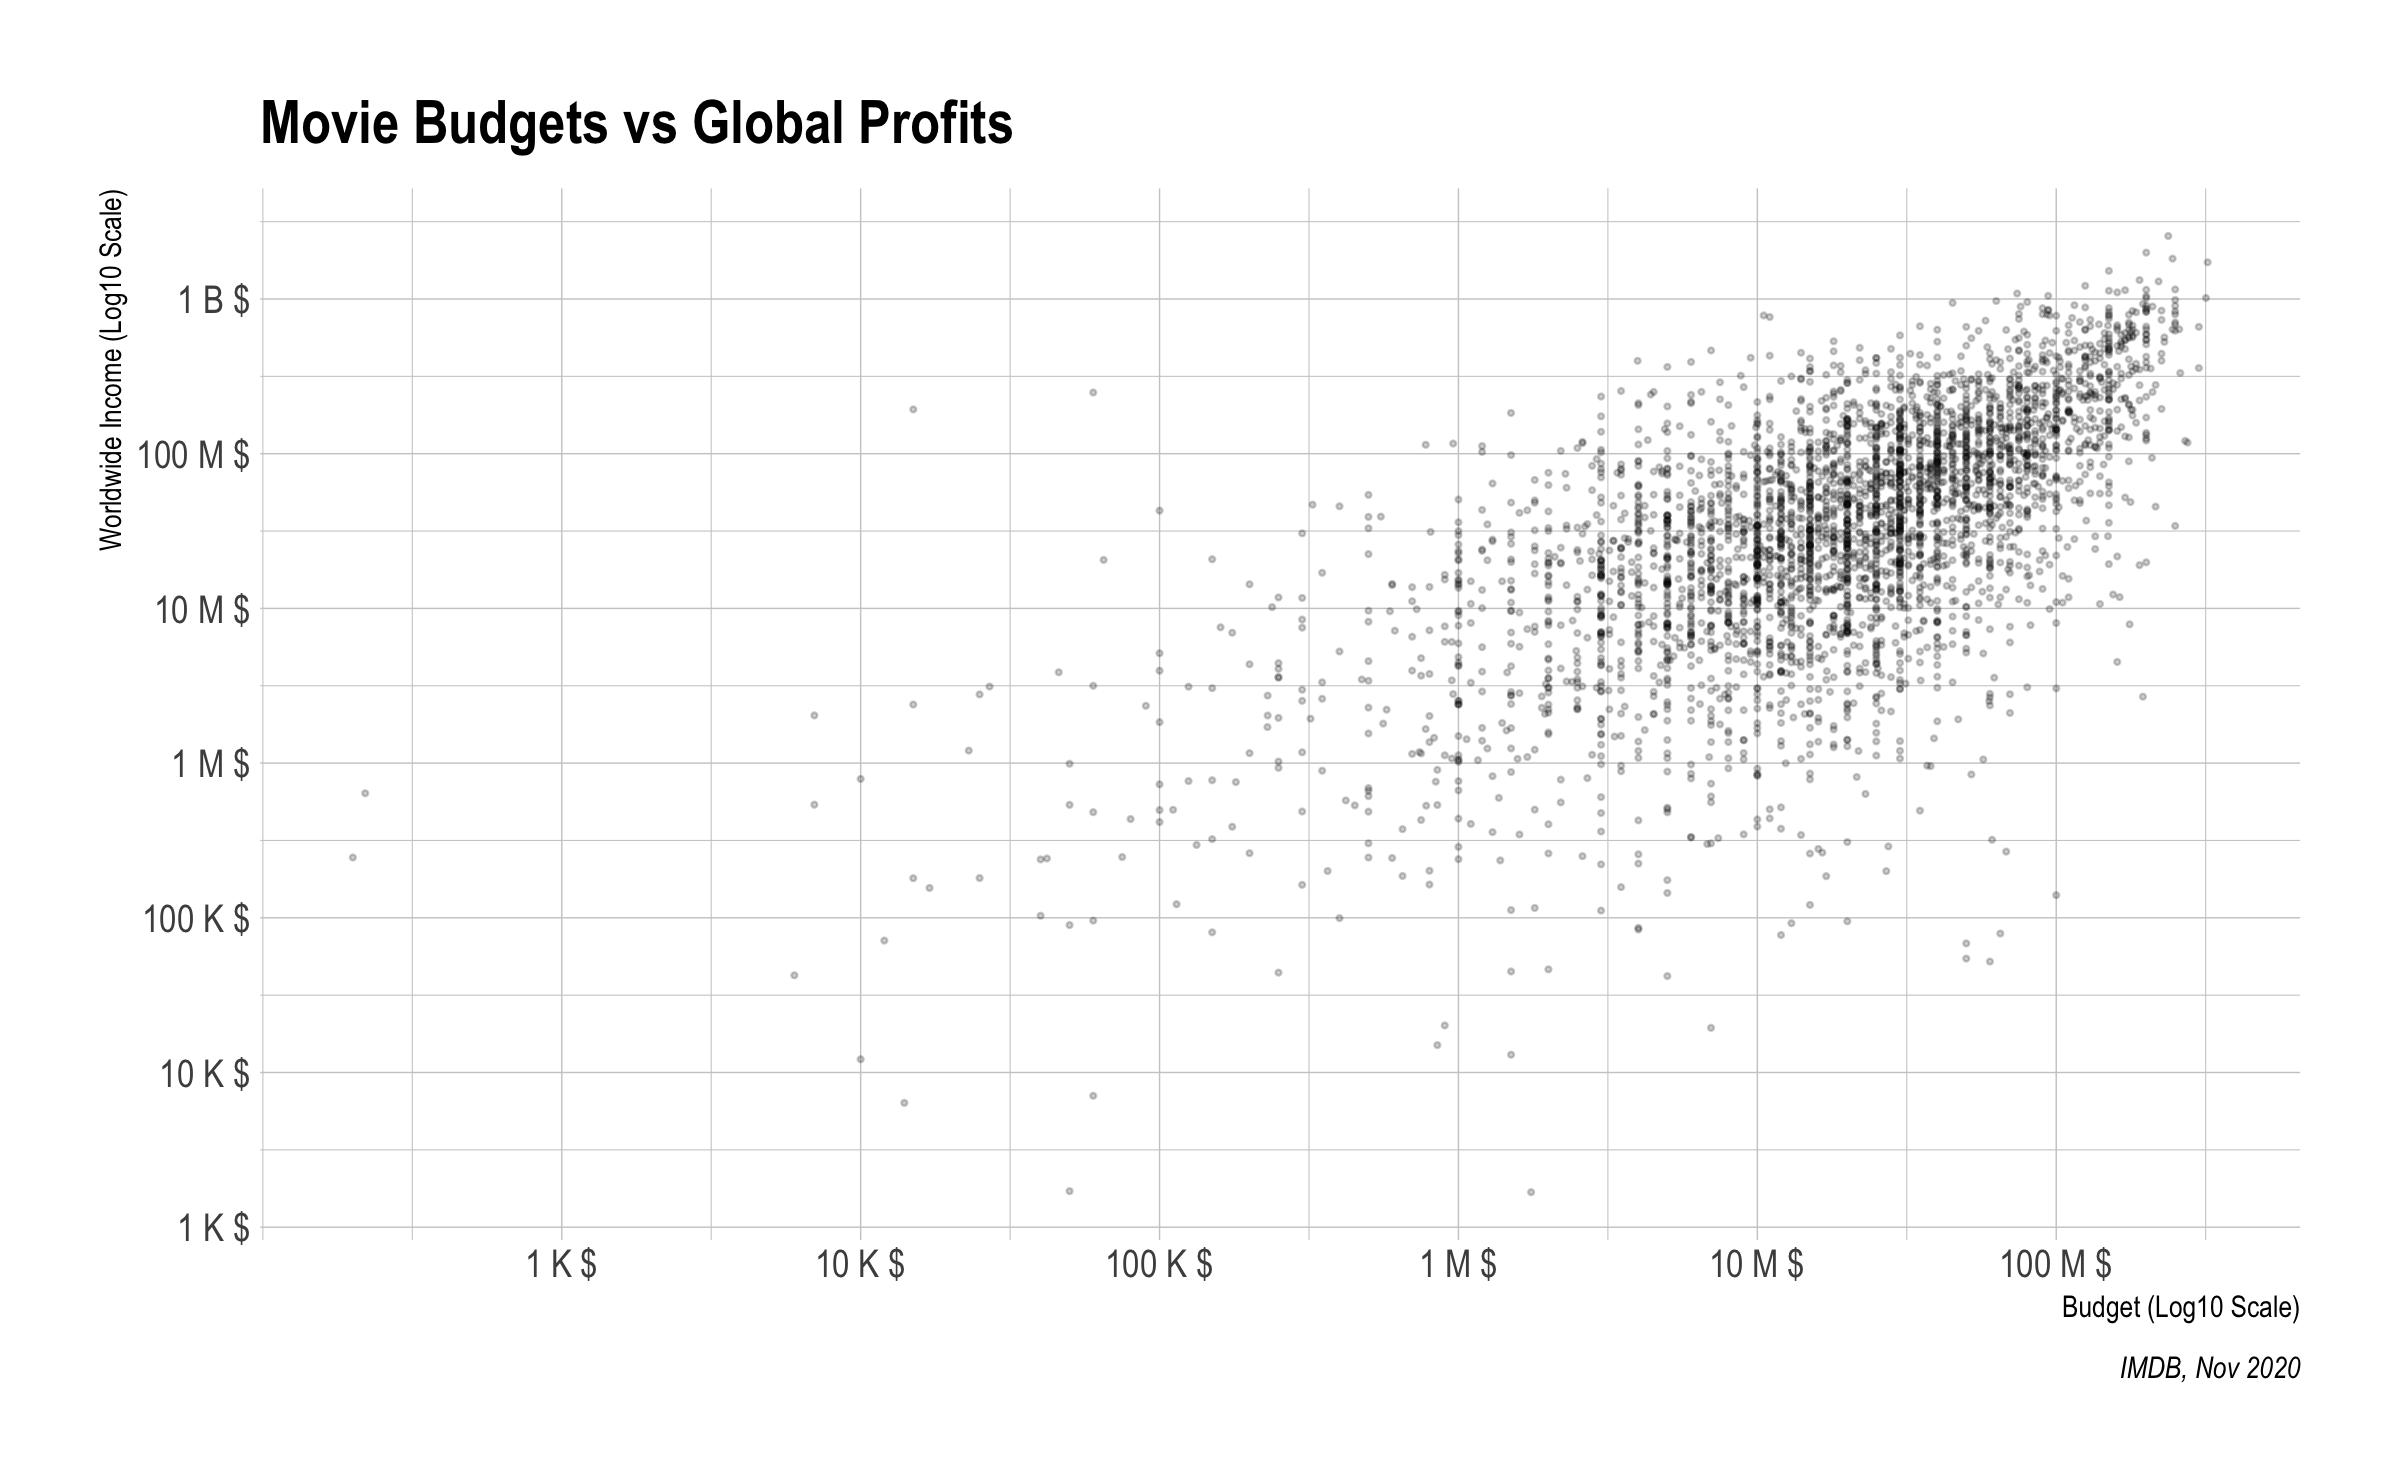
There appears to be a logarithm-scale correlation between film budgets and worldwide revenue.
Warner Bros, Universal Pictures and Columbia Pictures are in the top three when the studios with the most films are ranked.
According to the data used, the top 5 studios make up about 10% of all films shot.
Most of the movies are Drama. This genre is followed by Comedy, Thriller and Action. Documentary and Film-noir genres are the least frequently used tags.
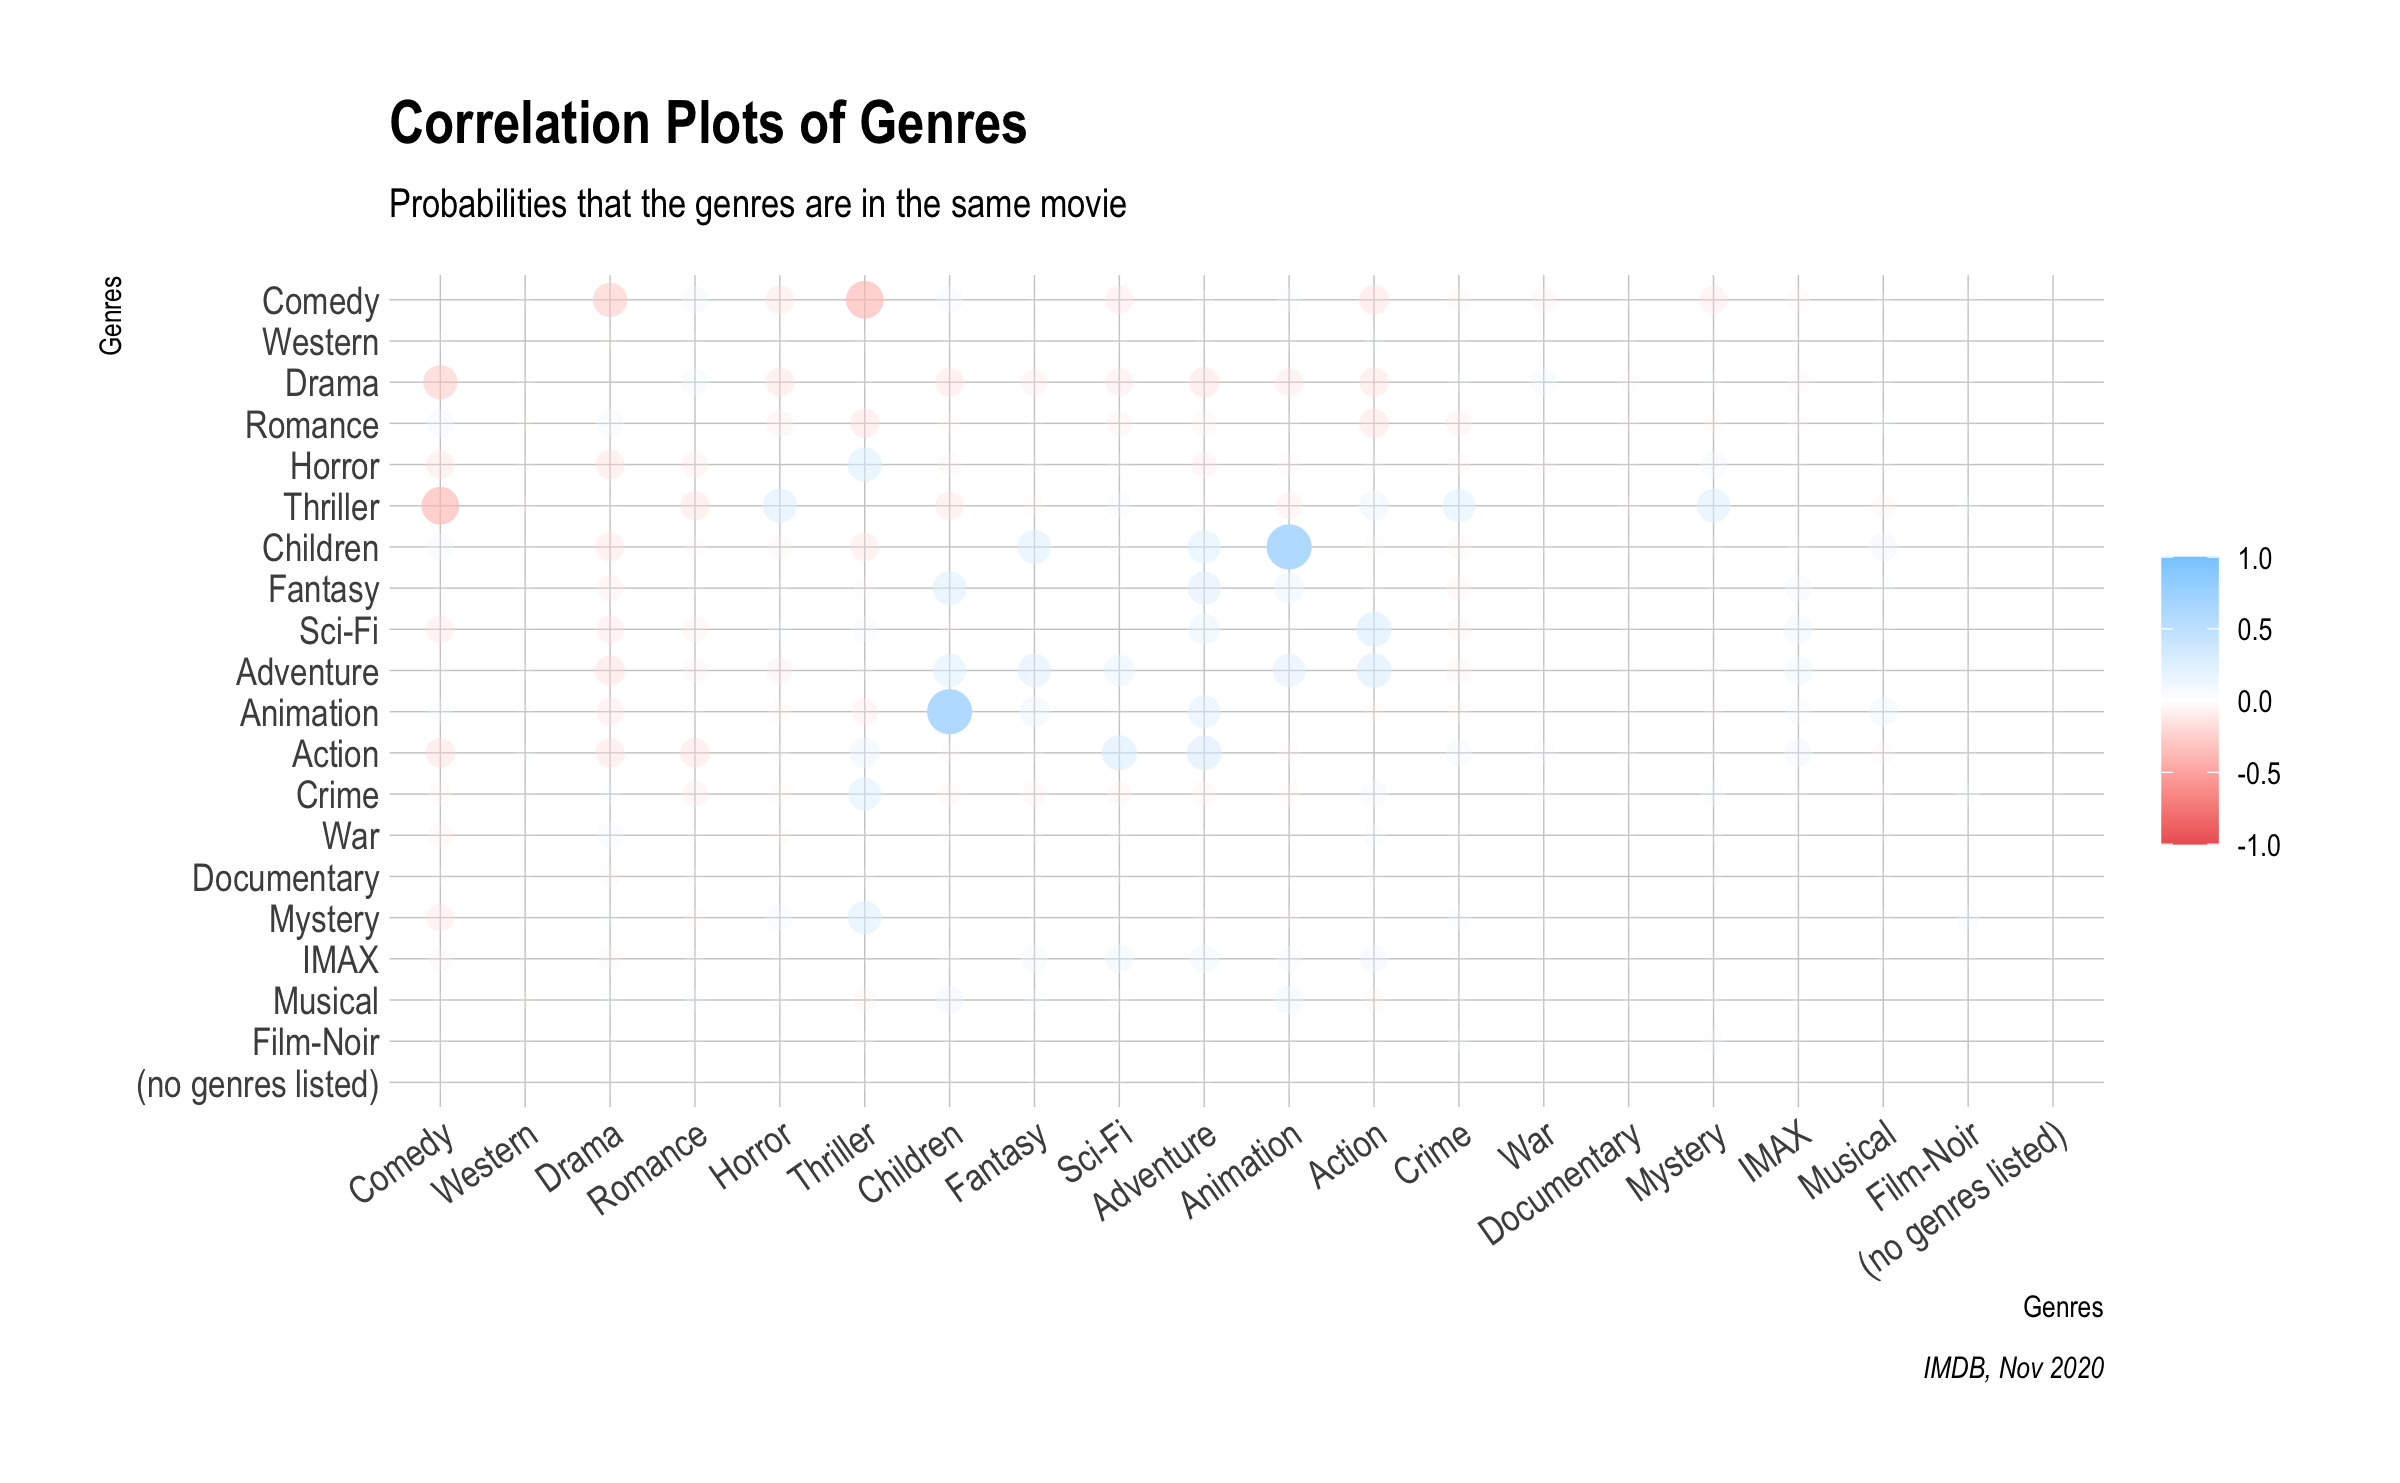
Many films can be defined by more than one genre. In the correlation chart below, the frequency of using the genres together is shown. As expected, the Children and Animation genres are often used together, while Thriller and Comedy are rarely used together.
4.4 Summary Tables
The summary table below includes the number of movies produced by each studio (n_movies), the average of their budget (mean_budget) and their standard deviation (sd_budget), the average of their income (mean_income) and the standard deviation (sd_income).
The table below contains the numerical and financial summaries of the films according to the gender combination of the stars in the film.
The summary table below includes the number of movies tagged with each genres (n_movies), the average of their budget (mean_budget) and their standard deviation (sd_budget), the average of their income (mean_income) and the standard deviation (sd_income).