9 Missing data patterns: looking for these patterns might sometimes be useful, to determine which variables to sensibly include in the light of missing data
Data Wrangling Recipes in R: Hilary Watt and Tristan Naidoo.
Pot holes in the road were caused by people seeing good clay in the road, that would make an ideal pot.
Note: Many of the same date might occasionally represent missing data for that date. You would ideally be told missing data codes when you get your data set. Codes such as 9, 999, 9999 are common, as are negative numbers, such as -1, -2, -3. Sometimes these indicate different types of missing data. For many purposes, it may be okay to recode each to the missing data code NA. However, it is useful to carefully consider how each type of missing data might affect the results (perhaps in discussion alone, rather than necessarily in analysis methods). Remember to code to NA (as described in Chapter 1).
There is also a code NaN (not a number, such as result of calculation 0/0). Also -Inf and Inf (minus and plus infinity), which affect mean values, so you probably would choose to recode to NA.
Always keep a track on how much missing data each variable has. If two variables measure very similar things, then it may be best to use the one with least missing data. If one variable has a lot of missing data, then it may not be useful. If it is considered important, then remember that including it into an analysis might dramatically reduce the sample size available for analysis.
If a lot of data is missing, then we need to consider why this might be. Is it likely that this biases our results, for instance if those with missing data are likely to be different to those with data present.
Looking at the pattern of missing data will help to determine whether, for instance, there are a few people with lots of missing data, or whether the people with missing data are different for each variable. This helps to inform strategies for what variables would sensibly be used in different analyses, taking account of how much data is missing.
Remember the need to install packages first (install.packages(“visdat”)), if you have not already done so (required once per computer).
# required for this – firstly need to install this package
library(visdat)
# shows pattern of missing data in anaemia data-frame – whether a few people
# have lots of missing data, or whether missing data is spread fairly evenly
# between people.
vis_miss(anaemia[, c("hb_pre", "hb_post", "weight", "height")]) # chosen subset of variables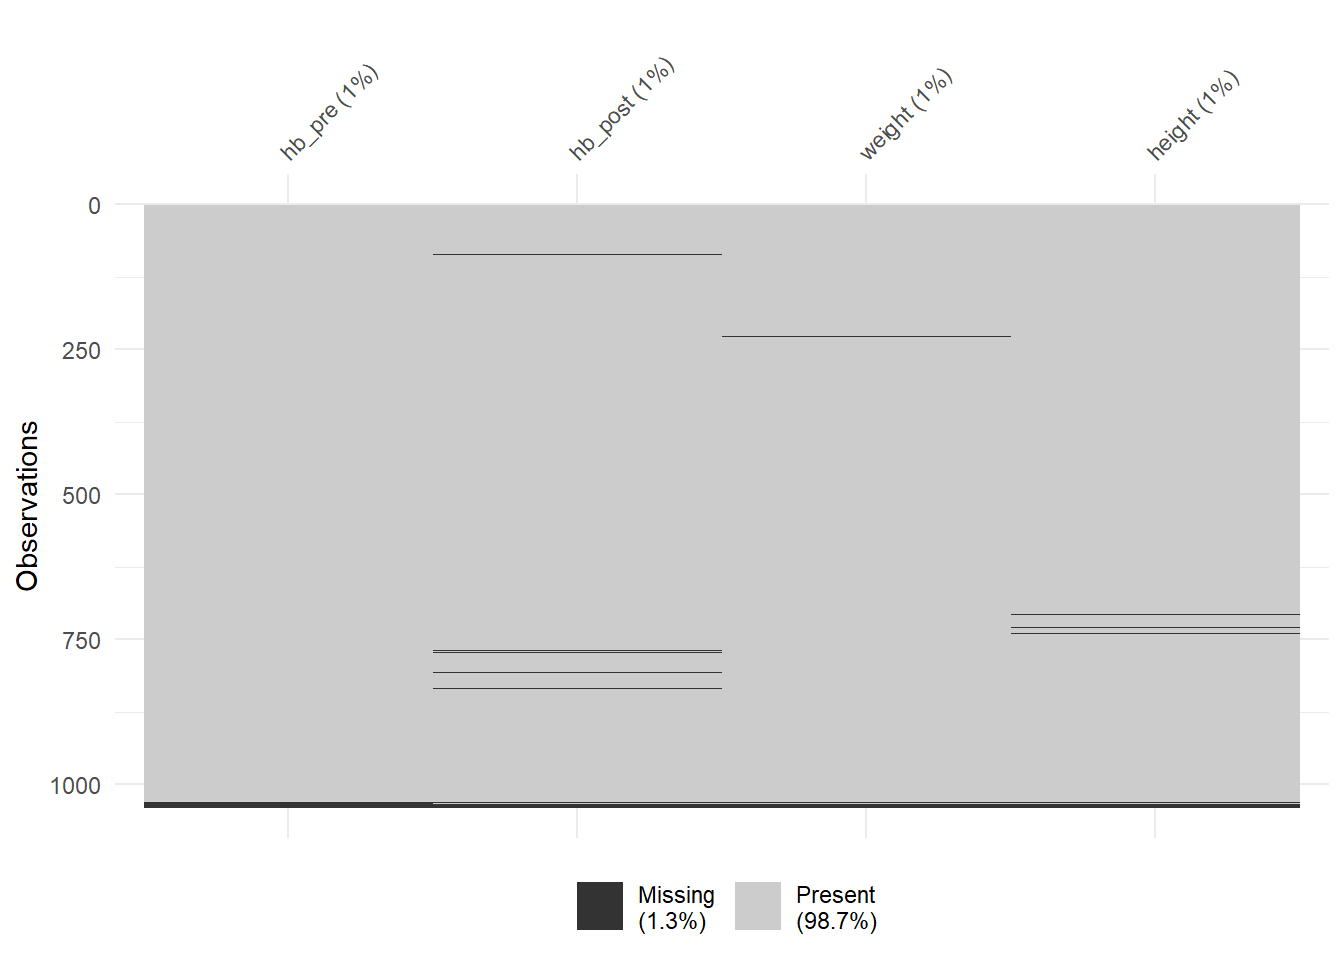
vis_miss(anaemia) + # all variables
theme(axis.text.x = element_text(angle = 90)) # make x labels 90 degrees for readability 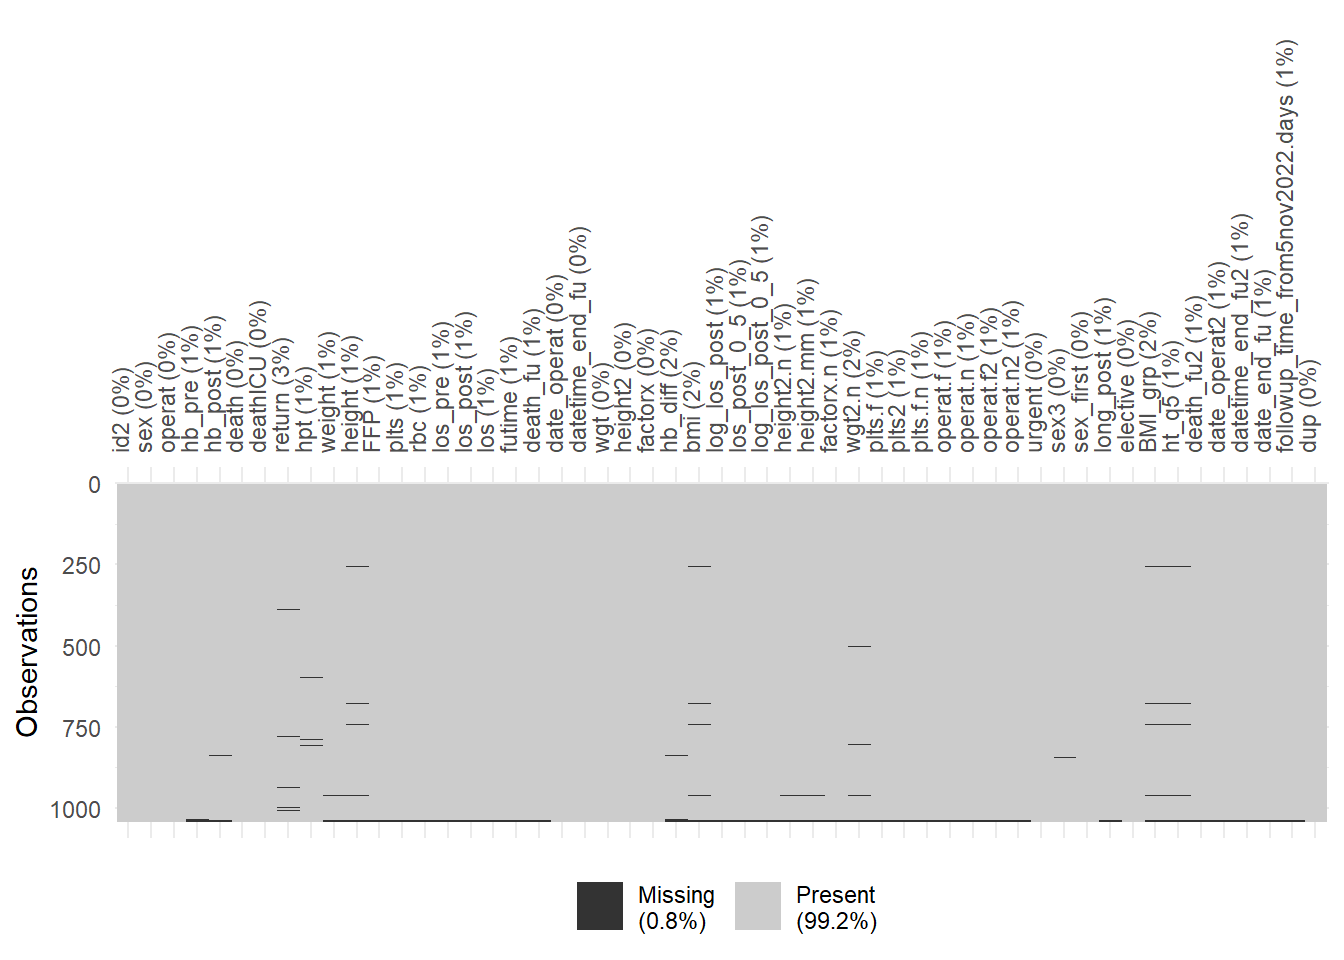
Note: the black lines at the bottom indicate a few rows with a lot of missing data. The lack of dark lines in most rows indicates data that is far more complete than many data sets. Shows only values coded as NA.
##
## FALSE  TRUE
## 54689 431##
## FALSE TRUE
## 1029 11The main dataset is called anaemia, available here: https://github.com/hcwatt/data_wrangling_open.
Data Wrangling Recipes in R: Hilary Watt and Tristan Naidoo. Imperial College London.