3.1 Cash Rate
I measure how monthly policy moves map into owner-occupier variable mortgage rates. I take the cash rate target straight from RBA F1.1 (monthly) and a variable for housing rates (New loans, in the month) from RBA F6 (monthly). I work in first differences and allow asymmetric pass-through by splitting hikes and cuts. No structural breaks here—this is a reduced-form transmission. The sample size is extremely low so I am not expecting overly insightful results.
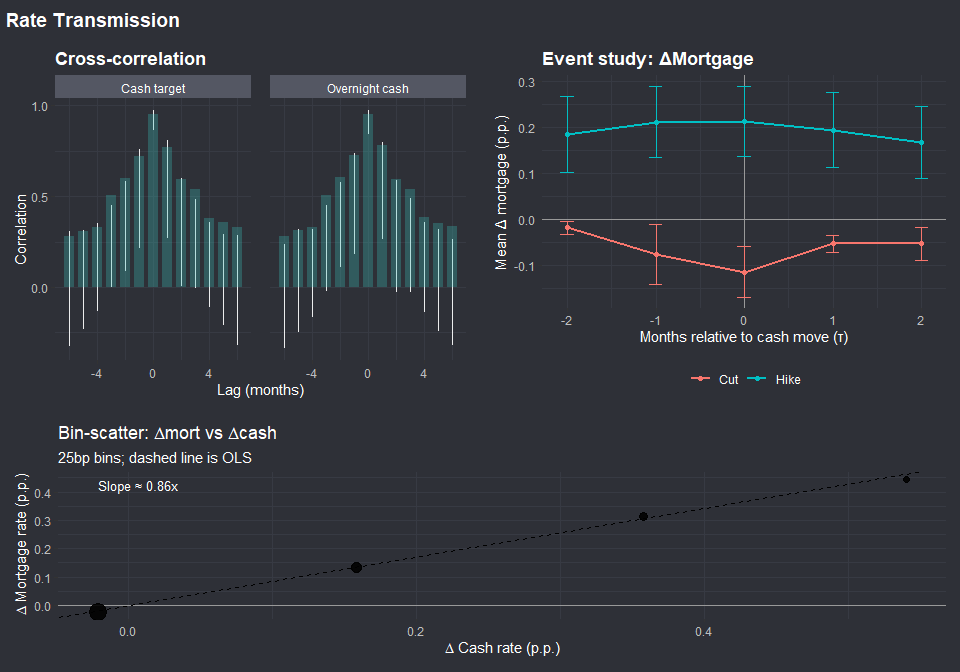
I checked for evidence before going to the parametric model. A cross-correlogram shows when cash moves, now vs next month. An event study lines months up on actual decisions and lets me see hike–cut asymmetry cleanly. A bin-scatter of a change in mortgage rate vs change in cash rate gives a slope-at-a-glance before running regressions.
I’m using the monthly (month-end to month-end) change in the cash rate and mortgage rates because decisions fall within months and repricing often happens around month-end; monthly deltas preserve that timing. The mortgage series are from RBA F6:
- OO New = Owner-occupied, new loans funded in the month (all institutions);
- OO Stock = Owner-occupied, outstanding stock;
- INV New = Investor, new loans funded in the month;
- INV Stock = Investor, outstanding stock.
| OO New | OO Stock | INV New | INV Stock | |
|---|---|---|---|---|
| * p < 0.1, ** p < 0.05, *** p < 0.01 | ||||
| Δ Cash target (p.p.) | 0.786*** | 0.625*** | 0.800*** | 0.635*** |
| (0.051) | (0.031) | (0.051) | (0.032) | |
| Num.Obs. | 72 | 72 | 72 | 72 |
| R2 | 0.914 | 0.898 | 0.923 | 0.893 |
| Std.Errors | OO New | OO Stock | INV New | INV Stock |
| Standard errors | Newey–West (lag=3) | Newey–West (lag=3) | Newey–West (lag=3) | Newey–West (lag=3) |
New loans move about 0.8 p.p. per 1 p.p. cash-rate change, stock moves about 0.6–0.65 p.p. Patterns are similar for OO and INV. In short, most of the move shows up in the same month, with new lending most responsive.
| OO New | OO Stock | INV New | INV Stock | |
|---|---|---|---|---|
| * p < 0.1, ** p < 0.05, *** p < 0.01 | ||||
| Δ Cash target (p.p.) | 0.680*** | 0.548*** | 0.712*** | 0.565*** |
| (0.072) | (0.035) | (0.060) | (0.039) | |
| Δ Cash target (lag 1) | 0.172** | 0.124*** | 0.143*** | 0.112*** |
| (0.066) | (0.024) | (0.052) | (0.029) | |
| Num.Obs. | 71 | 71 | 71 | 71 |
| R2 | 0.942 | 0.920 | 0.941 | 0.912 |
| Std.Errors | OO New | OO Stock | INV New | INV Stock |
| Standard errors | Newey–West (lag=3) | Newey–West (lag=3) | Newey–West (lag=3) | Newey–West (lag=3) |
Allowing a one-month lag adds another ~0.1–0.2 p.p., pushing cumulative 0–1 month pass-through to ~0.85 for new loans and ~0.67 for stock. That gap is consistent with fixed-rate shares and slower repricing on existing books.Shortfall likely comes from fixed-rate contracts, pricing frictions, and timing of refixes, as we would expect. I was keen to see what the pass through rate was. From my time in Ireland I seen that the banks were slow to pass on hikes, there was some hangover from the financial crash and local factors driving that, but I understand it’s not always so straightforward.