5 ADI Level Data
High-Quality Liquid Assets (HQLA), under Basel III (and APS 210 in Australia), banks must hold a stock of unencumbered HQLA that can be sold or repo’d in stress BIS HQLA (June 2020). In order to qualify as HQLA, assets should be liquid in markets during a time of stress and, ideally, be central bank eligible. “The LCR (Liquidity Coverage Ratio) numerator is this stock of HQLA (Levels 1, 2A, 2B), strictly limited to the asset types set out in the standard/attachments. Not every “cash-like” or “security” position qualifies”. The other component of LCR (denominator) is the Total net cash outflows over 30 days. As per the Basel accords the floor is 100%. The Australian prudential standard is APS 210.
As Australia historically had limited government securities outstanding, the RBA provided a fee-paid Committed Liquidity Facility (CLF) from 2015 to 2022 Rustia et al, RBA (Jan 2024). The authors point out that “the amount of government debt on issue and system liquidity increased significantly due to fiscal and monetary policy measures implemented to support the Australian economy during the COVID-19 pandemic”. I’ve accessed the APRA EFS Monthly ADI Statistics, which is institutional level balance sheet items, I analyse the figures with these prudential measures in mind. The dataset does not set out HQLA buckets, I try to get an understanding of the dataset by running ratios with the data available.
Deriving a proxy will likely bundle assets of different Tiers/qualtiy into an aggregate. - So I’ll refrane from referring to HQLA where I cannot confirm the fact. In keeping with the theme of this document, I’ll focus on housing assets.
I have made a liquid asset proxy from “Cash and deposits with financial institutions”, “Trading securities”, “Investment securities”. Where I refer to housing assets I’ve taken “Loans to households: Housing: Owner-occupied”. I’ve derived a housing asset to liquid asset (proxy) HALA ratio.
First I will introduce the top 15 ADIs by this liquid asset proxy, also displaying the above ratio.
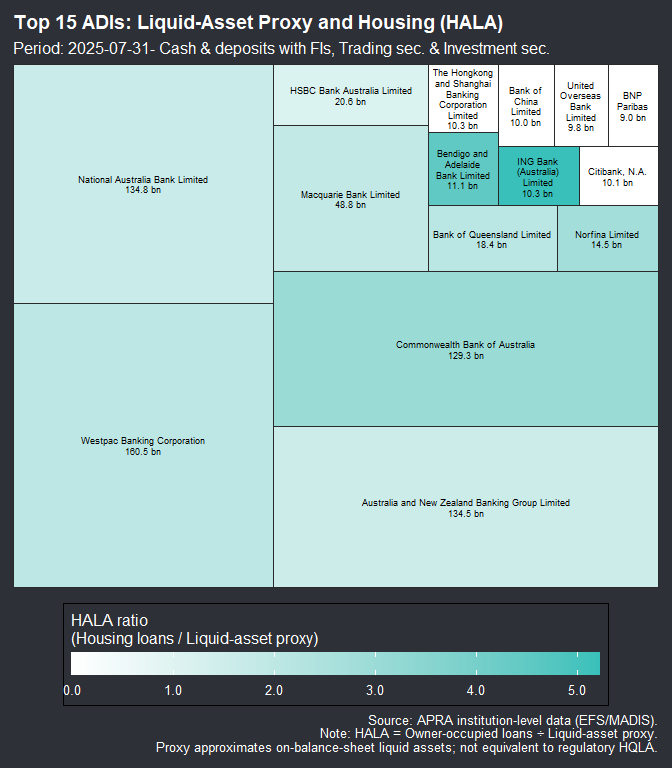
I thought I may have been misrepresenting CBAs size at first glance, given its valuation I had assumed it would be larger. Balance sheet variance and approach to risk and investments is surely a consideration, one which I am not well versed in. Commentary in the AFR suggest that the valuation is bullish given the other banks. With a P/E of 30 compared to 13-16 times compared to the other big three circa July. The purpose of this is not to analyse the banks shares or their market valuation. I’ll take a look at the composition of the LA to better understand this before returning to the HA portion of the ratio.