5 模型可视化
代码提供: 胡慧怡 何舒欣 李清仪 于芊
5.1 PartI
library(modelsummary)
url <- 'https://vincentarelbundock.github.io/Rdatasets/csv/HistData/Guerry.csv'
dat <- read.csv(url)
dat$Small <- dat$Pop1831 > median(dat$Pop1831)
#数据的快速概述
datasummary_skim(dat)| Unique (#) | Missing (%) | Mean | SD | Min | Median | Max | ||
|---|---|---|---|---|---|---|---|---|
| X | 86 | 0 | 43.5 | 25.0 | 1.0 | 43.5 | 86.0 | |
| dept | 86 | 0 | 46.9 | 30.4 | 1.0 | 45.5 | 200.0 | |
| Crime_pers | 85 | 0 | 19754.4 | 7504.7 | 2199.0 | 18748.5 | 37014.0 | |
| Crime_prop | 86 | 0 | 7843.1 | 3051.4 | 1368.0 | 7595.0 | 20235.0 | |
| Literacy | 50 | 0 | 39.3 | 17.4 | 12.0 | 38.0 | 74.0 | |
| Donations | 85 | 0 | 7075.5 | 5834.6 | 1246.0 | 5020.0 | 37015.0 | |
| Infants | 86 | 0 | 19049.9 | 8820.2 | 2660.0 | 17141.5 | 62486.0 | |
| Suicides | 86 | 0 | 36522.6 | 31312.5 | 3460.0 | 26743.5 | 163241.0 | |
| Wealth | 86 | 0 | 43.5 | 25.0 | 1.0 | 43.5 | 86.0 | |
| Commerce | 84 | 0 | 42.8 | 25.0 | 1.0 | 42.5 | 86.0 | |
| Clergy | 85 | 0 | 43.4 | 25.0 | 1.0 | 43.5 | 86.0 | |
| Crime_parents | 86 | 0 | 43.5 | 25.0 | 1.0 | 43.5 | 86.0 | |
| Infanticide | 81 | 0 | 43.5 | 24.9 | 1.0 | 43.5 | 86.0 | |
| Donation_clergy | 86 | 0 | 43.5 | 25.0 | 1.0 | 43.5 | 86.0 | |
| Lottery | 86 | 0 | 43.5 | 25.0 | 1.0 | 43.5 | 86.0 | |
| Desertion | 86 | 0 | 43.5 | 25.0 | 1.0 | 43.5 | 86.0 | |
| Instruction | 82 | 0 | 43.1 | 24.8 | 1.0 | 41.5 | 86.0 | |
| Prostitutes | 63 | 0 | 141.9 | 521.0 | 0.0 | 33.0 | 4744.0 | |
| Distance | 86 | 0 | 208.0 | 109.3 | 0.0 | 200.6 | 539.2 | |
| Area | 84 | 0 | 6147.0 | 1398.2 | 762.0 | 6070.5 | 10000.0 | |
| Pop1831 | 86 | 0 | 378.6 | 148.8 | 129.1 | 346.2 | 989.9 |
#平衡表(又名“表1”),各子组的平均值不同:
datasummary_balance(~Small, dat)
## Warning in sanitize_datasummary_balance_data(formula, data): These variables
## were omitted because they include more than 50 levels: Department.## Warning in datasummary_balance(~Small, dat): Please install the `estimatr`
## package or set `dinm=FALSE` to suppress this warning.| Mean | Std. Dev. | Mean | Std. Dev. | ||
|---|---|---|---|---|---|
| X | 41.4 | 27.4 | 45.6 | 22.3 | |
| dept | 46.0 | 36.6 | 47.7 | 23.0 | |
| Crime_pers | 18040.6 | 7638.4 | 21468.2 | 7044.3 | |
| Crime_prop | 8422.5 | 3406.7 | 7263.7 | 2559.3 | |
| Literacy | 37.9 | 19.1 | 40.6 | 15.6 | |
| Donations | 7258.5 | 6194.1 | 6892.6 | 5519.0 | |
| Infants | 20790.2 | 9363.5 | 17309.6 | 7973.0 | |
| Suicides | 42565.4 | 37074.1 | 30479.8 | 23130.9 | |
| Wealth | 51.0 | 23.9 | 36.0 | 23.9 | |
| Commerce | 42.7 | 24.6 | 43.0 | 25.7 | |
| Clergy | 39.1 | 26.7 | 47.7 | 22.7 | |
| Crime_parents | 54.2 | 25.2 | 32.8 | 19.9 | |
| Infanticide | 37.9 | 25.7 | 49.1 | 23.1 | |
| Donation_clergy | 52.3 | 24.0 | 34.7 | 22.9 | |
| Lottery | 54.8 | 23.0 | 32.2 | 21.7 | |
| Desertion | 41.7 | 25.9 | 45.3 | 24.2 | |
| Instruction | 46.7 | 26.7 | 39.6 | 22.5 | |
| Prostitutes | 52.8 | 93.1 | 230.9 | 724.1 | |
| Distance | 228.7 | 116.7 | 187.2 | 98.4 | |
| Area | 5989.0 | 1142.8 | 6305.0 | 1612.4 | |
| Pop1831 | 272.4 | 53.4 | 484.8 | 137.3 | |
| N | Pct. | N | Pct. | ||
| Region | C | 13 | 30.2 | 4 | 9.3 |
| E | 9 | 20.9 | 8 | 18.6 | |
| N | 4 | 9.3 | 13 | 30.2 | |
| S | 12 | 27.9 | 5 | 11.6 | |
| W | 4 | 9.3 | 13 | 30.2 | |
| NA | 1 | 2.3 | 0 | 0.0 | |
| MainCity | 1:Sm | 10 | 23.3 | 0 | 0.0 |
| 2:Med | 33 | 76.7 | 33 | 76.7 | |
| 3:Lg | 0 | 0.0 | 10 | 23.3 |
#相关表
datasummary_correlation(dat)| X | dept | Crime_pers | Crime_prop | Literacy | Donations | Infants | Suicides | Wealth | Commerce | Clergy | Crime_parents | Infanticide | Donation_clergy | Lottery | Desertion | Instruction | Prostitutes | Distance | Area | Pop1831 | |
|---|---|---|---|---|---|---|---|---|---|---|---|---|---|---|---|---|---|---|---|---|---|
| X | 1 | . | . | . | . | . | . | . | . | . | . | . | . | . | . | . | . | . | . | . | . |
| dept | .92 | 1 | . | . | . | . | . | . | . | . | . | . | . | . | . | . | . | . | . | . | . |
| Crime_pers | −.12 | −.20 | 1 | . | . | . | . | . | . | . | . | . | . | . | . | . | . | . | . | . | . |
| Crime_prop | −.28 | −.29 | .27 | 1 | . | . | . | . | . | . | . | . | . | . | . | . | . | . | . | . | . |
| Literacy | .09 | .10 | −.04 | −.37 | 1 | . | . | . | . | . | . | . | . | . | . | . | . | . | . | . | . |
| Donations | .06 | .27 | −.04 | −.13 | −.13 | 1 | . | . | . | . | . | . | . | . | . | . | . | . | . | . | . |
| Infants | −.07 | −.03 | −.04 | .27 | −.41 | .17 | 1 | . | . | . | . | . | . | . | . | . | . | . | . | . | . |
| Suicides | −.18 | −.15 | −.13 | .52 | −.37 | −.03 | .29 | 1 | . | . | . | . | . | . | . | . | . | . | . | . | . |
| Wealth | −.08 | −.08 | −.12 | .46 | −.28 | .08 | .34 | .42 | 1 | . | . | . | . | . | . | . | . | . | . | . | . |
| Commerce | −.03 | .05 | .05 | .41 | −.58 | .30 | .39 | .48 | .48 | 1 | . | . | . | . | . | . | . | . | . | . | . |
| Clergy | .15 | .06 | .26 | −.07 | −.17 | .09 | −.06 | −.32 | −.11 | −.12 | 1 | . | . | . | . | . | . | . | . | . | . |
| Crime_parents | −.16 | −.07 | −.20 | .36 | −.20 | −.02 | .06 | .35 | .22 | .18 | −.18 | 1 | . | . | . | . | . | . | . | . | . |
| Infanticide | .01 | −.07 | .27 | −.13 | .32 | −.15 | −.24 | −.08 | −.22 | −.28 | −.01 | −.09 | 1 | . | . | . | . | . | . | . | . |
| Donation_clergy | −.08 | .00 | −.18 | .30 | −.38 | .25 | .10 | .19 | .34 | .18 | .30 | .29 | −.23 | 1 | . | . | . | . | . | . | . |
| Lottery | −.21 | −.11 | .00 | .43 | −.36 | .15 | .42 | .49 | .48 | .45 | −.28 | .28 | −.35 | .36 | 1 | . | . | . | . | . | . |
| Desertion | .10 | .03 | .33 | −.26 | .40 | −.04 | .00 | −.47 | −.23 | −.36 | .25 | −.39 | .11 | −.41 | −.30 | 1 | . | . | . | . | . |
| Instruction | −.10 | −.11 | .05 | .39 | −.98 | .14 | .43 | .36 | .31 | .59 | .21 | .21 | −.32 | .40 | .37 | −.37 | 1 | . | . | . | . |
| Prostitutes | .17 | .14 | −.05 | −.33 | .30 | −.07 | −.28 | −.21 | −.32 | −.27 | .20 | −.03 | .16 | −.04 | −.28 | .04 | −.26 | 1 | . | . | . |
| Distance | −.10 | .04 | −.51 | .25 | −.28 | .08 | .23 | .41 | .40 | .38 | −.31 | .26 | −.16 | .28 | .28 | −.44 | .24 | −.37 | 1 | . | . |
| Area | −.18 | −.08 | .22 | .09 | −.23 | .18 | .16 | .00 | .06 | .18 | .08 | −.20 | −.23 | .02 | .23 | .04 | .20 | −.41 | .06 | 1 | . |
| Pop1831 | .17 | .09 | .27 | −.26 | .09 | .00 | −.23 | −.17 | −.31 | −.05 | .29 | −.40 | .34 | −.22 | −.47 | .11 | −.11 | .48 | −.37 | −.01 | 1 |
#两个变量和两个统计数据,嵌套在子组中
datasummary(Literacy + Commerce ~ Small * (mean + sd), dat)| mean | sd | mean | sd | |
|---|---|---|---|---|
| Literacy | 37.88 | 19.08 | 40.63 | 15.57 |
| Commerce | 42.65 | 24.59 | 42.95 | 25.75 |
#估计一个线性模型并显示结果
mod <- lm(Donations ~ Crime_prop, data = dat)
modelsummary(mod)| Model 1 | |
|---|---|
| (Intercept) | 9065.287 |
| (1738.926) | |
| Crime_prop | −0.254 |
| (0.207) | |
| Num.Obs. | 86 |
| R2 | 0.018 |
| R2 Adj. | 0.006 |
| AIC | 1739.0 |
| BIC | 1746.4 |
| Log.Lik. | −866.516 |
| F | 1.505 |
#估计5个回归模型,并排显示结果,并将它们保存到Microsoft Word文档中
models <- list(
  "OLS 1"     = lm(Donations ~ Literacy + Clergy, data = dat),
  "Poisson 1" = glm(Donations ~ Literacy + Commerce, family = poisson, data = dat),
  "OLS 2"     = lm(Crime_pers ~ Literacy + Clergy, data = dat),
  "Poisson 2" = glm(Crime_pers ~ Literacy + Commerce, family = poisson, data = dat),
  "OLS 3"     = lm(Crime_prop ~ Literacy + Clergy, data = dat)
)
modelsummary(models, output = "table.docx")
5.2 PartII
url <- 'https://vincentarelbundock.github.io/Rdatasets/csv/palmerpenguins/penguins.csv'
dat <- read.csv(url)

# rescale mm -> cm
dat$bill_length_cm <- dat$bill_length_mm / 10
dat$flipper_length_cm <- dat$flipper_length_mm / 10

mod <- lm(bill_length_cm ~ flipper_length_cm + species, data = dat)
library(modelsummary)

modelplot(mod)
modelplot(mod, coef_omit = 'Interc')
cm <- c('speciesChinstrap' = 'Chinstrap',
        'speciesGentoo' = 'Gentoo',
        'flipper_length_cm' = 'Flipper length (cm)')

modelplot(mod, coef_map = cm)
models <- list(
  "Small model" = lm(bill_length_cm ~ flipper_length_cm, data = dat),
  "Medium model" = lm(bill_length_cm ~ flipper_length_cm + body_mass_g, data = dat),
  "Large model" = lm(bill_length_cm ~ flipper_length_cm + body_mass_g + species, data = dat))

modelsummary(models, statistic = 'conf.int')| Small model | Medium model | Large model | |
|---|---|---|---|
| (Intercept) | −0.726 | −0.344 | 0.984 |
| [−1.356, −0.097] | [−1.245, 0.557] | [0.215, 1.752] | |
| flipper_length_cm | 0.255 | 0.222 | 0.095 |
| [0.224, 0.286] | [0.158, 0.285] | [0.048, 0.142] | |
| body_mass_g | 0.000 | 0.000 | |
| [0.000, 0.000] | [0.000, 0.000] | ||
| speciesChinstrap | 0.939 | ||
| [0.867, 1.011] | |||
| speciesGentoo | 0.207 | ||
| [0.088, 0.326] | |||
| Num.Obs. | 342 | 342 | 342 |
| R2 | 0.431 | 0.433 | 0.817 |
| R2 Adj. | 0.429 | 0.430 | 0.815 |
| AIC | 369.0 | 369.6 | −12.6 |
| BIC | 380.5 | 385.0 | 10.4 |
| Log.Lik. | −181.499 | −180.813 | 12.313 |
| F | 257.092 | 129.365 | 375.333 |
modelplot(models, coef_omit = 'Interc')
modelplot(models, facet = TRUE)
library(wesanderson)
library(ggplot2)

modelplot(models) +
  labs(x = 'Coefficients',
       y = 'Term names',
       title = 'Linear regression models of "Bill Length (cm)"',
       caption = "Data source: Gorman, Williams & Fraser (2014), packaged for R by @apreshill and @allison_horst") +
  scale_color_manual(values = wes_palette('Darjeeling1'))
modelplot(mod, size = 1, fatten = .7, color = 'darkgreen', linetype = 'dotted') +
  theme_classic()
library(ggplot2)
library(modelsummary)

models <- list(
  lm(vs ~ carb + mpg + cyl, data = mtcars),
  lm(disp ~ carb + mpg + cyl, data = mtcars),
  lm(hp ~ carb + mpg + cyl, data = mtcars))

models <- dvnames(models)
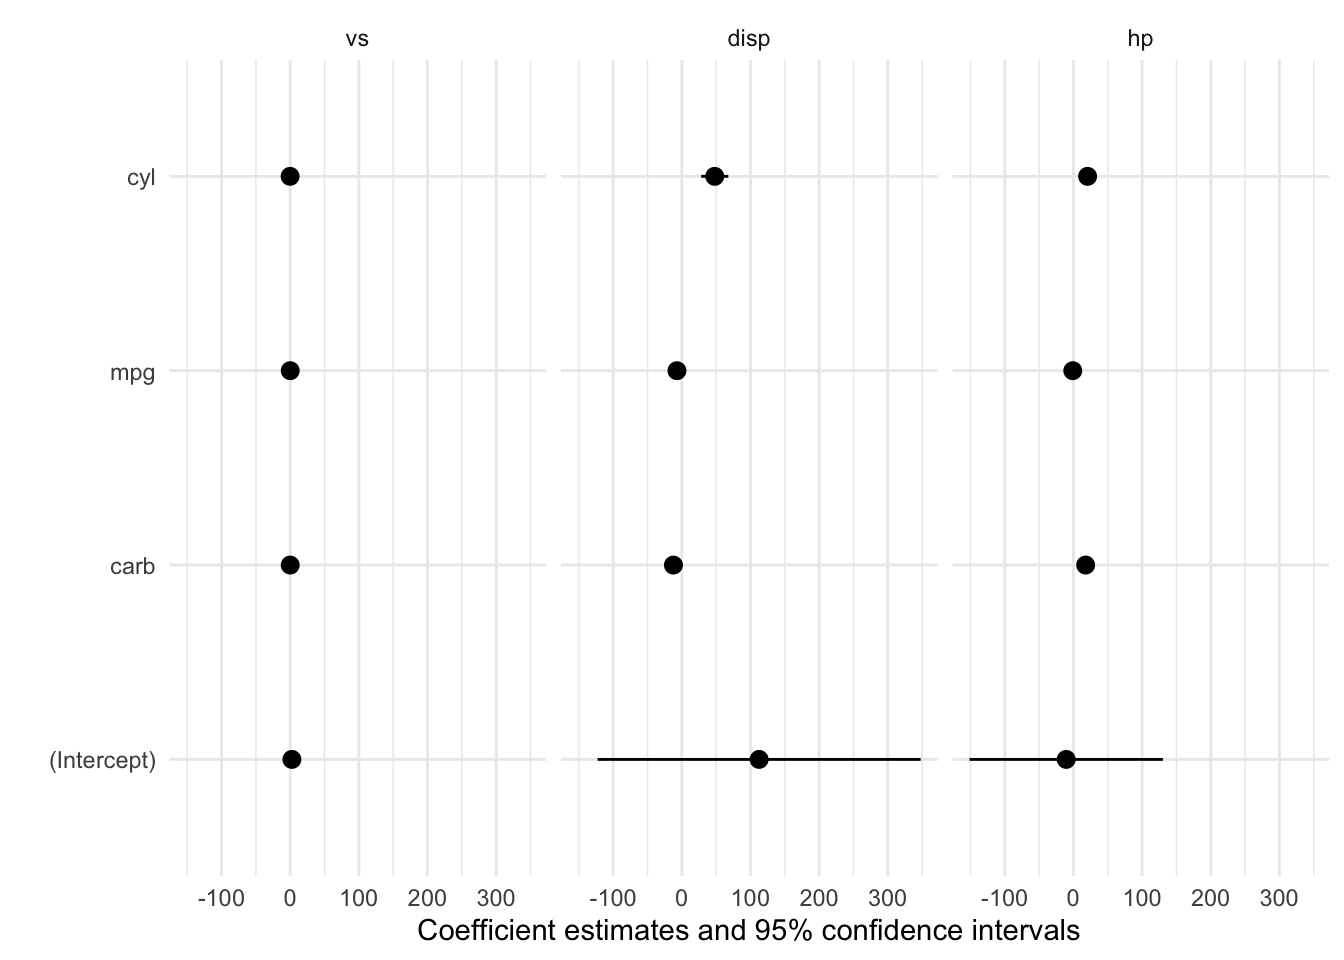
modelplot(models, draw = FALSE)
## term model estimate std.error conf.low conf.high
## 1 (Intercept) vs 2.41742511 0.67622094 1.03224931 3.80260091
## 5 (Intercept) disp 112.57276339 114.86315481 -122.71374324 347.85927003
## 9 (Intercept) hp -10.56116383 68.75946117 -151.40853516 130.28620751
## 2 carb vs -0.06945116 0.03943402 -0.15022810 0.01132577
## 6 carb disp -12.30144724 6.69827859 -26.02224894 1.41935446
## 10 carb hp 17.75593287 4.00972816 9.54237706 25.96948867
## 3 mpg vs -0.01513960 0.01716410 -0.05029868 0.02001947
## 7 mpg disp -7.14964651 2.91550156 -13.12178072 -1.17751230
## 11 mpg hp -1.00486469 1.74527956 -4.57990780 2.57017842
## 4 cyl vs -0.23926135 0.05687969 -0.35577411 -0.12274859
## 8 cyl disp 47.90105842 9.66160634 28.11015499 67.69196184
## 12 cyl hp 20.60581208 5.78363747 8.75856779 32.45305638modelplot(models, color = "black") + facet_grid(~model)
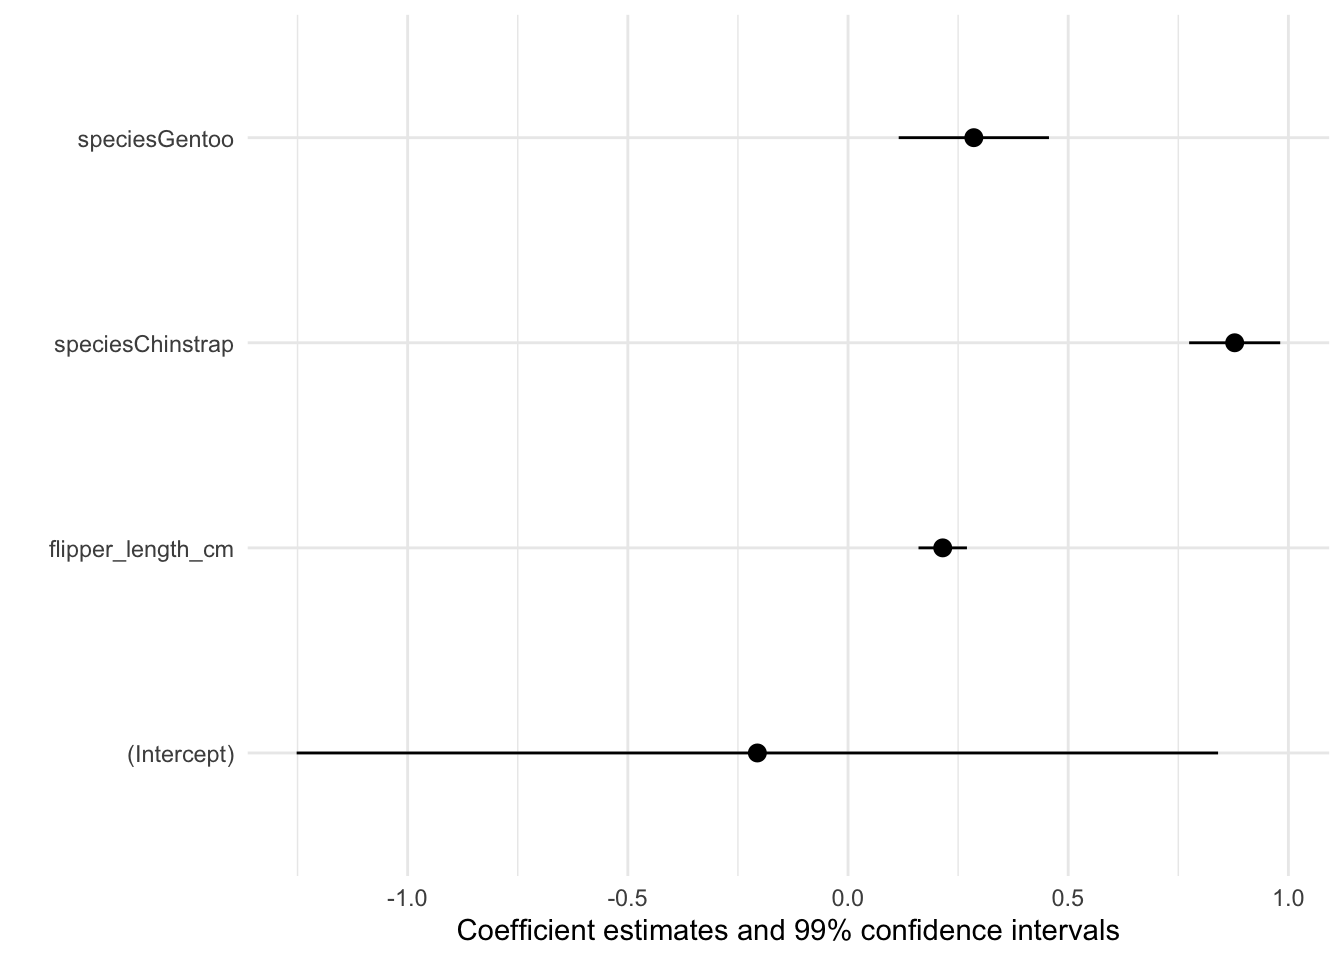
modelplot(mod, conf_level = .99)
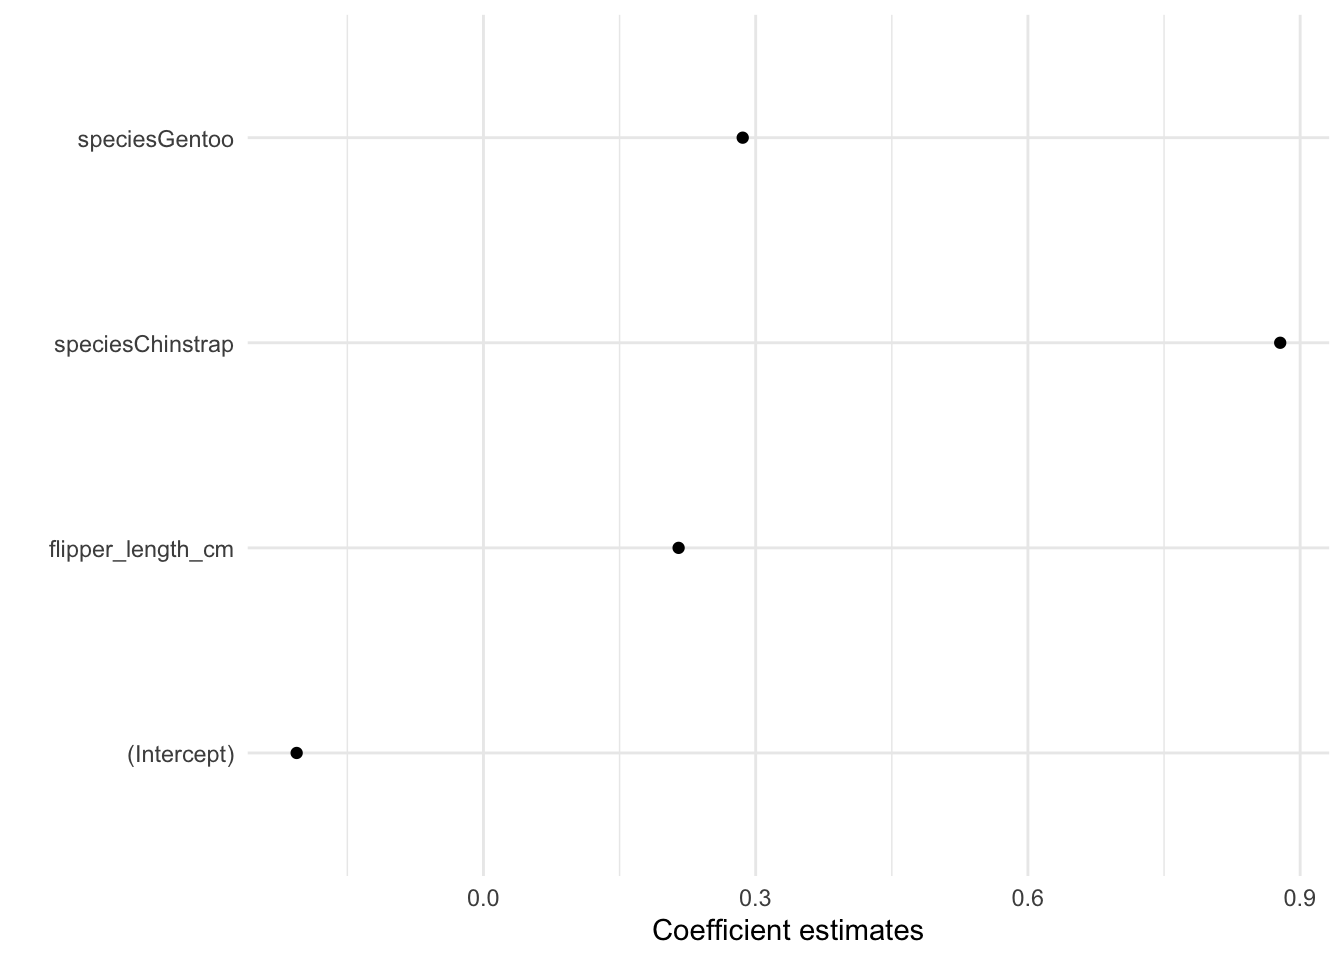
modelplot(mod, conf_level = NULL)
library(ggplot2)

b <- list(geom_vline(xintercept = 0, color = 'orange'),
          annotate("rect", alpha = .1,
                   xmin = -.5, xmax = .5,
                   ymin = -Inf, ymax = Inf),
          geom_point(aes(y = term, x = estimate), alpha = .3,
                     size = 10, color = 'red', shape = 'square'))

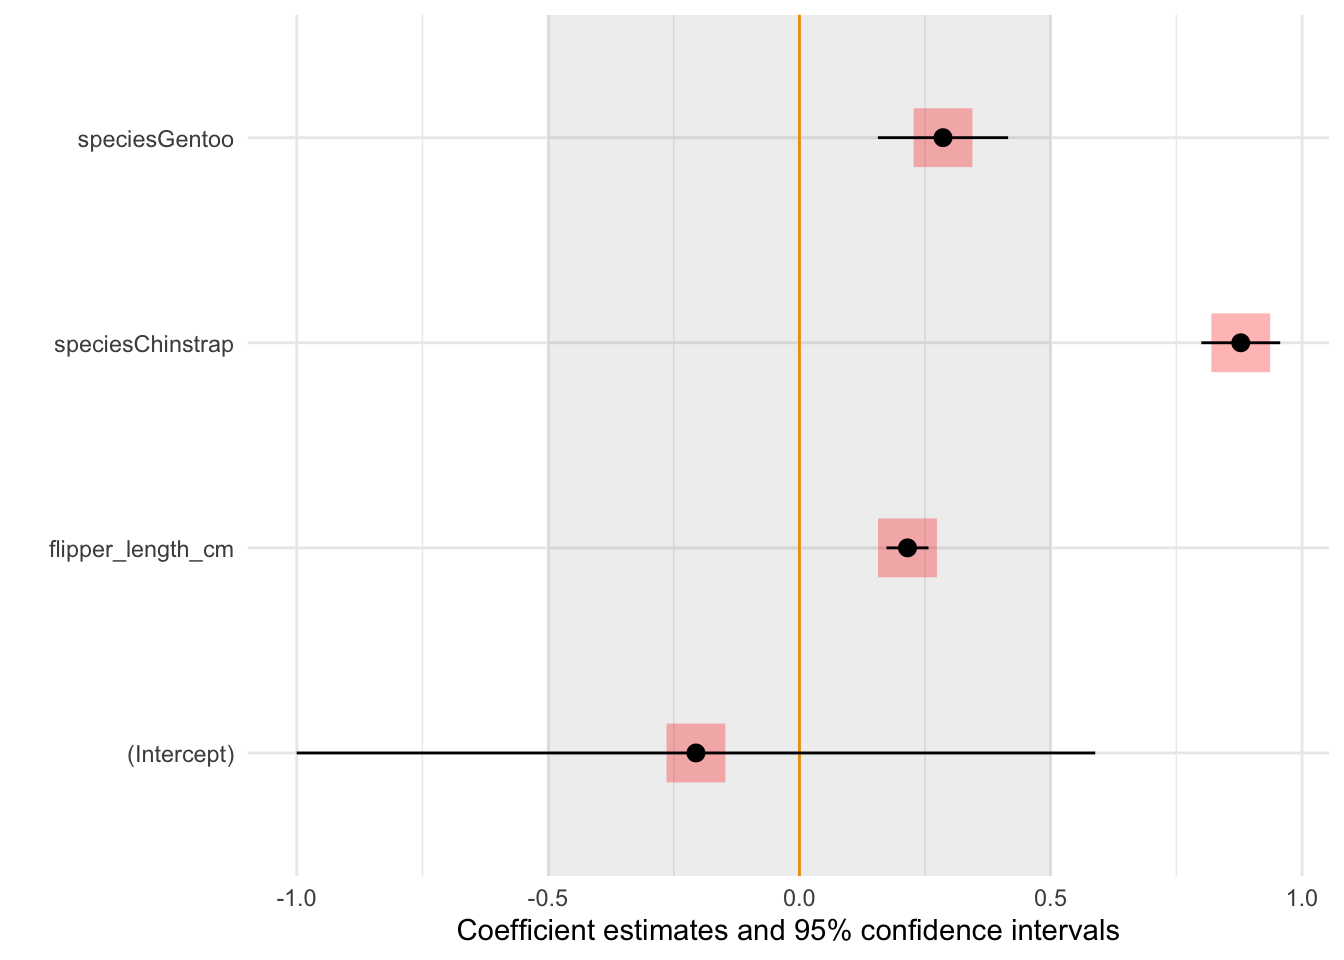
modelplot(mod, background = b)
modelplot(models, draw = FALSE)## term model estimate std.error conf.low conf.high
## 1 (Intercept) vs 2.41742511 0.67622094 1.03224931 3.80260091
## 5 (Intercept) disp 112.57276339 114.86315481 -122.71374324 347.85927003
## 9 (Intercept) hp -10.56116383 68.75946117 -151.40853516 130.28620751
## 2 carb vs -0.06945116 0.03943402 -0.15022810 0.01132577
## 6 carb disp -12.30144724 6.69827859 -26.02224894 1.41935446
## 10 carb hp 17.75593287 4.00972816 9.54237706 25.96948867
## 3 mpg vs -0.01513960 0.01716410 -0.05029868 0.02001947
## 7 mpg disp -7.14964651 2.91550156 -13.12178072 -1.17751230
## 11 mpg hp -1.00486469 1.74527956 -4.57990780 2.57017842
## 4 cyl vs -0.23926135 0.05687969 -0.35577411 -0.12274859
## 8 cyl disp 47.90105842 9.66160634 28.11015499 67.69196184
## 12 cyl hp 20.60581208 5.78363747 8.75856779 32.45305638