Poglavlje 9 Analiza upitnika
U R sučelju postoji niz paketa koji imaju ugrađene funkcije za potrebe psihometrijskih analiza. Jedan od poznatijih paketa je psych (Revelle, 2019), zatim sjstats (???) i sjPlot (???) - Collection of Convenient Functions for Common Statistical Computations.
9.1 Analiza čestica (IRT analiza)
U ovom dijelu nastojati će se prikazati način analize upitnika usmjeren na analizu čestica te je kao takav pristup poznat pod nazivom Item response theory (IRT).
Prikaz krivulje za česticu koja ima srednju razinu težine (medium item difficulty) i prosječnu diskriminaciju (moderate item discrimination):
theta <- seq(-3, 3, .1)

bmedium <- 0

amoderate <- 1

P <- 1 / (1 + exp(-amoderate * (theta - bmedium)))

plot(theta, P, type="l")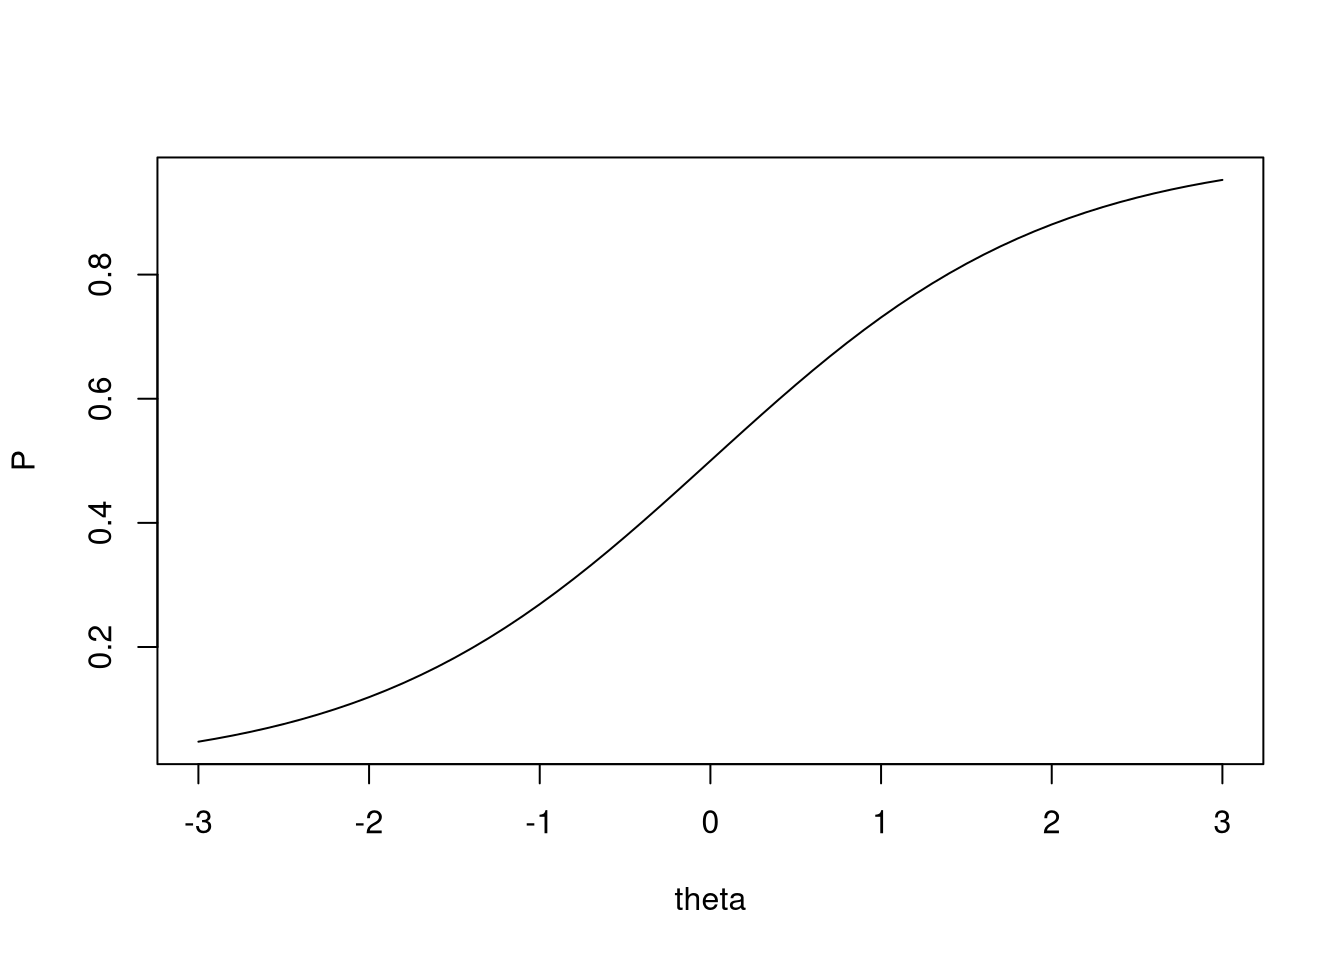
Preuzeto iz udžbenika The Basics of Item Response Theory Using R (Frank B. Baker, 2017).
Ili malo ljepša slika koja ima uređene nazive x i y osi:
par(lab=c(7,3,3))
theta <- seq(-3, 3, .1)
b <- 0
a <- 1
P <- 1 / (1 + exp(-a * (theta - b)))
plot(theta, P, type="l", xlim=c(-3,3), ylim=c(0,1),
       xlab=expression(paste("Ability, ",theta)),
       ylab=expression(paste(
         "Probability of Correct Response, P(",theta,")")))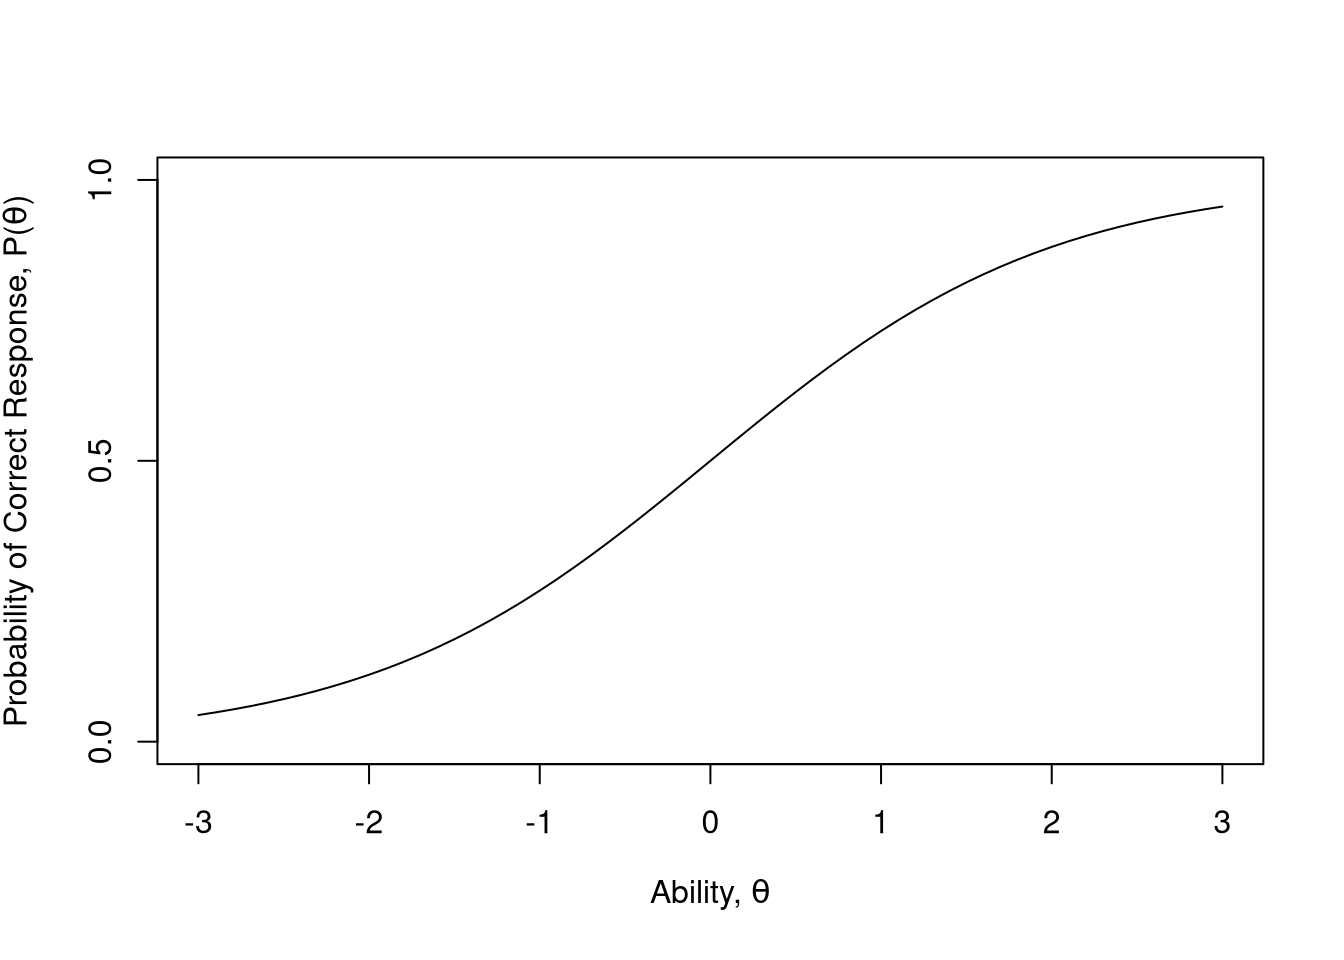
Krivulje čestica u pravilu imaju pozitivan trend ali se u praksi može dogoditi i negativan trend krivulje. Items with negative discrimination occur in two ways. First, the incorrect response to a two-choice item will always have a negative item discrimination parameter if the correct response has a positive value. Second, sometimes the correct response to an item will yield a negative item discrimination parameter. This tells you that something is wrong with the item. Either it is poorly written or there is some misinformation prevalent among the high-ability students. In any case, it is a warning that the item needs some attention.
Three mathematical models for the item characteristic curve
two-parameter model logistic model This equation represents a family of curves whose individual members are defined by specific numerical values of the item parameters b and a; hence, it is called the two-parameter model. It is the model that was used in Chap. 1. The item difficulty parameter, denoted by b, is defined as the point on the ability scale at which the probability of correct response to the item is 0.5. The theoretical range of the values of this parameter is 1 b C1 (i.e., a set of extended real numbers). However, typical values have the range of 3 b C3.
The Rasch model The next model of interest was first published by the Danish mathematician Georg Rasch in the 1960s. Rasch approached the analysis of test data from a probability theory point of view. Although he started from a very different frame of reference, the resultant item characteristic curve model was a logistic model. Under this model, the item discrimination parameter of the two-parameter model is fixed at a value of a D 1 for all items and only the item difficulty parameter can take on different values. Because of this, the Rasch model is often referred to as the one-parameter logistic model.
The Three parameter model Birnbaum (1968) modified the two parameter logistic model to include a parameter that represents the contribution of guessing to the probability of correct response.
9.2 Pretpostavke za korištenje IRT modela
Primjena IRT analize pretpostavlja zadovoljavanje uvjeta za primjenu. Jedan od modela provjere uvjeta je i M2 statistika (Cai & Hansen, 2013).
References
Cai, L., & Hansen, M. (2013). Limited-information goodness-of-fit testing of hierarchical item factor models. The British Journal of Mathematical and Statistical Psychology, 66(2), 245–276. doi:10.1111/j.2044-8317.2012.02050.x
Frank B. Baker, S.-H. K. (2017). The Basics of Item Response Theory Using R (1st ed.). Springer International Publishing.
Revelle, W. (2019). Psych: Procedures for psychological, psychometric, and personality research. Retrieved from https://CRAN.R-project.org/package=psych