NorthEast
# -----------------
# Data
# -----------------
usa.N <- usa.sf %>%
filter(loc == "N") %>%
mutate(index = 1:n(),
index2 = index)
nb.map.N <- poly2nb(usa.N)
#nb2INLA("map.graph.N",nb.map.N)
index.N <- usa.N %>%
dplyr::select(County.Code, ALAND, index, index2) %>%
st_set_geometry(NULL)
dat.N <- data %>%
inner_join(index.N, by="County.Code") %>%
inner_join(n.neighbors(nb.map.N), by = "index") %>%
dplyr::select(-County.Code, -index2) %>%
mutate(urbanicity = factor(urbanicity),
synthetic_opioid_crude_death_rate = as.character(synthetic_opioid_crude_death_rate),
population = as.character(population),
synthetic_opioid_deaths = as.character(synthetic_opioid_deaths),
year = as.character(year),
index = as.character(index)) %>%
mutate_if(is.numeric, scale_this) %>%
mutate(synthetic_opioid_crude_death_rate = as.numeric(synthetic_opioid_crude_death_rate),
population = as.numeric(population),
synthetic_opioid_deaths = floor(as.numeric(synthetic_opioid_deaths)),
year = as.numeric(year),
index = as.numeric(index))
n.N<-nrow(dat.N)
# -----------------
# Formula
# -----------------
N<-c(
# NULL
formula = synthetic_opioid_deaths ~ 1,
# Spatio-temporal only
formula = synthetic_opioid_deaths ~ 1 + f(index, model = "besag", graph = "map.graph.N") + f(year, model = "rw1"),
# Healthcare system
formula = synthetic_opioid_deaths ~ 1 + urgent_care + proportion_uninsured,
#Socio-economic
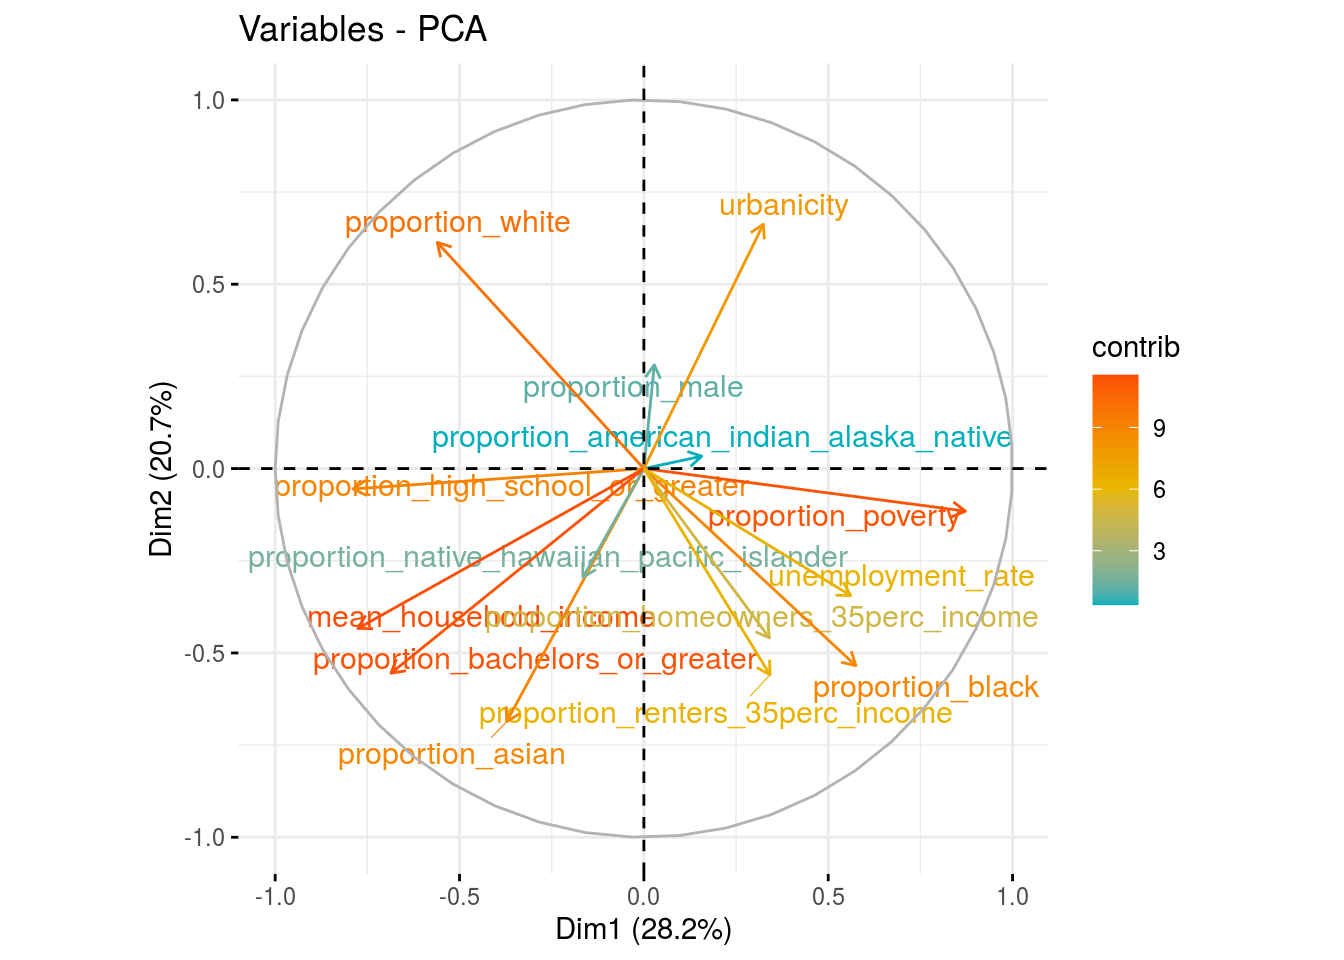
formula = synthetic_opioid_deaths ~ 1 + proportion_male + proportion_white + proportion_black + proportion_american_indian_alaska_native + proportion_asian + proportion_native_hawaiian_pacific_islander + proportion_high_school_or_greater + proportion_bachelors_or_greater + proportion_poverty + unemployment_rate + mean_household_income + proportion_homeowners_35perc_income + proportion_renters_35perc_income + urbanicity,
# Drug market
formula = synthetic_opioid_deaths ~ 1 + NFLIS + opioid_prescriptions_per_100 + police_violence + road_access,
# Individual susceptibility/prevalence of drug use
formula = synthetic_opioid_deaths ~ 1 + hep_c_mortality_rate + heroin_crude_death_rate + cocaine_crude_death_rate + meth_crude_death_rate + heroin + tx_su + tx_mental + mental,
# Full model
formula = synthetic_opioid_deaths ~ 1 + urgent_care + proportion_uninsured + proportion_male + proportion_white + proportion_black + proportion_american_indian_alaska_native + proportion_asian + proportion_native_hawaiian_pacific_islander + proportion_high_school_or_greater + proportion_bachelors_or_greater + proportion_poverty + unemployment_rate + mean_household_income + proportion_homeowners_35perc_income + proportion_renters_35perc_income + urbanicity + NFLIS + opioid_prescriptions_per_100 + police_violence + road_access + hep_c_mortality_rate + heroin_crude_death_rate + cocaine_crude_death_rate + meth_crude_death_rate + heroin + tx_su + tx_mental + mental,
# Full-spatial model
formula = synthetic_opioid_deaths ~ 1 + f(index, model = "besag", graph = "map.graph.N") + f(year, model = "rw1") + urgent_care + proportion_uninsured + proportion_male + proportion_white + proportion_black + proportion_american_indian_alaska_native + proportion_asian + proportion_native_hawaiian_pacific_islander + proportion_high_school_or_greater + proportion_bachelors_or_greater + proportion_poverty + unemployment_rate + mean_household_income + proportion_homeowners_35perc_income + proportion_renters_35perc_income + urbanicity + NFLIS + opioid_prescriptions_per_100 + police_violence + road_access + hep_c_mortality_rate + heroin_crude_death_rate + cocaine_crude_death_rate + meth_crude_death_rate + heroin + tx_su + tx_mental + mental)
# -----------------
# Model Estimation
# -----------------
names(N)<-c("null", "spatio-temporal", "healthcare", "socio-economic", "drug-market", "suscep", "full", "full-spat")
INLA:::inla.dynload.workaround()
m.N <- N %>% purrr::map(~inla.batch.safe(formula = ., dat1 = dat.N))
N.s <- m.N %>%
purrr::map(~Rsq.batch.safe(model = ., dic.null = m.N[[1]]$dic, n = n.N)) %>%
bind_rows(.id = "formula") %>% mutate(id = row_number())
## [1] 0
## [1] 1
## [1] 0.9963008
## [1] 0.9999906
## [1] 0.9996854
## [1] 0.9999998
## [1] 1
## [1] 1
## # A tibble: 8 x 8
##   formula           Rsq    DIC     pD `log score`   waic `waic pD`    id
##   <chr>           <dbl>  <dbl>  <dbl>       <dbl>  <dbl>     <dbl> <int>
## 1 null            0     41088.   1.13       11.8  41010.      94.4     1
## 2 spatio-temporal 1.00   6967. 176.          2.14  7328.     440.      2
## 3 healthcare      0.996 31371.   3.13        9.06 31515.     145.      3
## 4 socio-economic  1.00  21038.  19.1         6.09 21682.     621.      4
## 5 drug-market     1.00  27097.   5.13        7.81 27313.     215.      5
## 6 suscep          1.00  14658.   9.13        4.15 15203.     466.      6
## 7 full            1.00  10864.  33.1         3.22 11384.     482.      7
## 8 full-spat       1.00   6155. 170.          1.84  6318.     276.      8
# -----------------
# RMSE
# -----------------
library(Metrics)
dt.pred.N <- dat.N %>%
  nest() %>%
  tidyr::expand_grid(model=m.N) %>%
  mutate(id = 1:n()) %>%
  mutate(pred = purrr::map(.x = model, .f = ~.$summary.fitted.values$`0.5quant`),
         data_preds = purrr::map2(.x = data, .y = pred, .f = ~mutate(.x, pred = .y)),
         rmse = purrr::map_dbl(.x = data_preds, .f = ~rmse(actual = .$synthetic_opioid_deaths, predicted = .$pred)),
         mae = purrr::map_dbl(.x = data_preds, .f = ~mae(actual = .$synthetic_opioid_deaths, predicted = .$pred)),
         msle = purrr::map_dbl(.x = data_preds, .f = ~msle(actual = .$synthetic_opioid_deaths, predicted = .$pred)),
         mod = names(N)) %>%
  dplyr::select(id, mod, rmse:msle)

dt.pred.N
## # A tibble: 8 x 5
##      id mod              rmse   mae  msle
##   <int> <chr>           <dbl> <dbl> <dbl>
## 1     1 null            31.9  13.6  1.54
## 2     2 spatio-temporal  7.98  2.94 0.134
## 3     3 healthcare      26.9  11.0  1.15
## 4     4 socio-economic  22.7   8.79 0.687
## 5     5 drug-market     25.6  10.1  0.941
## 6     6 suscep          25.4   6.78 0.525
## 7     7 full            15.6   5.12 0.311
## 8     8 full-spat        5.21  2.11 0.108
# -----------------
# Fixed Effects
# -----------------

m.N[c(7,8)] %>% plot_fixed(
  title = "Contextual variables coefficient",
  filter=10,
  lim = c("urgent_care","proportion_uninsured", "proportion_male", "proportion_white", "proportion_black",
"proportion_american_indian_alaska_native","proportion_asian", "proportion_native_hawaiian_pacific_islander", "proportion_high_school_or_greater", "proportion_bachelors_or_greater", "proportion_poverty", "unemployment_rate", "mean_household_income", "proportion_homeowners_35perc_income", "proportion_renters_35perc_income", "urbanicity", "NFLIS", "opioid_prescriptions_per_100", "police_violence", "road_access", "hep_c_mortality_rate", "heroin_crude_death_rate", "cocaine_crude_death_rate", "meth_crude_death_rate", "heroin", "tx_su", "tx_mental", "mental"),
  breaks=c("1","2"),
  lab_mod=c("Full model", "Full-spatial"), ylab = "exp(mean)", ylim = 2)
## [1] "Deprecated, update to plot_random3"
##
## Call:
##    c("inla(formula = formula, family = \"poisson\", data = dat1, offset =
##    log(population), ", " verbose = F, control.compute = list(config = T,
##    dic = T, ", " cpo = T, waic = T), control.predictor = list(link = 1, ",
##    " compute = TRUE), control.fixed = list(correlation.matrix = T))" )
## Time used:
##     Pre = 2.37, Running = 7.56, Post = 0.96, Total = 10.9
## Fixed effects:
##                                                mean    sd 0.025quant 0.5quant
## (Intercept)                                 -10.727 0.133    -10.989  -10.727
## urgent_careTRUE                              -0.237 0.071     -0.378   -0.237
## proportion_uninsured                         -0.077 0.029     -0.135   -0.077
## proportion_male                               0.001 0.053     -0.108    0.003
## proportion_white                              0.153 0.122     -0.085    0.152
## proportion_black                              0.057 0.084     -0.106    0.056
## proportion_american_indian_alaska_native     -0.050 0.031     -0.111   -0.050
## proportion_asian                              0.018 0.045     -0.071    0.018
## proportion_native_hawaiian_pacific_islander   0.021 0.018     -0.014    0.021
## proportion_high_school_or_greater            -0.038 0.060     -0.156   -0.038
## proportion_bachelors_or_greater               0.048 0.078     -0.105    0.048
## proportion_poverty                           -0.021 0.053     -0.126   -0.021
## unemployment_rate                            -0.006 0.052     -0.109   -0.006
## mean_household_income                        -0.082 0.073     -0.226   -0.082
## proportion_homeowners_35perc_income          -0.046 0.052     -0.149   -0.045
## proportion_renters_35perc_income             -0.051 0.033     -0.115   -0.051
## urbanicity2                                  -0.180 0.136     -0.448   -0.180
## urbanicity3                                  -0.288 0.140     -0.565   -0.287
## urbanicity4                                  -0.293 0.163     -0.612   -0.293
## urbanicity5                                  -0.348 0.164     -0.670   -0.348
## urbanicity6                                  -0.550 0.184     -0.912   -0.550
## NFLIS                                         0.066 0.013      0.039    0.066
## opioid_prescriptions_per_100                  0.206 0.039      0.130    0.206
## police_violenceTRUE                          -0.026 0.020     -0.064   -0.026
## road_accessTRUE                               0.047 0.122     -0.195    0.047
## hep_c_mortality_rate                          0.020 0.012     -0.003    0.020
## heroin_crude_death_rate                       0.244 0.011      0.222    0.244
## cocaine_crude_death_rate                      0.053 0.010      0.034    0.053
## meth_crude_death_rate                         0.018 0.010     -0.002    0.018
## heroin                                        0.010 0.012     -0.013    0.010
## tx_su                                        -0.021 0.016     -0.052   -0.021
## tx_mental                                    -0.106 0.036     -0.177   -0.106
## mental                                       -0.007 0.025     -0.057   -0.007
##                                             0.975quant    mode kld
## (Intercept)                                    -10.467 -10.727   0
## urgent_careTRUE                                 -0.098  -0.237   0
## proportion_uninsured                            -0.020  -0.077   0
## proportion_male                                  0.101   0.006   0
## proportion_white                                 0.394   0.150   0
## proportion_black                                 0.223   0.055   0
## proportion_american_indian_alaska_native         0.011  -0.050   0
## proportion_asian                                 0.108   0.017   0
## proportion_native_hawaiian_pacific_islander      0.056   0.021   0
## proportion_high_school_or_greater                0.082  -0.039   0
## proportion_bachelors_or_greater                  0.201   0.049   0
## proportion_poverty                               0.084  -0.022   0
## unemployment_rate                                0.096  -0.006   0
## mean_household_income                            0.061  -0.081   0
## proportion_homeowners_35perc_income              0.056  -0.045   0
## proportion_renters_35perc_income                 0.013  -0.051   0
## urbanicity2                                      0.087  -0.179   0
## urbanicity3                                     -0.013  -0.286   0
## urbanicity4                                      0.027  -0.293   0
## urbanicity5                                     -0.026  -0.348   0
## urbanicity6                                     -0.189  -0.550   0
## NFLIS                                            0.092   0.066   0
## opioid_prescriptions_per_100                     0.283   0.206   0
## police_violenceTRUE                              0.013  -0.026   0
## road_accessTRUE                                  0.285   0.048   0
## hep_c_mortality_rate                             0.042   0.020   0
## heroin_crude_death_rate                          0.265   0.244   0
## cocaine_crude_death_rate                         0.073   0.053   0
## meth_crude_death_rate                            0.037   0.018   0
## heroin                                           0.034   0.010   0
## tx_su                                            0.010  -0.021   0
## tx_mental                                       -0.035  -0.106   0
## mental                                           0.042  -0.007   0
##
## Linear combinations (derived):
##                                             ID    mean    sd 0.025quant
## (Intercept)                                  1 -10.727 0.133    -10.989
## urgent_careTRUE                              2  -0.237 0.071     -0.378
## proportion_uninsured                         3  -0.077 0.029     -0.135
## proportion_male                              4   0.001 0.053     -0.104
## proportion_white                             5   0.153 0.122     -0.085
## proportion_black                             6   0.057 0.084     -0.106
## proportion_american_indian_alaska_native     7  -0.050 0.031     -0.111
## proportion_asian                             8   0.018 0.045     -0.071
## proportion_native_hawaiian_pacific_islander  9   0.021 0.018     -0.014
## proportion_high_school_or_greater           10  -0.038 0.060     -0.156
## proportion_bachelors_or_greater             11   0.048 0.078     -0.105
## proportion_poverty                          12  -0.021 0.053     -0.126
## unemployment_rate                           13  -0.006 0.052     -0.109
## mean_household_income                       14  -0.082 0.073     -0.226
## proportion_homeowners_35perc_income         15  -0.046 0.052     -0.149
## proportion_renters_35perc_income            16  -0.051 0.033     -0.115
## urbanicity2                                 17  -0.180 0.136     -0.448
## urbanicity3                                 18  -0.288 0.140     -0.565
## urbanicity4                                 19  -0.293 0.163     -0.612
## urbanicity5                                 20  -0.348 0.164     -0.670
## urbanicity6                                 21  -0.550 0.184     -0.912
## NFLIS                                       22   0.066 0.013      0.039
## opioid_prescriptions_per_100                23   0.206 0.039      0.129
## police_violenceTRUE                         24  -0.026 0.020     -0.064
## road_accessTRUE                             25   0.046 0.122     -0.194
## hep_c_mortality_rate                        26   0.020 0.012     -0.003
## heroin_crude_death_rate                     27   0.244 0.011      0.222
## cocaine_crude_death_rate                    28   0.053 0.010      0.034
## meth_crude_death_rate                       29   0.018 0.010     -0.002
## heroin                                      30   0.010 0.012     -0.013
## tx_su                                       31  -0.021 0.016     -0.052
## tx_mental                                   32  -0.106 0.036     -0.177
## mental                                      33  -0.007 0.025     -0.057
##                                             0.5quant 0.975quant    mode kld
## (Intercept)                                  -10.727    -10.467 -10.727   0
## urgent_careTRUE                               -0.237     -0.098  -0.237   0
## proportion_uninsured                          -0.077     -0.020  -0.077   0
## proportion_male                                0.001      0.105   0.001   0
## proportion_white                               0.152      0.394   0.150   0
## proportion_black                               0.056      0.224   0.055   0
## proportion_american_indian_alaska_native      -0.050      0.011  -0.050   0
## proportion_asian                               0.018      0.108   0.017   0
## proportion_native_hawaiian_pacific_islander    0.021      0.056   0.021   0
## proportion_high_school_or_greater             -0.038      0.081  -0.038   0
## proportion_bachelors_or_greater                0.048      0.201   0.049   0
## proportion_poverty                            -0.021      0.084  -0.022   0
## unemployment_rate                             -0.006      0.096  -0.006   0
## mean_household_income                         -0.082      0.061  -0.081   0
## proportion_homeowners_35perc_income           -0.045      0.056  -0.045   0
## proportion_renters_35perc_income              -0.051      0.013  -0.051   0
## urbanicity2                                   -0.180      0.087  -0.180   0
## urbanicity3                                   -0.287     -0.013  -0.287   0
## urbanicity4                                   -0.293      0.026  -0.293   0
## urbanicity5                                   -0.348     -0.026  -0.348   0
## urbanicity6                                   -0.550     -0.189  -0.550   0
## NFLIS                                          0.066      0.092   0.066   0
## opioid_prescriptions_per_100                   0.206      0.283   0.206   0
## police_violenceTRUE                           -0.026      0.013  -0.026   0
## road_accessTRUE                                0.046      0.286   0.046   0
## hep_c_mortality_rate                           0.020      0.042   0.020   0
## heroin_crude_death_rate                        0.244      0.265   0.244   0
## cocaine_crude_death_rate                       0.053      0.073   0.053   0
## meth_crude_death_rate                          0.018      0.037   0.018   0
## heroin                                         0.010      0.034   0.010   0
## tx_su                                         -0.021      0.010  -0.021   0
## tx_mental                                     -0.106     -0.035  -0.106   0
## mental                                        -0.007      0.042  -0.007   0
##
## Random effects:
##   Name	  Model
##     index Besags ICAR model
##    year RW1 model
##
## Model hyperparameters:
##                     mean    sd 0.025quant 0.5quant 0.975quant mode
## Precision for index 2.23 0.343       1.63     2.20       2.98 2.15
## Precision for year  4.88 2.355       1.61     4.46      10.60 3.60
##
## Expected number of effective parameters(stdev): 170.59(4.73)
## Number of equivalent replicates : 10.18
##
## Deviance Information Criterion (DIC) ...............: 6155.01
## Deviance Information Criterion (DIC, saturated) ....: 2130.56
## Effective number of parameters .....................: 170.35
##
## Watanabe-Akaike information criterion (WAIC) ...: 6317.81
## Effective number of parameters .................: 276.46
##
## Marginal log-Likelihood:  -3575.81
## CPO and PIT are computed
##
## Posterior marginals for the linear predictor and
##  the fitted values are computed

South
# -----------------
# Data
# -----------------
usa.S <- usa.sf %>%
  filter(loc == "S") %>%
  mutate(index = 1:n(),
         index2 = index)

nb.map.S <- poly2nb(usa.S)
#nb2INLA("map.graph.S",nb.map.S)

index.S <- usa.S %>%
  dplyr::select(County.Code, ALAND, index, index2) %>%
  st_set_geometry(NULL)

dat.S <- data %>%
  inner_join(index.S, by="County.Code") %>%
  inner_join(n.neighbors(nb.map.S), by = "index") %>%
  dplyr::select(-County.Code, -index2) %>%
  mutate(urbanicity = factor(urbanicity),
         synthetic_opioid_crude_death_rate = as.character(synthetic_opioid_crude_death_rate),
         population = as.character(population),
         synthetic_opioid_deaths = as.character(synthetic_opioid_deaths),
         year = as.character(year),
         index = as.character(index)) %>%
  mutate_if(is.numeric, scale_this) %>%
  mutate(synthetic_opioid_crude_death_rate = as.numeric(synthetic_opioid_crude_death_rate),
         population = as.numeric(population),
         synthetic_opioid_deaths = floor(as.numeric(synthetic_opioid_deaths)),
         year = as.numeric(year),
         index = as.numeric(index))

n.S<-nrow(dat.S)

# -----------------
# Formula
# -----------------

S<-c(
  # NULL
  formula = synthetic_opioid_deaths ~ 1,
  # Spatio-temporal only
  formula = synthetic_opioid_deaths ~ 1 + f(index, model = "besag", graph = "map.graph.S") + f(year, model = "rw1"),
  # Healthcare system
  formula = synthetic_opioid_deaths ~ 1 + urgent_care + proportion_uninsured,
  #Socio-economic
  formula = synthetic_opioid_deaths ~ 1 + proportion_male + proportion_white + proportion_black + proportion_american_indian_alaska_native + proportion_asian + proportion_native_hawaiian_pacific_islander + proportion_high_school_or_greater + proportion_bachelors_or_greater + proportion_poverty + unemployment_rate + mean_household_income + proportion_homeowners_35perc_income + proportion_renters_35perc_income + urbanicity,
  # Drug market
  formula = synthetic_opioid_deaths ~ 1 + NFLIS + opioid_prescriptions_per_100 + police_violence + road_access,
  # Individual susceptibility/prevalence of drug use
  formula = synthetic_opioid_deaths ~ 1 + hep_c_mortality_rate + heroin_crude_death_rate + cocaine_crude_death_rate + meth_crude_death_rate + heroin + tx_su + tx_mental + mental,
  # Full model
  formula = synthetic_opioid_deaths ~ 1 + urgent_care + proportion_uninsured + proportion_male + proportion_white + proportion_black + proportion_american_indian_alaska_native + proportion_asian + proportion_native_hawaiian_pacific_islander + proportion_high_school_or_greater + proportion_bachelors_or_greater + proportion_poverty + unemployment_rate + mean_household_income + proportion_homeowners_35perc_income + proportion_renters_35perc_income + urbanicity + NFLIS + opioid_prescriptions_per_100 + police_violence + road_access + hep_c_mortality_rate + heroin_crude_death_rate + cocaine_crude_death_rate + meth_crude_death_rate + heroin + tx_su + tx_mental + mental,
  # Full-spatial model
  formula = synthetic_opioid_deaths ~ 1 + f(index, model = "besag", graph = "map.graph.S") + f(year, model = "rw1") + urgent_care + proportion_uninsured + proportion_male + proportion_white + proportion_black + proportion_american_indian_alaska_native + proportion_asian + proportion_native_hawaiian_pacific_islander + proportion_high_school_or_greater + proportion_bachelors_or_greater + proportion_poverty + unemployment_rate + mean_household_income + proportion_homeowners_35perc_income + proportion_renters_35perc_income + urbanicity + NFLIS + opioid_prescriptions_per_100 + police_violence + road_access + hep_c_mortality_rate + heroin_crude_death_rate + cocaine_crude_death_rate + meth_crude_death_rate + heroin + tx_su + tx_mental + mental)

# -----------------
# Model Estimation
# -----------------
names(S)<-c("null", "spatio-temporal", "healthcare", "socio-economic", "drug-market", "suscep", "full", "full-spat")

INLA:::inla.dynload.workaround()
m.S <- S %>% purrr::map(~inla.batch.safe(formula = ., dat1 = dat.S))

S.s <- m.S %>%
  purrr::map(~Rsq.batch.safe(model = ., dic.null = m.S[[1]]$dic, n = n.S)) %>%
  bind_rows(.id = "formula") %>% mutate(id = row_number())
## [1] 0
## [1] 0.9782048
## [1] 0.7471618
## [1] 0.8163586
## [1] 0.817142
## [1] 0.9101809
## [1] 0.9631569
## [1] 0.9804441
## # A tibble: 8 x 8
##   formula           Rsq    DIC     pD `log score`   waic `waic pD`    id
##   <chr>           <dbl>  <dbl>  <dbl>       <dbl>  <dbl>     <dbl> <int>
## 1 null            0     58315.   1.14       2.55  57929.      60.6     1
## 2 spatio-temporal 0.978 16020. 616.         0.722 16262.     719.      2
## 3 healthcare      0.747 42677.   3.14       1.88  42790.     114.      3
## 4 socio-economic  0.816 39072.  19.1        1.71  39523.     455.      4
## 5 drug-market     0.817 38995.   5.14       1.71  39167.     169.      5
## 6 suscep          0.910 30916.   9.14       1.35  31521.     509.      6
## 7 full            0.963 20826.  33.1        0.918 21345.     460.      7
## 8 full-spat       0.980 14489. 467.         0.650 14658.     534.      8
# -----------------
# RMSE
# -----------------
library(Metrics)
dt.pred.S <- dat.S %>%
  nest() %>%
  tidyr::expand_grid(model=m.S) %>%
  mutate(id = 1:n()) %>%
  mutate(pred = purrr::map(.x = model, .f = ~.$summary.fitted.values$`0.5quant`),
         data_preds = purrr::map2(.x = data, .y = pred, .f = ~mutate(.x, pred = .y)),
         rmse = purrr::map_dbl(.x = data_preds, .f = ~rmse(actual = .$synthetic_opioid_deaths, predicted = .$pred)),
         mae = purrr::map_dbl(.x = data_preds, .f = ~mae(actual = .$synthetic_opioid_deaths, predicted = .$pred)),
         msle = purrr::map_dbl(.x = data_preds, .f = ~msle(actual = .$synthetic_opioid_deaths, predicted = .$pred)),
         mod = names(S)) %>%
  dplyr::select(id, mod, rmse:msle)

dt.pred.S
## # A tibble: 8 x 5
##      id mod              rmse   mae   msle
##   <int> <chr>           <dbl> <dbl>  <dbl>
## 1     1 null            10.3  2.23  0.395
## 2     2 spatio-temporal  2.76 0.651 0.0523
## 3     3 healthcare       9.18 1.87  0.275
## 4     4 socio-economic   8.31 1.74  0.277
## 5     5 drug-market      8.99 1.66  0.225
## 6     6 suscep           7.80 1.53  0.189
## 7     7 full             5.92 1.04  0.107
## 8     8 full-spat        2.19 0.544 0.0422
# -----------------
# Fixed Effects
# -----------------

m.S[c(7,8)] %>% plot_fixed(
  title = "Contextual variables coefficient",
  filter=10,
  lim = c("urgent_care","proportion_uninsured", "proportion_male", "proportion_white", "proportion_black",
"proportion_american_indian_alaska_native","proportion_asian", "proportion_native_hawaiian_pacific_islander", "proportion_high_school_or_greater", "proportion_bachelors_or_greater", "proportion_poverty", "unemployment_rate", "mean_household_income", "proportion_homeowners_35perc_income", "proportion_renters_35perc_income", "urbanicity", "NFLIS", "opioid_prescriptions_per_100", "police_violence", "road_access", "hep_c_mortality_rate", "heroin_crude_death_rate", "cocaine_crude_death_rate", "meth_crude_death_rate", "heroin", "tx_su", "tx_mental", "mental"),
  breaks=c("1","2"),
  lab_mod=c("Full model", "Full-spatial"), ylab = "exp(mean)", ylim = 2)
## [1] "Deprecated, update to plot_random3"
##
## Call:
##    c("inla(formula = formula, family = \"poisson\", data = dat1, offset =
##    log(population), ", " verbose = F, control.compute = list(config = T,
##    dic = T, ", " cpo = T, waic = T), control.predictor = list(link = 1, ",
##    " compute = TRUE), control.fixed = list(correlation.matrix = T))" )
## Time used:
##     Pre = 3.03, Running = 154, Post = 3.88, Total = 161
## Fixed effects:
##                                                mean    sd 0.025quant 0.5quant
## (Intercept)                                 -11.611 0.113    -11.833  -11.610
## urgent_careTRUE                              -0.519 0.057     -0.632   -0.518
## proportion_uninsured                         -0.068 0.027     -0.122   -0.068
## proportion_male                              -0.117 0.044     -0.205   -0.117
## proportion_white                             -0.525 0.152     -0.822   -0.526
## proportion_black                             -0.551 0.158     -0.860   -0.551
## proportion_american_indian_alaska_native     -0.062 0.043     -0.146   -0.062
## proportion_asian                             -0.049 0.027     -0.102   -0.049
## proportion_native_hawaiian_pacific_islander   0.043 0.018      0.008    0.043
## proportion_high_school_or_greater             0.394 0.056      0.285    0.393
## proportion_bachelors_or_greater               0.039 0.048     -0.054    0.039
## proportion_poverty                            0.091 0.054     -0.014    0.091
## unemployment_rate                            -0.196 0.041     -0.277   -0.196
## mean_household_income                        -0.196 0.052     -0.299   -0.196
## proportion_homeowners_35perc_income          -0.132 0.031     -0.193   -0.132
## proportion_renters_35perc_income              0.082 0.033      0.016    0.082
## urbanicity2                                  -0.281 0.103     -0.483   -0.280
## urbanicity3                                  -0.411 0.118     -0.643   -0.411
## urbanicity4                                  -0.592 0.124     -0.836   -0.592
## urbanicity5                                  -0.667 0.125     -0.914   -0.667
## urbanicity6                                  -0.911 0.134     -1.174   -0.911
## NFLIS                                         0.130 0.008      0.115    0.130
## opioid_prescriptions_per_100                  0.060 0.032     -0.004    0.060
## police_violenceTRUE                           0.019 0.022     -0.023    0.019
## road_accessTRUE                              -0.300 0.067     -0.431   -0.299
## hep_c_mortality_rate                          0.006 0.023     -0.040    0.006
## heroin_crude_death_rate                       0.093 0.007      0.080    0.093
## cocaine_crude_death_rate                      0.037 0.005      0.027    0.037
## meth_crude_death_rate                        -0.007 0.006     -0.019   -0.007
## heroin                                        0.054 0.013      0.029    0.054
## tx_su                                         0.183 0.017      0.150    0.183
## tx_mental                                     0.030 0.028     -0.025    0.030
## mental                                        0.043 0.023     -0.002    0.043
##                                             0.975quant    mode kld
## (Intercept)                                    -11.390 -11.610   0
## urgent_careTRUE                                 -0.407  -0.518   0
## proportion_uninsured                            -0.014  -0.068   0
## proportion_male                                 -0.032  -0.116   0
## proportion_white                                -0.226  -0.527   0
## proportion_black                                -0.239  -0.552   0
## proportion_american_indian_alaska_native         0.023  -0.061   0
## proportion_asian                                 0.005  -0.049   0
## proportion_native_hawaiian_pacific_islander      0.078   0.043   0
## proportion_high_school_or_greater                0.503   0.393   0
## proportion_bachelors_or_greater                  0.133   0.038   0
## proportion_poverty                               0.196   0.091   0
## unemployment_rate                               -0.115  -0.196   0
## mean_household_income                           -0.094  -0.195   0
## proportion_homeowners_35perc_income             -0.071  -0.132   0
## proportion_renters_35perc_income                 0.147   0.082   0
## urbanicity2                                     -0.079  -0.280   0
## urbanicity3                                     -0.179  -0.410   0
## urbanicity4                                     -0.350  -0.592   0
## urbanicity5                                     -0.421  -0.666   0
## urbanicity6                                     -0.649  -0.911   0
## NFLIS                                            0.146   0.130   0
## opioid_prescriptions_per_100                     0.124   0.060   0
## police_violenceTRUE                              0.062   0.019   0
## road_accessTRUE                                 -0.170  -0.299   0
## hep_c_mortality_rate                             0.049   0.007   0
## heroin_crude_death_rate                          0.107   0.093   0
## cocaine_crude_death_rate                         0.046   0.037   0
## meth_crude_death_rate                            0.004  -0.007   0
## heroin                                           0.079   0.054   0
## tx_su                                            0.216   0.183   0
## tx_mental                                        0.084   0.030   0
## mental                                           0.089   0.043   0
##
## Linear combinations (derived):
##                                             ID    mean    sd 0.025quant
## (Intercept)                                  1 -11.611 0.113    -11.834
## urgent_careTRUE                              2  -0.519 0.057     -0.632
## proportion_uninsured                         3  -0.068 0.027     -0.122
## proportion_male                              4  -0.117 0.044     -0.204
## proportion_white                             5  -0.525 0.152     -0.823
## proportion_black                             6  -0.551 0.158     -0.861
## proportion_american_indian_alaska_native     7  -0.062 0.043     -0.146
## proportion_asian                             8  -0.049 0.027     -0.102
## proportion_native_hawaiian_pacific_islander  9   0.043 0.018      0.008
## proportion_high_school_or_greater           10   0.394 0.056      0.285
## proportion_bachelors_or_greater             11   0.039 0.048     -0.054
## proportion_poverty                          12   0.091 0.054     -0.014
## unemployment_rate                           13  -0.196 0.041     -0.277
## mean_household_income                       14  -0.196 0.052     -0.299
## proportion_homeowners_35perc_income         15  -0.132 0.031     -0.193
## proportion_renters_35perc_income            16   0.082 0.033      0.016
## urbanicity2                                 17  -0.281 0.103     -0.483
## urbanicity3                                 18  -0.411 0.118     -0.643
## urbanicity4                                 19  -0.592 0.124     -0.836
## urbanicity5                                 20  -0.667 0.125     -0.914
## urbanicity6                                 21  -0.911 0.134     -1.174
## NFLIS                                       22   0.130 0.008      0.115
## opioid_prescriptions_per_100                23   0.060 0.032     -0.003
## police_violenceTRUE                         24   0.019 0.022     -0.023
## road_accessTRUE                             25  -0.300 0.067     -0.431
## hep_c_mortality_rate                        26   0.006 0.023     -0.039
## heroin_crude_death_rate                     27   0.093 0.007      0.080
## cocaine_crude_death_rate                    28   0.037 0.005      0.027
## meth_crude_death_rate                       29  -0.007 0.006     -0.019
## heroin                                      30   0.054 0.013      0.029
## tx_su                                       31   0.183 0.017      0.150
## tx_mental                                   32   0.030 0.028     -0.025
## mental                                      33   0.044 0.023     -0.002
##                                             0.5quant 0.975quant    mode kld
## (Intercept)                                  -11.610    -11.390 -11.610   0
## urgent_careTRUE                               -0.518     -0.407  -0.518   0
## proportion_uninsured                          -0.068     -0.014  -0.068   0
## proportion_male                               -0.118     -0.031  -0.118   0
## proportion_white                              -0.525     -0.227  -0.525   0
## proportion_black                              -0.551     -0.240  -0.551   0
## proportion_american_indian_alaska_native      -0.062      0.023  -0.062   0
## proportion_asian                              -0.049      0.005  -0.048   0
## proportion_native_hawaiian_pacific_islander    0.043      0.078   0.043   0
## proportion_high_school_or_greater              0.394      0.503   0.394   0
## proportion_bachelors_or_greater                0.039      0.133   0.038   0
## proportion_poverty                             0.091      0.196   0.091   0
## unemployment_rate                             -0.196     -0.115  -0.196   0
## mean_household_income                         -0.196     -0.094  -0.195   0
## proportion_homeowners_35perc_income           -0.132     -0.071  -0.132   0
## proportion_renters_35perc_income               0.082      0.147   0.082   0
## urbanicity2                                   -0.281     -0.079  -0.280   0
## urbanicity3                                   -0.411     -0.179  -0.411   0
## urbanicity4                                   -0.592     -0.350  -0.592   0
## urbanicity5                                   -0.667     -0.421  -0.667   0
## urbanicity6                                   -0.911     -0.649  -0.911   0
## NFLIS                                          0.130      0.146   0.130   0
## opioid_prescriptions_per_100                   0.060      0.124   0.060   0
## police_violenceTRUE                            0.019      0.062   0.019   0
## road_accessTRUE                               -0.300     -0.170  -0.299   0
## hep_c_mortality_rate                           0.006      0.050   0.006   0
## heroin_crude_death_rate                        0.093      0.107   0.093   0
## cocaine_crude_death_rate                       0.037      0.046   0.037   0
## meth_crude_death_rate                         -0.007      0.004  -0.007   0
## heroin                                         0.054      0.079   0.054   0
## tx_su                                          0.183      0.216   0.183   0
## tx_mental                                      0.030      0.084   0.030   0
## mental                                         0.044      0.089   0.044   0
##
## Random effects:
##   Name	  Model
##     index Besags ICAR model
##    year RW1 model
##
## Model hyperparameters:
##                     mean    sd 0.025quant 0.5quant 0.975quant mode
## Precision for index 1.14 0.105      0.948     1.14       1.36 1.13
## Precision for year  9.25 4.437      3.039     8.48      20.03 6.87
##
## Expected number of effective parameters(stdev): 472.77(12.65)
## Number of equivalent replicates : 24.06
##
## Deviance Information Criterion (DIC) ...............: 14488.90
## Deviance Information Criterion (DIC, saturated) ....: 5199.95
## Effective number of parameters .....................: 467.16
##
## Watanabe-Akaike information criterion (WAIC) ...: 14657.56
## Effective number of parameters .................: 533.54
##
## Marginal log-Likelihood:  -8832.80
## CPO and PIT are computed
##
## Posterior marginals for the linear predictor and
##  the fitted values are computed

West
# -----------------
# Data
# -----------------
usa.W <- usa.sf %>%
  filter(loc == "W") %>%
  mutate(index = 1:n(),
         index2 = index)

nb.map.W <- poly2nb(usa.W)
#nb2INLA("map.graph.W",nb.map.W)

index.W <- usa.W %>%
  dplyr::select(County.Code, ALAND, index, index2) %>%
  st_set_geometry(NULL)

dat.W <- data %>%
  inner_join(index.W, by="County.Code") %>%
  inner_join(n.neighbors(nb.map.W), by = "index") %>%
  dplyr::select(-County.Code, -index2) %>%
  mutate(urbanicity = factor(urbanicity),
         synthetic_opioid_crude_death_rate = as.character(synthetic_opioid_crude_death_rate),
         population = as.character(population),
         synthetic_opioid_deaths = as.character(synthetic_opioid_deaths),
         year = as.character(year),
         index = as.character(index)) %>%
  mutate_if(is.numeric, scale_this) %>%
  mutate(synthetic_opioid_crude_death_rate = as.numeric(synthetic_opioid_crude_death_rate),
         population = as.numeric(population),
         synthetic_opioid_deaths = floor(as.numeric(synthetic_opioid_deaths)),
         year = as.numeric(year),
         index = as.numeric(index))

n.W<-nrow(dat.W)

# -----------------
# Formula
# -----------------

W<-c(
  # NULL
  formula = synthetic_opioid_deaths ~ 1,
  # Spatio-temporal only
  formula = synthetic_opioid_deaths ~ 1 + f(index, model = "besag", graph = "map.graph.W") + f(year, model = "rw1"),
  # Healthcare system
  formula = synthetic_opioid_deaths ~ 1 + urgent_care + proportion_uninsured,
  #Socio-economic
  formula = synthetic_opioid_deaths ~ 1 + proportion_male + proportion_white + proportion_black + proportion_american_indian_alaska_native + proportion_asian + proportion_native_hawaiian_pacific_islander + proportion_high_school_or_greater + proportion_bachelors_or_greater + proportion_poverty + unemployment_rate + mean_household_income + proportion_homeowners_35perc_income + proportion_renters_35perc_income + urbanicity,
  # Drug market
  formula = synthetic_opioid_deaths ~ 1 + NFLIS + opioid_prescriptions_per_100 + police_violence + road_access,
  # Individual susceptibility/prevalence of drug use
  formula = synthetic_opioid_deaths ~ 1 + hep_c_mortality_rate + heroin_crude_death_rate + cocaine_crude_death_rate + meth_crude_death_rate + heroin + tx_su + tx_mental + mental,
  # Full model
  formula = synthetic_opioid_deaths ~ 1 + urgent_care + proportion_uninsured + proportion_male + proportion_white + proportion_black + proportion_american_indian_alaska_native + proportion_asian + proportion_native_hawaiian_pacific_islander + proportion_high_school_or_greater + proportion_bachelors_or_greater + proportion_poverty + unemployment_rate + mean_household_income + proportion_homeowners_35perc_income + proportion_renters_35perc_income + urbanicity + NFLIS + opioid_prescriptions_per_100 + police_violence + road_access + hep_c_mortality_rate + heroin_crude_death_rate + cocaine_crude_death_rate + meth_crude_death_rate + heroin + tx_su + tx_mental + mental,
  # Full-spatial model
  formula = synthetic_opioid_deaths ~ 1 + f(index, model = "besag", graph = "map.graph.W") + f(year, model = "rw1") + urgent_care + proportion_uninsured + proportion_male + proportion_white + proportion_black + proportion_american_indian_alaska_native + proportion_asian + proportion_native_hawaiian_pacific_islander + proportion_high_school_or_greater + proportion_bachelors_or_greater + proportion_poverty + unemployment_rate + mean_household_income + proportion_homeowners_35perc_income + proportion_renters_35perc_income + urbanicity + NFLIS + opioid_prescriptions_per_100 + police_violence + road_access + hep_c_mortality_rate + heroin_crude_death_rate + cocaine_crude_death_rate + meth_crude_death_rate + heroin + tx_su + tx_mental + mental)

# -----------------
# Model Estimation
# -----------------
names(W)<-c("null", "spatio-temporal", "healthcare", "socio-economic", "drug-market", "suscep", "full", "full-spat")

INLA:::inla.dynload.workaround()
m.W <- W %>% purrr::map(~inla.batch.safe(formula = ., dat1 = dat.W))

W.s <- m.W %>%
  purrr::map(~Rsq.batch.safe(model = ., dic.null = m.W[[1]]$dic, n = n.W)) %>%
  bind_rows(.id = "formula") %>% mutate(id = row_number())
## [1] 0
## [1] 0.6027076
## [1] 0.1697564
## [1] 0.4378448
## [1] 0.1611284
## [1] 0.3956257
## [1] 0.544795
## [1] 0.6184265
## # A tibble: 8 x 8
##   formula           Rsq   DIC     pD `log score`  waic `waic pD`    id
##   <chr>           <dbl> <dbl>  <dbl>       <dbl> <dbl>     <dbl> <int>
## 1 null            0     6276.   1.03       0.950 6294.      18.2     1
## 2 spatio-temporal 0.603 3545. 164.         0.549 3540.     136.      2
## 3 healthcare      0.170 5664.   3.03       0.858 5685.      23.7     3
## 4 socio-economic  0.438 4405.  19.0        0.675 4470.      78.5     4
## 5 drug-market     0.161 5702.   5.03       0.864 5740.      40.8     5
## 6 suscep          0.396 4624.   9.03       0.706 4673.      51.9     6
## 7 full            0.545 3734.  33.0        0.572 3783.      73.5     7
## 8 full-spat       0.618 3311. 114.         0.507 3334.     116.      8
# -----------------
# RMSE
# -----------------
library(Metrics)
dt.pred.W <- dat.W %>%
  nest() %>%
  tidyr::expand_grid(model=m.W) %>%
  mutate(id = 1:n()) %>%
  mutate(pred = purrr::map(.x = model, .f = ~.$summary.fitted.values$`0.5quant`),
         data_preds = purrr::map2(.x = data, .y = pred, .f = ~mutate(.x, pred = .y)),
         rmse = purrr::map_dbl(.x = data_preds, .f = ~rmse(actual = .$synthetic_opioid_deaths, predicted = .$pred)),
         mae = purrr::map_dbl(.x = data_preds, .f = ~mae(actual = .$synthetic_opioid_deaths, predicted = .$pred)),
         msle = purrr::map_dbl(.x = data_preds, .f = ~msle(actual = .$synthetic_opioid_deaths, predicted = .$pred)),
         mod = names(W)) %>%
  dplyr::select(id, mod, rmse:msle)

dt.pred.W
## # A tibble: 8 x 5
##      id mod              rmse   mae   msle
##   <int> <chr>           <dbl> <dbl>  <dbl>
## 1     1 null             5.03 0.990 0.111
## 2     2 spatio-temporal  2.26 0.442 0.0262
## 3     3 healthcare       4.44 0.916 0.103
## 4     4 socio-economic   3.36 0.697 0.0655
## 5     5 drug-market      4.51 0.918 0.0988
## 6     6 suscep           3.15 0.730 0.0772
## 7     7 full             2.13 0.543 0.0481
## 8     8 full-spat        1.75 0.396 0.0256
# -----------------
# Fixed Effects
# -----------------

m.W[c(7,8)] %>% plot_fixed(
  title = "Contextual variables coefficient",
  filter=10,
  lim = c("urgent_care","proportion_uninsured", "proportion_male", "proportion_white", "proportion_black",
"proportion_american_indian_alaska_native","proportion_asian", "proportion_native_hawaiian_pacific_islander", "proportion_high_school_or_greater", "proportion_bachelors_or_greater", "proportion_poverty", "unemployment_rate", "mean_household_income", "proportion_homeowners_35perc_income", "proportion_renters_35perc_income", "urbanicity", "NFLIS", "opioid_prescriptions_per_100", "police_violence", "road_access", "hep_c_mortality_rate", "heroin_crude_death_rate", "cocaine_crude_death_rate", "meth_crude_death_rate", "heroin", "tx_su", "tx_mental", "mental"),
  breaks=c("1","2"),
  lab_mod=c("Full model", "Full-spatial"), ylab = "exp(mean)", ylim = 2)
## [1] "Deprecated, update to plot_random3"
##
## Call:
##    c("inla(formula = formula, family = \"poisson\", data = dat1, offset =
##    log(population), ", " verbose = F, control.compute = list(config = T,
##    dic = T, ", " cpo = T, waic = T), control.predictor = list(link = 1, ",
##    " compute = TRUE), control.fixed = list(correlation.matrix = T))" )
## Time used:
##     Pre = 4.03, Running = 18.6, Post = 1.74, Total = 24.4
## Fixed effects:
##                                                mean    sd 0.025quant 0.5quant
## (Intercept)                                 -11.762 0.225    -12.205  -11.761
## urgent_careTRUE                              -0.753 0.211     -1.180   -0.749
## proportion_uninsured                          0.097 0.060     -0.020    0.097
## proportion_male                              -0.243 0.140     -0.526   -0.241
## proportion_white                              0.018 0.117     -0.213    0.018
## proportion_black                             -0.027 0.052     -0.128   -0.027
## proportion_american_indian_alaska_native      0.201 0.108     -0.011    0.201
## proportion_asian                              0.000 0.069     -0.137    0.001
## proportion_native_hawaiian_pacific_islander   0.073 0.054     -0.036    0.074
## proportion_high_school_or_greater             0.082 0.109     -0.131    0.082
## proportion_bachelors_or_greater               0.067 0.102     -0.135    0.067
## proportion_poverty                            0.016 0.115     -0.212    0.017
## unemployment_rate                             0.012 0.084     -0.152    0.011
## mean_household_income                        -0.017 0.097     -0.207   -0.017
## proportion_homeowners_35perc_income           0.110 0.090     -0.064    0.110
## proportion_renters_35perc_income             -0.156 0.120     -0.390   -0.157
## urbanicity2                                  -0.117 0.177     -0.472   -0.116
## urbanicity3                                   0.126 0.185     -0.239    0.126
## urbanicity4                                  -0.384 0.221     -0.825   -0.382
## urbanicity5                                  -1.630 0.278     -2.188   -1.626
## urbanicity6                                  -4.731 1.043     -7.051   -4.626
## NFLIS                                         0.058 0.015      0.029    0.058
## opioid_prescriptions_per_100                 -0.081 0.097     -0.273   -0.081
## police_violenceTRUE                           0.061 0.073     -0.083    0.060
## road_accessTRUE                              -0.268 0.168     -0.605   -0.266
## hep_c_mortality_rate                         -0.065 0.036     -0.136   -0.064
## heroin_crude_death_rate                       0.014 0.033     -0.053    0.015
## cocaine_crude_death_rate                      0.077 0.024      0.030    0.077
## meth_crude_death_rate                         0.172 0.026      0.121    0.172
## heroin                                       -0.058 0.024     -0.106   -0.057
## tx_su                                         0.001 0.030     -0.057    0.001
## tx_mental                                    -0.007 0.058     -0.122   -0.007
## mental                                       -0.125 0.044     -0.212   -0.125
##                                             0.975quant    mode kld
## (Intercept)                                    -11.320 -11.761   0
## urgent_careTRUE                                 -0.351  -0.740   0
## proportion_uninsured                             0.214   0.097   0
## proportion_male                                  0.024  -0.235   0
## proportion_white                                 0.248   0.019   0
## proportion_black                                 0.076  -0.028   0
## proportion_american_indian_alaska_native         0.414   0.200   0
## proportion_asian                                 0.136   0.002   0
## proportion_native_hawaiian_pacific_islander      0.177   0.076   0
## proportion_high_school_or_greater                0.296   0.081   0
## proportion_bachelors_or_greater                  0.266   0.068   0
## proportion_poverty                               0.241   0.018   0
## unemployment_rate                                0.177   0.011   0
## mean_household_income                            0.174  -0.017   0
## proportion_homeowners_35perc_income              0.288   0.108   0
## proportion_renters_35perc_income                 0.082  -0.159   0
## urbanicity2                                      0.227  -0.112   0
## urbanicity3                                      0.491   0.125   0
## urbanicity4                                      0.047  -0.379   0
## urbanicity5                                     -1.096  -1.618   0
## urbanicity6                                     -2.968  -4.398   0
## NFLIS                                            0.087   0.058   0
## opioid_prescriptions_per_100                     0.109  -0.080   0
## police_violenceTRUE                              0.205   0.060   0
## road_accessTRUE                                  0.057  -0.262   0
## hep_c_mortality_rate                             0.006  -0.064   0
## heroin_crude_death_rate                          0.078   0.016   0
## cocaine_crude_death_rate                         0.125   0.077   0
## meth_crude_death_rate                            0.222   0.172   0
## heroin                                          -0.010  -0.057   0
## tx_su                                            0.059   0.001   0
## tx_mental                                        0.108  -0.007   0
## mental                                          -0.038  -0.125   0
##
## Linear combinations (derived):
##                                             ID    mean    sd 0.025quant
## (Intercept)                                  1 -11.762 0.225    -12.205
## urgent_careTRUE                              2  -0.753 0.211     -1.171
## proportion_uninsured                         3   0.097 0.060     -0.020
## proportion_male                              4  -0.243 0.140     -0.520
## proportion_white                             5   0.018 0.117     -0.214
## proportion_black                             6  -0.027 0.052     -0.128
## proportion_american_indian_alaska_native     7   0.201 0.108     -0.011
## proportion_asian                             8   0.000 0.069     -0.138
## proportion_native_hawaiian_pacific_islander  9   0.073 0.054     -0.036
## proportion_high_school_or_greater           10   0.082 0.109     -0.131
## proportion_bachelors_or_greater             11   0.067 0.102     -0.135
## proportion_poverty                          12   0.016 0.115     -0.211
## unemployment_rate                           13   0.012 0.084     -0.151
## mean_household_income                       14  -0.017 0.097     -0.207
## proportion_homeowners_35perc_income         15   0.110 0.090     -0.064
## proportion_renters_35perc_income            16  -0.156 0.120     -0.390
## urbanicity2                                 17  -0.118 0.177     -0.472
## urbanicity3                                 18   0.126 0.185     -0.239
## urbanicity4                                 19  -0.384 0.221     -0.825
## urbanicity5                                 20  -1.631 0.277     -2.185
## urbanicity6                                 21  -4.730 1.045     -6.782
## NFLIS                                       22   0.058 0.015      0.029
## opioid_prescriptions_per_100                23  -0.081 0.097     -0.273
## police_violenceTRUE                         24   0.061 0.073     -0.083
## road_accessTRUE                             25  -0.269 0.168     -0.603
## hep_c_mortality_rate                        26  -0.065 0.036     -0.136
## heroin_crude_death_rate                     27   0.014 0.033     -0.052
## cocaine_crude_death_rate                    28   0.077 0.024      0.030
## meth_crude_death_rate                       29   0.172 0.026      0.122
## heroin                                      30  -0.058 0.024     -0.105
## tx_su                                       31   0.001 0.030     -0.057
## tx_mental                                   32  -0.007 0.058     -0.122
## mental                                      33  -0.125 0.044     -0.212
##                                             0.5quant 0.975quant    mode kld
## (Intercept)                                  -11.762    -11.320 -11.762   0
## urgent_careTRUE                               -0.752     -0.342  -0.749   0
## proportion_uninsured                           0.097      0.214   0.097   0
## proportion_male                               -0.243      0.030  -0.242   0
## proportion_white                               0.019      0.247   0.020   0
## proportion_black                              -0.027      0.076  -0.028   0
## proportion_american_indian_alaska_native       0.201      0.414   0.200   0
## proportion_asian                               0.001      0.136   0.002   0
## proportion_native_hawaiian_pacific_islander    0.074      0.177   0.076   0
## proportion_high_school_or_greater              0.082      0.296   0.081   0
## proportion_bachelors_or_greater                0.067      0.266   0.068   0
## proportion_poverty                             0.016      0.241   0.017   0
## unemployment_rate                              0.011      0.177   0.010   0
## mean_household_income                         -0.017      0.174  -0.018   0
## proportion_homeowners_35perc_income            0.110      0.287   0.109   0
## proportion_renters_35perc_income              -0.157      0.082  -0.159   0
## urbanicity2                                   -0.116      0.227  -0.112   0
## urbanicity3                                    0.126      0.491   0.125   0
## urbanicity4                                   -0.383      0.047  -0.380   0
## urbanicity5                                   -1.628     -1.093  -1.622   0
## urbanicity6                                   -4.730     -2.681  -4.729   0
## NFLIS                                          0.058      0.087   0.058   0
## opioid_prescriptions_per_100                  -0.080      0.109  -0.080   0
## police_violenceTRUE                            0.061      0.204   0.061   0
## road_accessTRUE                               -0.267      0.059  -0.265   0
## hep_c_mortality_rate                          -0.065      0.007  -0.065   0
## heroin_crude_death_rate                        0.014      0.079   0.014   0
## cocaine_crude_death_rate                       0.077      0.125   0.077   0
## meth_crude_death_rate                          0.172      0.222   0.172   0
## heroin                                        -0.058     -0.010  -0.058   0
## tx_su                                          0.001      0.059   0.001   0
## tx_mental                                     -0.007      0.108  -0.007   0
## mental                                        -0.125     -0.038  -0.125   0
##
## Random effects:
##   Name	  Model
##     index Besags ICAR model
##    year RW1 model
##
## Model hyperparameters:
##                      mean     sd 0.025quant 0.5quant 0.975quant  mode
## Precision for index  1.45  0.387      0.849     1.40       2.36  1.30
## Precision for year  32.94 19.951      8.966    28.33      84.34 20.54
##
## Expected number of effective parameters(stdev): 113.99(6.25)
## Number of equivalent replicates : 29.06
##
## Deviance Information Criterion (DIC) ...............: 3310.60
## Deviance Information Criterion (DIC, saturated) ....: 1023.30
## Effective number of parameters .....................: 113.68
##
## Watanabe-Akaike information criterion (WAIC) ...: 3334.28
## Effective number of parameters .................: 116.15
##
## Marginal log-Likelihood:  -2214.30
## CPO and PIT are computed
##
## Posterior marginals for the linear predictor and
##  the fitted values are computed
MidWest
# -----------------
# Data
# -----------------
usa.M <- usa.sf %>%
  filter(loc == "MW") %>%
  mutate(index = 1:n(),
         index2 = index)

nb.map.M <- poly2nb(usa.M)
#nb2INLA("map.graph.M",nb.map.M)

index.M <- usa.M %>%
  dplyr::select(County.Code, ALAND, index, index2) %>%
  st_set_geometry(NULL)

dat.M <- data %>%
  inner_join(index.M, by="County.Code") %>%
  inner_join(n.neighbors(nb.map.M), by = "index") %>%
  dplyr::select(-County.Code, -index2) %>%
  mutate(urbanicity = factor(urbanicity),
         synthetic_opioid_crude_death_rate = as.character(synthetic_opioid_crude_death_rate),
         population = as.character(population),
         synthetic_opioid_deaths = as.character(synthetic_opioid_deaths),
         year = as.character(year),
         index = as.character(index)) %>%
  mutate_if(is.numeric, scale_this) %>%
  mutate(synthetic_opioid_crude_death_rate = as.numeric(synthetic_opioid_crude_death_rate),
         population = as.numeric(population),
         synthetic_opioid_deaths = floor(as.numeric(synthetic_opioid_deaths)),
         year = as.numeric(year),
         index = as.numeric(index))

n.M<-nrow(dat.M)

# -----------------
# Formula
# -----------------

M<-c(
  # NULL
  formula = synthetic_opioid_deaths ~ 1,
  # Spatio-temporal only
  formula = synthetic_opioid_deaths ~ 1 + f(index, model = "besag", graph = "map.graph.M") + f(year, model = "rw1"),
  # Healthcare system
  formula = synthetic_opioid_deaths ~ 1 + urgent_care + proportion_uninsured,
  #Socio-economic
  formula = synthetic_opioid_deaths ~ 1 + proportion_male + proportion_white + proportion_black + proportion_american_indian_alaska_native + proportion_asian + proportion_native_hawaiian_pacific_islander + proportion_high_school_or_greater + proportion_bachelors_or_greater + proportion_poverty + unemployment_rate + mean_household_income + proportion_homeowners_35perc_income + proportion_renters_35perc_income + urbanicity,
  # Drug market
  formula = synthetic_opioid_deaths ~ 1 + NFLIS + opioid_prescriptions_per_100 + police_violence + road_access,
  # Individual susceptibility/prevalence of drug use
  formula = synthetic_opioid_deaths ~ 1 + hep_c_mortality_rate + heroin_crude_death_rate + cocaine_crude_death_rate + meth_crude_death_rate + heroin + tx_su + tx_mental + mental,
  # Full model
  formula = synthetic_opioid_deaths ~ 1 + urgent_care + proportion_uninsured + proportion_male + proportion_white + proportion_black + proportion_american_indian_alaska_native + proportion_asian + proportion_native_hawaiian_pacific_islander + proportion_high_school_or_greater + proportion_bachelors_or_greater + proportion_poverty + unemployment_rate + mean_household_income + proportion_homeowners_35perc_income + proportion_renters_35perc_income + urbanicity + NFLIS + opioid_prescriptions_per_100 + police_violence + road_access + hep_c_mortality_rate + heroin_crude_death_rate + cocaine_crude_death_rate + meth_crude_death_rate + heroin + tx_su + tx_mental + mental,
  # Full-spatial model
  formula = synthetic_opioid_deaths ~ 1 + f(index, model = "besag", graph = "map.graph.M") + f(year, model = "rw1") + urgent_care + proportion_uninsured + proportion_male + proportion_white + proportion_black + proportion_american_indian_alaska_native + proportion_asian + proportion_native_hawaiian_pacific_islander + proportion_high_school_or_greater + proportion_bachelors_or_greater + proportion_poverty + unemployment_rate + mean_household_income + proportion_homeowners_35perc_income + proportion_renters_35perc_income + urbanicity + NFLIS + opioid_prescriptions_per_100 + police_violence + road_access + hep_c_mortality_rate + heroin_crude_death_rate + cocaine_crude_death_rate + meth_crude_death_rate + heroin + tx_su + tx_mental + mental)

# -----------------
# Model Estimation
# -----------------
names(M)<-c("null", "spatio-temporal", "healthcare", "socio-economic", "drug-market", "suscep", "full", "full-spat")

INLA:::inla.dynload.workaround()
m.M <- M %>% purrr::map(~inla.batch.safe(formula = ., dat1 = dat.M))

M.s <- m.M %>%
  purrr::map(~Rsq.batch.safe(model = ., dic.null = m.M[[1]]$dic, n = n.M)) %>%
  bind_rows(.id = "formula") %>% mutate(id = row_number())
## [1] 0
## [1] 0.990271
## [1] 0.5547748
## [1] 0.9501745
## [1] 0.9216324
## [1] 0.9738981
## [1] 0.9847271
## [1] 0.9909241
## # A tibble: 8 x 8
##   formula           Rsq    DIC     pD `log score`   waic `waic pD`    id
##   <chr>           <dbl>  <dbl>  <dbl>       <dbl>  <dbl>     <dbl> <int>
## 1 null            0     47826.   1.11       2.81  47413.      121.     1
## 2 spatio-temporal 0.990  9485. 362.         0.588  9752.      523.     2
## 3 healthcare      0.555 41007.   3.11       2.42  41033.      192.     3
## 4 socio-economic  0.950 22573.  19.1        1.34  23124.      519.     4
## 5 drug-market     0.922 26364.   5.11       1.56  26563.      198.     5
## 6 suscep          0.974 17101.   9.11       1.00  17452.      323.     6
## 7 full            0.985 12631.  33.1        0.767 13007.      361.     7
## 8 full-spat       0.991  8780. 302.         0.547  9094.      506.     8
# -----------------
# RMSE
# -----------------
library(Metrics)
dt.pred.M <- dat.M %>%
  nest() %>%
  tidyr::expand_grid(model=m.M) %>%
  mutate(id = 1:n()) %>%
  mutate(pred = purrr::map(.x = model, .f = ~.$summary.fitted.values$`0.5quant`),
         data_preds = purrr::map2(.x = data, .y = pred, .f = ~mutate(.x, pred = .y)),
         rmse = purrr::map_dbl(.x = data_preds, .f = ~rmse(actual = .$synthetic_opioid_deaths, predicted = .$pred)),
         mae = purrr::map_dbl(.x = data_preds, .f = ~mae(actual = .$synthetic_opioid_deaths, predicted = .$pred)),
         msle = purrr::map_dbl(.x = data_preds, .f = ~msle(actual = .$synthetic_opioid_deaths, predicted = .$pred)),
         mod = names(M)) %>%
  dplyr::select(id, mod, rmse:msle)

dt.pred.M
## # A tibble: 8 x 5
##      id mod              rmse   mae   msle
##   <int> <chr>           <dbl> <dbl>  <dbl>
## 1     1 null            15.2  2.58  0.444
## 2     2 spatio-temporal  3.48 0.605 0.0443
## 3     3 healthcare      14.6  2.38  0.362
## 4     4 socio-economic   9.65 1.60  0.203
## 5     5 drug-market     11.4  1.68  0.188
## 6     6 suscep          10.2  1.30  0.131
## 7     7 full             6.32 0.982 0.0835
## 8     8 full-spat        3.19 0.541 0.0385
# -----------------
# Fixed Effects
# -----------------

m.M[c(7,8)] %>% plot_fixed(
  title = "Contextual variables coefficient",
  filter=10,
  lim = c("urgent_care","proportion_uninsured", "proportion_male", "proportion_white", "proportion_black",
"proportion_american_indian_alaska_native","proportion_asian", "proportion_native_hawaiian_pacific_islander", "proportion_high_school_or_greater", "proportion_bachelors_or_greater", "proportion_poverty", "unemployment_rate", "mean_household_income", "proportion_homeowners_35perc_income", "proportion_renters_35perc_income", "urbanicity", "NFLIS", "opioid_prescriptions_per_100", "police_violence", "road_access", "hep_c_mortality_rate", "heroin_crude_death_rate", "cocaine_crude_death_rate", "meth_crude_death_rate", "heroin", "tx_su", "tx_mental", "mental"),
  breaks=c("1","2"),
  lab_mod=c("Full model", "Full-spatial"), ylab = "exp(mean)", ylim = 2)
## [1] "Deprecated, update to plot_random3"
##
## Call:
##    c("inla(formula = formula, family = \"poisson\", data = dat1, offset =
##    log(population), ", " verbose = F, control.compute = list(config = T,
##    dic = T, ", " cpo = T, waic = T), control.predictor = list(link = 1, ",
##    " compute = TRUE), control.fixed = list(correlation.matrix = T))" )
## Time used:
##     Pre = 4.32, Running = 86, Post = 4.33, Total = 94.7
## Fixed effects:
##                                                mean    sd 0.025quant 0.5quant
## (Intercept)                                 -12.719 0.220    -13.156  -12.717
## urgent_careTRUE                              -0.412 0.083     -0.577   -0.412
## proportion_uninsured                         -0.014 0.049     -0.111   -0.014
## proportion_male                              -0.036 0.046     -0.126   -0.035
## proportion_white                             -0.321 0.173     -0.660   -0.321
## proportion_black                             -0.113 0.095     -0.299   -0.113
## proportion_american_indian_alaska_native     -0.584 0.232     -1.072   -0.573
## proportion_asian                             -0.096 0.044     -0.184   -0.096
## proportion_native_hawaiian_pacific_islander   0.082 0.031      0.020    0.082
## proportion_high_school_or_greater             0.203 0.070      0.066    0.202
## proportion_bachelors_or_greater               0.142 0.069      0.006    0.141
## proportion_poverty                            0.300 0.073      0.156    0.300
## unemployment_rate                            -0.450 0.055     -0.558   -0.449
## mean_household_income                        -0.033 0.063     -0.158   -0.033
## proportion_homeowners_35perc_income           0.055 0.054     -0.052    0.055
## proportion_renters_35perc_income              0.002 0.056     -0.109    0.002
## urbanicity2                                   0.085 0.197     -0.301    0.084
## urbanicity3                                   0.034 0.204     -0.367    0.034
## urbanicity4                                   0.109 0.206     -0.294    0.108
## urbanicity5                                  -0.224 0.216     -0.647   -0.224
## urbanicity6                                  -0.597 0.233     -1.055   -0.597
## NFLIS                                         0.028 0.009      0.010    0.028
## opioid_prescriptions_per_100                  0.240 0.049      0.144    0.240
## police_violenceTRUE                          -0.045 0.028     -0.101   -0.045
## road_accessTRUE                              -0.360 0.093     -0.543   -0.359
## hep_c_mortality_rate                          0.072 0.012      0.048    0.072
## heroin_crude_death_rate                       0.108 0.008      0.093    0.108
## cocaine_crude_death_rate                      0.038 0.005      0.029    0.038
## meth_crude_death_rate                         0.020 0.005      0.009    0.020
## heroin                                        0.031 0.020     -0.009    0.031
## tx_su                                         0.048 0.030     -0.011    0.048
## tx_mental                                    -0.086 0.031     -0.148   -0.086
## mental                                        0.157 0.026      0.106    0.157
##                                             0.975quant    mode kld
## (Intercept)                                    -12.291 -12.714   0
## urgent_careTRUE                                 -0.249  -0.411   0
## proportion_uninsured                             0.083  -0.014   0
## proportion_male                                  0.054  -0.035   0
## proportion_white                                 0.020  -0.322   0
## proportion_black                                 0.073  -0.114   0
## proportion_american_indian_alaska_native        -0.160  -0.550   0
## proportion_asian                                -0.010  -0.095   0
## proportion_native_hawaiian_pacific_islander      0.143   0.083   0
## proportion_high_school_or_greater                0.341   0.202   0
## proportion_bachelors_or_greater                  0.279   0.141   0
## proportion_poverty                               0.445   0.300   0
## unemployment_rate                               -0.342  -0.449   0
## mean_household_income                            0.091  -0.032   0
## proportion_homeowners_35perc_income              0.161   0.055   0
## proportion_renters_35perc_income                 0.112   0.002   0
## urbanicity2                                      0.473   0.084   0
## urbanicity3                                      0.435   0.033   0
## urbanicity4                                      0.515   0.107   0
## urbanicity5                                      0.201  -0.224   0
## urbanicity6                                     -0.139  -0.597   0
## NFLIS                                            0.047   0.028   0
## opioid_prescriptions_per_100                     0.336   0.240   0
## police_violenceTRUE                              0.010  -0.045   0
## road_accessTRUE                                 -0.178  -0.359   0
## hep_c_mortality_rate                             0.096   0.073   0
## heroin_crude_death_rate                          0.123   0.108   0
## cocaine_crude_death_rate                         0.048   0.038   0
## meth_crude_death_rate                            0.030   0.020   0
## heroin                                           0.071   0.031   0
## tx_su                                            0.107   0.048   0
## tx_mental                                       -0.024  -0.086   0
## mental                                           0.208   0.157   0
##
## Linear combinations (derived):
##                                             ID    mean    sd 0.025quant
## (Intercept)                                  1 -12.719 0.220    -13.156
## urgent_careTRUE                              2  -0.412 0.083     -0.577
## proportion_uninsured                         3  -0.014 0.049     -0.111
## proportion_male                              4  -0.036 0.046     -0.125
## proportion_white                             5  -0.321 0.173     -0.662
## proportion_black                             6  -0.113 0.095     -0.300
## proportion_american_indian_alaska_native     7  -0.584 0.232     -1.040
## proportion_asian                             8  -0.096 0.044     -0.184
## proportion_native_hawaiian_pacific_islander  9   0.082 0.031      0.020
## proportion_high_school_or_greater           10   0.203 0.070      0.066
## proportion_bachelors_or_greater             11   0.142 0.069      0.006
## proportion_poverty                          12   0.300 0.073      0.156
## unemployment_rate                           13  -0.450 0.055     -0.558
## mean_household_income                       14  -0.033 0.063     -0.158
## proportion_homeowners_35perc_income         15   0.055 0.054     -0.052
## proportion_renters_35perc_income            16   0.002 0.056     -0.109
## urbanicity2                                 17   0.085 0.197     -0.301
## urbanicity3                                 18   0.034 0.204     -0.367
## urbanicity4                                 19   0.109 0.206     -0.294
## urbanicity5                                 20  -0.224 0.216     -0.647
## urbanicity6                                 21  -0.597 0.233     -1.055
## NFLIS                                       22   0.028 0.009      0.010
## opioid_prescriptions_per_100                23   0.240 0.049      0.144
## police_violenceTRUE                         24  -0.045 0.028     -0.101
## road_accessTRUE                             25  -0.360 0.093     -0.543
## hep_c_mortality_rate                        26   0.072 0.012      0.048
## heroin_crude_death_rate                     27   0.108 0.008      0.093
## cocaine_crude_death_rate                    28   0.038 0.005      0.029
## meth_crude_death_rate                       29   0.020 0.005      0.009
## heroin                                      30   0.031 0.020     -0.009
## tx_su                                       31   0.048 0.030     -0.011
## tx_mental                                   32  -0.086 0.031     -0.148
## mental                                      33   0.157 0.026      0.106
##                                             0.5quant 0.975quant    mode kld
## (Intercept)                                  -12.718    -12.291 -12.714   0
## urgent_careTRUE                               -0.412     -0.249  -0.411   0
## proportion_uninsured                          -0.014      0.083  -0.014   0
## proportion_male                               -0.036      0.054  -0.036   0
## proportion_white                              -0.321      0.018  -0.320   0
## proportion_black                              -0.113      0.073  -0.113   0
## proportion_american_indian_alaska_native      -0.584     -0.128  -0.583   0
## proportion_asian                              -0.096     -0.010  -0.095   0
## proportion_native_hawaiian_pacific_islander    0.082      0.143   0.082   0
## proportion_high_school_or_greater              0.203      0.341   0.203   0
## proportion_bachelors_or_greater                0.141      0.279   0.141   0
## proportion_poverty                             0.300      0.445   0.300   0
## unemployment_rate                             -0.450     -0.341  -0.450   0
## mean_household_income                         -0.033      0.091  -0.032   0
## proportion_homeowners_35perc_income            0.055      0.161   0.055   0
## proportion_renters_35perc_income               0.002      0.112   0.002   0
## urbanicity2                                    0.084      0.473   0.083   0
## urbanicity3                                    0.033      0.435   0.033   0
## urbanicity4                                    0.108      0.515   0.107   0
## urbanicity5                                   -0.224      0.201  -0.225   0
## urbanicity6                                   -0.597     -0.139  -0.598   0
## NFLIS                                          0.028      0.047   0.028   0
## opioid_prescriptions_per_100                   0.240      0.336   0.240   0
## police_violenceTRUE                           -0.045      0.010  -0.045   0
## road_accessTRUE                               -0.360     -0.178  -0.359   0
## hep_c_mortality_rate                           0.072      0.096   0.072   0
## heroin_crude_death_rate                        0.108      0.123   0.108   0
## cocaine_crude_death_rate                       0.038      0.048   0.038   0
## meth_crude_death_rate                          0.020      0.030   0.020   0
## heroin                                         0.031      0.071   0.031   0
## tx_su                                          0.048      0.107   0.048   0
## tx_mental                                     -0.086     -0.024  -0.086   0
## mental                                         0.157      0.208   0.157   0
##
## Random effects:
##   Name	  Model
##     index Besags ICAR model
##    year RW1 model
##
## Model hyperparameters:
##                      mean    sd 0.025quant 0.5quant 0.975quant  mode
## Precision for index 0.804 0.092      0.636     0.80      0.997 0.794
## Precision for year  5.165 2.498      1.692     4.72     11.237 3.813
##
## Expected number of effective parameters(stdev): 306.92(8.99)
## Number of equivalent replicates : 27.47
##
## Deviance Information Criterion (DIC) ...............: 8780.35
## Deviance Information Criterion (DIC, saturated) ....: 3767.72
## Effective number of parameters .....................: 302.23
##
## Watanabe-Akaike information criterion (WAIC) ...: 9093.85
## Effective number of parameters .................: 506.44
##
## Marginal log-Likelihood:  -5629.82
## CPO and PIT are computed
##
## Posterior marginals for the linear predictor and
##  the fitted values are computed