Section 4 Child-Serving Organizations
4.1 Introduction
This section of the report includes quantitative and qualitative research findings from a survey and interview protocol that were intended to provide information around concepts related to trauma and racial equity policies and practices within human service institutions. The institutions and/or organizational types included in the analysis were Winston-Salem/Forsyth County Schools, Department of Social Services, medical providers (Wake Forest Baptist Health and Novant Health), child care and Pre-K providers, and home visitation service providers. The survey included the following constructs or measures:
- staff experiences of ACEs
- staff impact of COVID-19
- staff experiences of Secondary Traumatic Stress (STS)
- current implementation of trauma-informed practices
- familiarity with trauma-informed practices
- environmental assessment
- staff practices
- transformational leadership
More detailed descriptions of each of these measures or constructs can be found in their respective section introductions. Interviews with institutional/organizational representatives include information on how organizations are approaching racial justice and equity based policies and practices.
4.1.1 Key Findings
4.1.1.1 Adverse Childhood Experiences, COVID-19, and Secondary Traumatic Stress
- Most respondents in child-serving agencies have experienced at least one ACE, with almost half experiencing 1-3 ACEs. The reported ACEs of staff in child-serving agencies closely mirrored the adverse experiences of adults in Forsyth County in general, which means that staff may be interacting with families who have experienced or are experiencing similar trauma to what they have experienced.
- About 44% of staff in child-serving agencies reported experiences of discrimination. Respondents who identified as Black / African American, who did not identify as White, and middle-income respondents were the most likely to report experiences of discrimination.
- 78% of respondents reported being at least somewhat impacted by COVID-19, and 20% reported being “very much impacted,” and interviews with staff found that COVID-19 both impacted how providers were serving the community and added personal and professional stressors and trauma.
- Scores on the Secondary Traumatic Stress Scale subscales were generally low, but some respondents did have high scores. Staff reporting that they were not impacted by COVID-19 reported fewer indications of arousal in particular.
4.1.1.2 Current State of Trauma Informed Practice
- About 72% of respondents in child-serving agencies were not familiar with the TRC model, and an additional 26% of respondents reported familiarity with the model but no training.
- Respondents with higher levels of training generally scored higher on the staff practices survey, indicating higher levels of alignment with trauma informed care practice at their agencies.
- Environmental assessment and staff practice scales indicated neutral to moderately high levels of alignment with trauma informed practice, but there was variation across respondents, particularly in the environmental assessment. Respondent experiences may differ across different agencies.
- Organizational leaders often had higher scores than other employees on scales measuring the alignment of staff practice and their environments, which indicates that their experiences may be different from other staff in significant ways.
4.1.1.3 Racial Equity and Structural Violence
- Interview participants indicated that there is a greater sense of urgency for racial equity-based work within the past few years with some respondents reporting additional organizational activities around racial equity as a response to broader socio-political events (e.g., the George Floyd protests). This also reflects a main finding among a plurality of interview participants which is that racial-equity based work is an area of growth or at least not at the level it should be at their organization.
- Some organizations prioritize diversity of staff over diversity of leadership in order to match the populations they serve. In these cases, there can be less diversity in leadership, reflecting the lack of an employee pipeline within the organization for people of color.
- Some organizations have sufficient resources to engage in racial equity-based practices and policies, while others face barriers such as leadership, funding, and/or staff buy-in.
- Respondents reported that, in general, their organization’s culture is inclusive and supportive of people from diverse backgrounds, however several respondents indicated that there is an expectation for people of color to assimilate into dominant white norm culture.
4.1.2 Methodology
To learn more about current trauma-informed practices and styles of leadership at child-serving agencies and the experiences of their staff, analysts designed a survey to measure staff experiences of Adverse Childhood Experiences (ACEs), the impact of COVID-19, Secondary Traumatic Stress (STS), familiarity with trauma informed practices, alignment of the work environment, and staff practice with a trauma-informed model. These topics were selected and prioritized by the TRC Advisory Committee. Experiences of ACEs, STS, the work environment, and staff practice were measured using survey questions that have been tested by other researchers and found to be good measures of those concepts. These groups of questions are combined to make scales and subscales. The scores on these scales and subscales are used to measure these concepts.
The survey instrument and data collection plan were shared with the Institutional Review Board at Wake Forest Baptist Health to ensure that researchers were protecting the privacy and rights of research participants. To collect survey data, analysts reached out to organizational leaders at agencies and organizations in Forsyth County that provide child care, home visitation, medical care, or educational services to children, asking them to invite the staff at their organization to take the survey online.
Analysts used instructions provided by the researchers who wrote the scales to calculate scores. They ran tests to ensure that people were answering questions about the concepts in the scales relatively consistently; a sign that the measures are working as expected. The results of these tests can be found in Appendix A: Output Tables. For scenarios in which respondents skipped particular items on a scale, the score of those respondents was not calculated for that scale, but their answers were used for other scales.
Analysts worked with the TRC Advisory committee to identify which organizations would be invited to complete the survey and which kinds of organizations would be included in the analysis. A total of 255 surveys met the survey-inclusion criteria. The criteria dictate that respondents be at least 18 years old, consent to participate, complete at least the first set of questions in the survey, and be currently employed at an agency or organization in Forsyth County that provides child care, home visitation, medical care, or educational services to children.
The tables below show the demographic distribution of respondents who answered the survey. To protect respondent privacy, analysts did not report disaggregated findings for demographic groups with fewer than 10 respondents. For example, 2 respondents self-identified as Asian. Analysts included these respondents’ data, but did not report results for Asian respondents specifically in any disaggregated summaries.
4.1.2.1 Demographics of Respondents
4.1.2.1.1 Gender and Sexual Orientation
Table 4.1 shows that 89% of survey respondents identified themselves as women compared to 11% who identified as men and less than 1% who identified as Non-binary / third gender.
| Gender | Respondents (n = 255) |
|---|---|
| Woman | 226 ( 89 %) |
| Man | 27 ( 11 %) |
| Non-binary / third gender | 1 ( 0 %) |
| Prefer not to answer | 1 ( 0 %) |
Table 4.2 shows that 93% of survey respondents identified themselves as heterosexual compared to 3% who identified as Gay or Lesbian and less than 2% who identified as preferred not to answer.
| Sexual Orientation | Respondents (n = 254) |
|---|---|
| Heterosexual | 237 ( 93 %) |
| Gay or Lesbian | 8 ( 3 %) |
| Pansexual | 1 ( 0 %) |
| Bisexual | 1 ( 0 %) |
| Prefer to self-describe another way | 1 ( 0 %) |
| Prefer not to answer | 6 ( 2 %) |
4.1.2.1.2 Race and Ethnicity
Table 4.3 shows that 95% of survey respondents did not identify themselves as Hispanic, Latino, Latina, or Latinx compared to 5% who identified did identify themselves as Hispanic, Latino, Latina, or Latinx.
| Hispanic, Latino, Latina, or Latinx | Respondents (n = 255) |
|---|---|
| No | 242 ( 95 %) |
| Yes | 13 ( 5 %) |
Table 4.4 shows that 99% of survey respondents did not identify themselves as American Indian or Alaska Native compared to 1% who identified did identify themselves as American Indian or Alaska Native.
| American Indian or Alaska Native | Respondents (n = 247) |
|---|---|
| American Indian or Alaska Native | 3 ( 1 %) |
| Not American Indian or Alaska Native | 244 ( 99 %) |
Table 4.5 shows that 99% of survey respondents did not identify themselves as Asian compared to 1% who identified did identify themselves as Asian.
| Asian | Respondents (n = 247) |
|---|---|
| Asian | 2 ( 1 %) |
| Not Asian | 245 ( 99 %) |
Table 4.6 shows that 78% of survey respondents did not identify themselves as Black / African American compared to 22% who identified did identify themselves as Black / African American.
| Black / African American | Respondents (n = 247) |
|---|---|
| Black / African American | 54 ( 22 %) |
| Not Black / African American | 193 ( 78 %) |
Table 4.7 shows that 100% of survey respondents did not identify themselves as Native Hawaiian or Pacific Islander compared to 0% who identified did identify themselves as Native Hawaiian or Pacific Islander.
| Native Hawaiian or Pacific Islander | Respondents (n = 247) |
|---|---|
| Not Native Hawaiian or Pacific Islander | 247 ( 100 %) |
Table 4.8 shows that 27% of survey respondents did not identify themselves as White compared to 73% who identified did identify themselves as White.
| White | Respondents (n = 247) |
|---|---|
| Not White | 67 ( 27 %) |
| White | 180 ( 73 %) |
4.1.2.1.3 Age
Table 4.9 shows that the average age survey respondents was 48 years. Ages ranged from 19 to 80 years, with an interquartile range of 42 to 55 and a half years.
| Number of Responses | Average | Lowest | First Quartile | Median | Third Quartile | Highest |
|---|---|---|---|---|---|---|
| 255 | 48 | 19 | 42 | 50 | 55.5 | 80 |
4.1.2.1.4 Educational Attainment
Table 4.10 shows that 6% of survey respondents highest level of education attained is High School / GED, 13% Associate’s degree or technical college, 31% Bachelor’s degree, 40% Master’s degree, 5% Doctoral degree, and 5% Other.
| Highest Level of Education | Respondents (n = 255) |
|---|---|
| Other | 14 ( 5 %) |
| High School Diploma / GED | 15 ( 6 %) |
| Associate’s Degree or Technical College | 34 ( 13 %) |
| Bachelor’s Degree | 78 ( 31 %) |
| Master’s Degree | 101 ( 40 %) |
| Doctoral Degree | 13 ( 5 %) |
4.1.2.1.5 Residential Zip Code
Table 4.11 shows the varying residential zip codes survey respondents identified themselves living in at the time of the survey.
| Residential Zip Code | Respondents (n = 255) |
|---|---|
| 27006 | 4 ( 2 %) |
| 27009 | 1 ( 0 %) |
| 27012 | 16 ( 6 %) |
| 27016 | 1 ( 0 %) |
| 27018 | 1 ( 0 %) |
| 27019 | 2 ( 1 %) |
| 27021 | 3 ( 1 %) |
| 27023 | 8 ( 3 %) |
| 27028 | 1 ( 0 %) |
| 27030 | 1 ( 0 %) |
| 27040 | 14 ( 5 %) |
| 27045 | 3 ( 1 %) |
| 27050 | 2 ( 1 %) |
| 27051 | 6 ( 2 %) |
| 27052 | 3 ( 1 %) |
| 27055 | 2 ( 1 %) |
| 27101 | 12 ( 5 %) |
| 27102 | 1 ( 0 %) |
| 27103 | 21 ( 8 %) |
| 27104 | 21 ( 8 %) |
| 27105 | 17 ( 7 %) |
| 27106 | 34 ( 13 %) |
| 27107 | 15 ( 6 %) |
| 27127 | 23 ( 9 %) |
| 27214 | 1 ( 0 %) |
| 27235 | 1 ( 0 %) |
| 27263 | 1 ( 0 %) |
| 27265 | 3 ( 1 %) |
| 27284 | 19 ( 7 %) |
| 27288 | 1 ( 0 %) |
| 27292 | 2 ( 1 %) |
| 27295 | 1 ( 0 %) |
| 27302 | 1 ( 0 %) |
| 27310 | 1 ( 0 %) |
| 27313 | 1 ( 0 %) |
| 27326 | 1 ( 0 %) |
| 27357 | 1 ( 0 %) |
| 27401 | 1 ( 0 %) |
| 27406 | 1 ( 0 %) |
| 27407 | 1 ( 0 %) |
| 27409 | 1 ( 0 %) |
| 27410 | 2 ( 1 %) |
| 28625 | 1 ( 0 %) |
| 28634 | 1 ( 0 %) |
| 28640 | 1 ( 0 %) |
4.1.2.1.6 Employment Experience
Table 4.12 shows that the average amount of time a survey respondent has worked in the field was 18 years. Scores ranged from 0 to 46 years, with an interquartile range of 8 to 25 years.
| Number of Responses | Average | Lowest | First Quartile | Median | Third Quartile | Highest |
|---|---|---|---|---|---|---|
| 255 | 18 | 0 | 8 | 17 | 25 | 46 |
Table 4.13 shows that the average amount of time a survey respondent has worked at the agency was 10 years. Scores ranged from 0 to 38 years, with an interquartile range of 3 to 16 years.
| Number of Responses | Average | Lowest | First Quartile | Median | Third Quartile | Highest |
|---|---|---|---|---|---|---|
| 255 | 10 | 0 | 3 | 7 | 16 | 38 |
4.1.2.1.7 Characteristics of Respondents’ Agencies and Positions
4.1.2.1.7.1 Agency Characteristics
Table 4.14 shows that 52% of survey respondents work in the Winston-Salem/Forsyth County school system, 18% in the Forsyth County Department of Social Services, 14% in the none of the listed organizations, 7% in the a child care or Pre-K facility, 5% in the Forsyth County Department of Public Health, 4% in the a pediatric office.
| Which organization or kind of organization do you work with? | Respondents (n = 255) |
|---|---|
| A child care or Pre-K facility | 19 ( 7 %) |
| A pediatric office | 11 ( 4 %) |
| Forsyth County Department of Public Health | 13 ( 5 %) |
| Forsyth County Department of Social Services | 45 ( 18 %) |
| Winston-Salem/Forsyth County School System | 132 ( 52 %) |
| None of the above | 35 ( 14 %) |
Table 4.15 shows that 47% of survey respondents agencies do not provide home visitations as a part of their services, 41% do provide home visitations, and 11% were not sure.
| Does your program within your agency provide home visitation as a part of your services? | Respondents (n = 253) |
|---|---|
| No | 119 ( 47 %) |
| Yes | 105 ( 42 %) |
| Not sure | 29 ( 11 %) |
Table 4.16 shows the varying agency zip codes survey respondents identified themselves a part of at the time of the survey.
| Agency Zip Code | Respondents (n = 250) |
|---|---|
| 27012 | 7 ( 3 %) |
| 27023 | 2 ( 1 %) |
| 27040 | 7 ( 3 %) |
| 27045 | 1 ( 0 %) |
| 27051 | 7 ( 3 %) |
| 27101 | 75 ( 30 %) |
| 27102 | 12 ( 5 %) |
| 27103 | 19 ( 8 %) |
| 27104 | 7 ( 3 %) |
| 27105 | 46 ( 18 %) |
| 27106 | 29 ( 12 %) |
| 27107 | 6 ( 2 %) |
| 27110 | 1 ( 0 %) |
| 27127 | 7 ( 3 %) |
| 27157 | 1 ( 0 %) |
| 27284 | 23 ( 9 %) |
4.1.2.1.7.2 Position Characteristics
Table 4.17 shows that 68% of survey respondents stated at least 50% of their work is with clients, i.e., direct care, 9% stated less than 50% of their work is with clients, i.e., indirect care, and 23% stated neither direct nor indirect care.
| Direct or Indirect Care | Respondents (n = 248) |
|---|---|
| Direct Care (at least 50% of your work is with clients) | 168 ( 68 %) |
| Indirect care (less than 50% of your work is with clients) | 22 ( 9 %) |
| Neither Direct nor Indirect Care | 58 ( 23 %) |
Table 4.18 shows that 10% of survey respondents identified themselves as an executive office / administrator, 14% a supervisor or middle manager, and 75% neither a supervisor or administrator.
| Supervisor, Administrator, or Neither | Respondents (n = 249) |
|---|---|
| Executive officer / administration | 26 ( 10 %) |
| Supervisor or middle manager | 36 ( 14 %) |
| Neither Supervisor or Administration | 187 ( 75 %) |
Table 4.19 shows that 93% of survey respondents identified themselves as full-time and 7% identified themselves as part-time.
| Hours Worked | Respondents (n = 251) |
|---|---|
| Full-time | 234 ( 93 %) |
| Part-time | 17 ( 7 %) |
Table 4.20 shows that 42% of survey respondents identified their annual income between $40,001-$60,000, 24% between $22,000-$40,000, 17% between $66,001-$107,000, 12% less than $22,000, and 5% more than $107,000.
| Annual Income for Position | Respondents (n = 254) |
|---|---|
| Less than $22,000 | 31 ( 12 %) |
| Between $22,000 and $40,000 | 62 ( 24 %) |
| Between $40,001 and $66,000 | 106 ( 42 %) |
| Between $66,001 and $107,000 | 42 ( 17 %) |
| More than $107,000 | 13 ( 5 %) |
4.1.2.2 Survey Analysis
To answer questions about the local network of child-serving agencies, analysts performed a series of statistical tests and analyses for each measure. They first looked at how respondents answered the questions overall, either by showing the distribution of scores on scales or by showing the percentage of respondents who gave specific answers to specific questions. Analysts then checked for differences in responses based on the type of program, the respondent’s role in the organization, whether or not the respondent provided direct care to clients, the years of experience respondents had in the field, the years respondents had worked at their particular agency, their experience with the TRC Model, their racial and ethnic identity, the extent to which they had been impacted by COVID-19, their gender, sexual orientation, level of education, income, and whether or not they were employed full time. For cases in which differences across respondents in these groups were large enough (analysts were at least 95% sure that differences were due to actual differences in responses and not random chance), scores were compared and reported. These differences are called statistically significant differences in this report. More details on tests that were run and exact test results can be found in Appendix A: Output Tables.
Analysts also checked for statistically significant differences across agencies. For cases in which analysts identified such differences, they were noted in the text, but specific scores and comparisons were omitted to protect the privacy of agencies and respondents.
Lastly, survey respondents were invited to answer an open-ended question about the ways in which they had been impacted by COVID-19. These answers were analyzed by the research team conducting the micro-level assessment at Wake Forest Baptist Health so that the categories used would be the same across the two reports.
4.1.2.3 Interview Methodology
Interviews were conducted as part of a larger assessment of the current human service provider landscape in Forsyth County, North Carolina, in relation to trauma resilience among the community. Specifically, interviews were administered to evaluate the extent to which employees in various community organizations experienced structural violence and their experiences around racial equity-based practices within their organizations.
Structural violence can be defined as a form violence experienced by people from social institutions that prevents one from meeting their basic needs (Farmer 1996). An open-ended question measured if any structural violence was experienced by staff, but most of the interview questions focused on organizational racial equity-based work. Those questions were adapted from a survey instrument, “Racial Justice Assessment Tool,” developed by the (Western States Center 2015) that helps organizations determine the extent to which they are oriented toward racial equity across different organizational areas, such as workplace culture and policies.
The data were derived from interviews with 23 employees across five human service providers, including:
- in-home visit providers,
- child care providers,
- teachers in the Winston-Salem/Forsyth County Schools system,
- employees from health and human services organizations, and
- staff from local hospital systems.
The following two sections present the demographic information of the interview participants and key findings from the interviews.
| Demographic | Respondent / Average |
|---|---|
| Gender | |
| Man | 4 |
| Woman | 17 |
| Other Gender Identity | 1 |
| Race/Ethncitiy | |
| Non-Hispanic Black/African American | 10 |
| Hispanic/Latino(a) | 3 |
| Non-Hispanic White | 9 |
| Educational Attainment | |
| Bachelor’s Degree | 6 |
| Master’s Degree | 14 |
| Doctoral Degree | 2 |
| Sexual Orientation | |
| Heterosexual | 21 |
| Other Sexual Orientation | 1 |
| Age (Years) | 47 |
| Income | |
| Less than $40,000 | 2 |
| $40,0001 - $66,000 | 6 |
| $66,001 - $107,000 | 8 |
| More than $107,001 | 4 |
| Years Employed in Field | 18 |
| Years Employed at Organization | 7 |
| Organization Sector | |
| Child Care | 4 |
| DSS | 4 |
| Home Visitation | 5 |
| Medical | 5 |
| Public Schools | 4 |
| Position | |
| Direct Care | 1 |
| Executive Officer or Administration | 10 |
| Supervisor or Middle Manager | 9 |
| Other Position Combination | 2 |
| Work Status | |
| Full-Time | 22 |
| Part-Time | 0 |
| Experience with TRC Model | |
| Familiar and involved in trainings | 4 |
| Familiar but no direct activities | 12 |
| Not familiar | 6 |
4.1.2.4 Demographics of Interview Participants
All but one interview participant completed a demographic sheet and all but two of the submitted demographic sheets were complete. Of the two incomplete sheets, one participant did not answer how COVID-19 affected them or their organization while the second participant did not answer the income question.
The majority of our qualitative sample (sample size: 23) identified as women and heterosexual. The racial and ethnic distribution is less skewed with almost the same number of non-Hispanic, White and Black/African American respondents participating in the interviews along with three Hispanic/Latino(a) participants. Our sample is highly educated. This reflects many of the educational requirements for their job, which is usually at least a bachelor’s degree. Age of participants ranged from 34 to 64 with an average age of 47. Half of the participants that answered the income question make $66,000 or more and no one from our sample worked less than full-time. Most respondents were experienced in their given field with an average of 18 years working in their respective field and an average of 7 years at their specific organization. But, it is important to note that some respondents had less than a year of experience in their field or organization. Efforts were made to ensure that at least four participants represented each organizational sector listed in the table above, and while organizational position varies, the sample skews heavily to participants who are not in direct care. Lastly, 27% of participants were not familiar with the Trauma Resilient Community model at the time of the interview.
4.1.2.5 Funding Web Diagram
In response to a request from the expanded advisory committee, Forsyth Futures analysts created diagrams to communicate how data, money, and influence were distributed among stakeholders involved in the mezzo-level analysis.
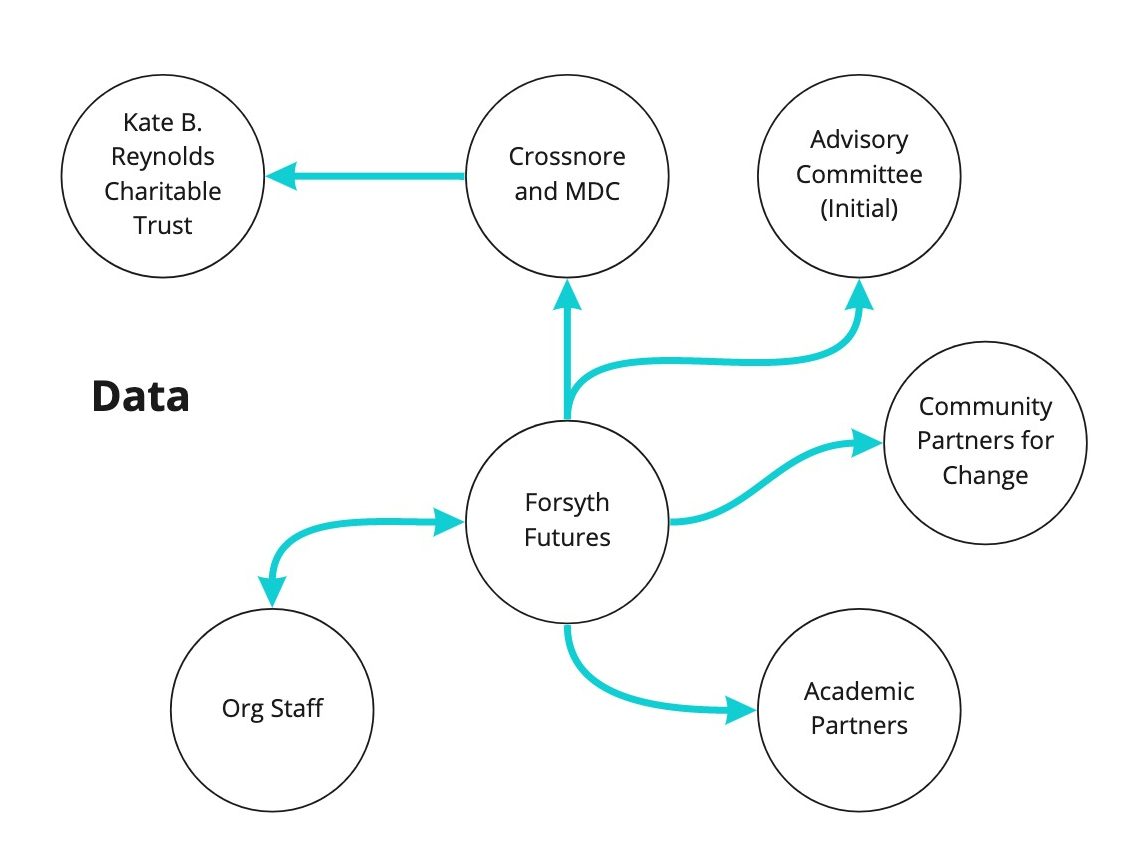
Diagram showing the distribution of data among stakeholders for the mezzo-level assessment
The diagram showing the distribution of data among stakeholders for the mezzo-level assessment shows how data was shared and distributed across stakeholders in the mezzo-level assessment. Forsyth Futures staff collected data from organizational staff, analyzed that data, and then shared it with organizational staff members, academic partners, the Stakeholder Advisory Committee, Community Partners for Change, Crossnore, and MDC. Crossnore and MDC shared that data with the Kate B. Reynolds Charitable Trust.
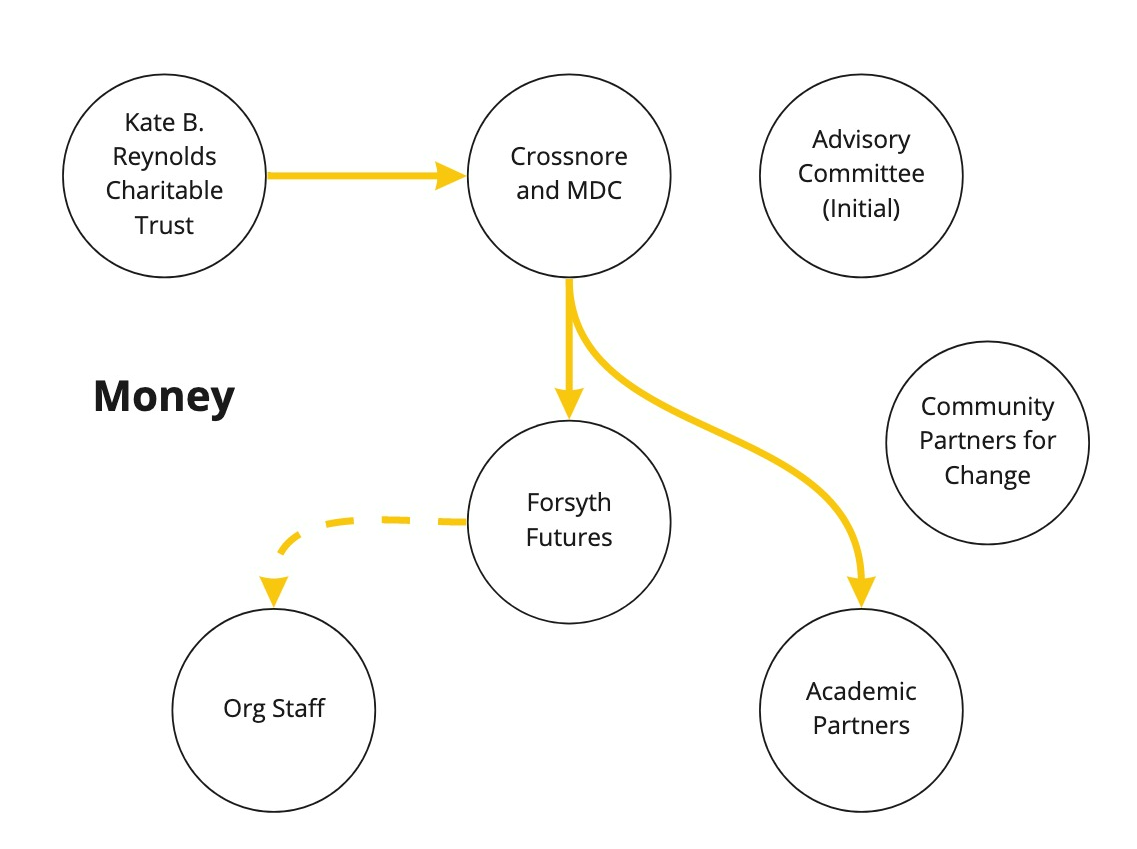
Diagram showing the distribution of funding among stakeholders for the mezzo-level assessment
The diagram showing the distribution of funding among stakeholders for the mezzo-level assessment shows the distribution of funding among stakeholders for the mezzo-level assessment. Funding was distributed from the Kate B. Reynolds Charitable Trust to Crossnore. Crossnore distributed that funding to Forsyth Futures and academic partners from the Center for Trauma Resilient Communities. Forsyth Futures distributed funding to some organization staff by compensating interview participants for their time and entering child care providers into a drawing to win gift cards. Interview participants were compensated for their time because of the increased time commitment associated with participating in a 45 minute to an hour long interview, and child care providers were provided with an opportunity for incentives because past work with child care providers has indicated that completing surveys is disproportionately burdensome for respondents working in those settings.
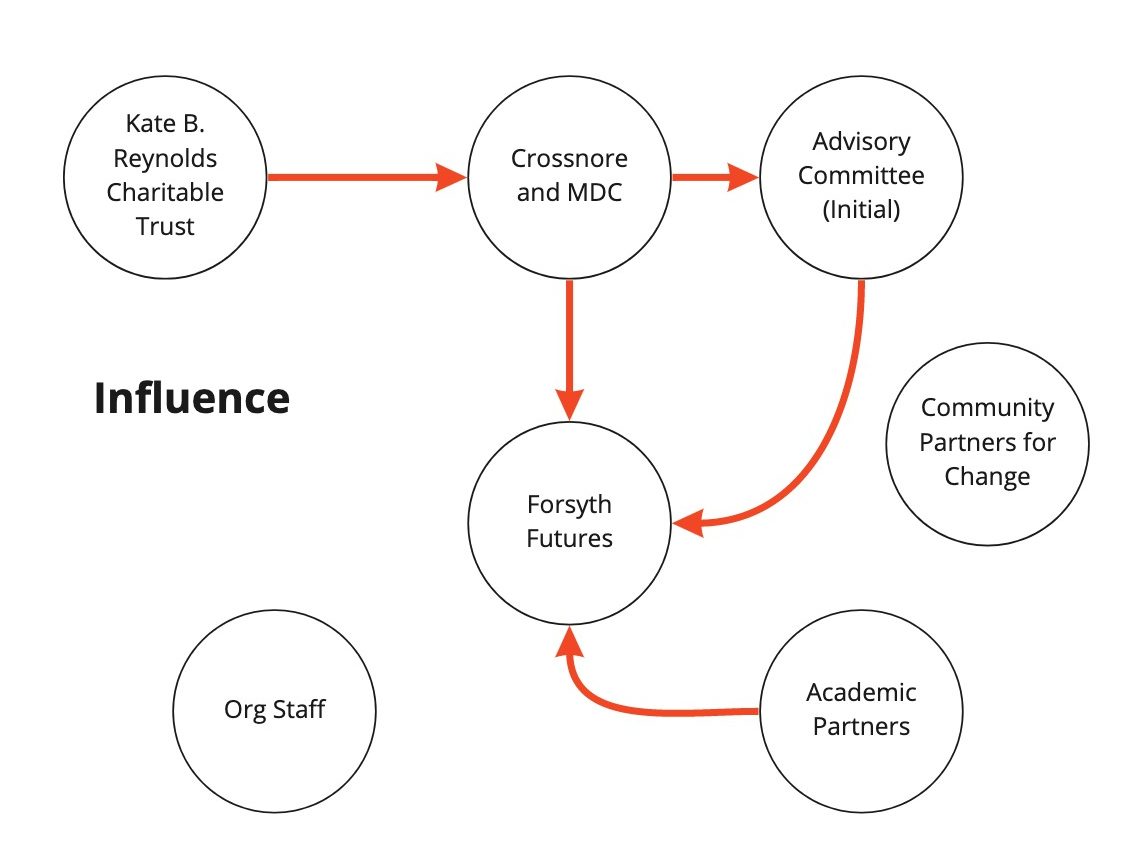
Diagram showing the distribution of influence among stakeholders for the mezzo-level assessment
The diagram showing the distribution of influence among stakeholders for the mezzo-level assessment shows the distribution of influence among stakeholders for the mezzo-level assessment. Influence was defined as the ability to meaningfully impact decisions that were being made about the project. In their role as a funder, the Kate B. Reynolds Charitable Trust had the ability to exert influence over Crossnore and MDC. As the key convener, Crossnore had the ability to exert influence over the initial Stakeholder Advisory Committee convened to advise on the project. As the grantee supervising Forsyth Futures as a subcontractor, Crossnore and MDC had the ability to exert influence over Forsyth Futures. The initial Stakeholder Advisory Committee and academic partners at the Center for Trauma Resilient Communities provided feedback and advice that influenced the methodological decisions made by Forsyth Futures. Staff at surveyed organizations and members of the Community Partners for Change, which convened after the research was completed, did not have the ability to exert influence in this project.
4.1.2.6 More Information on Methodology
Technical documentation for specific statistical tests and scale performance can be found in the appendices of this report. Please reach out to info@forsythfutures.org with additional questions about the methods used in this report or to request a technical methodology.
4.2 Staff Experiences of ACEs and Discrimination
4.2.1 Introduction
This section covers staff experiences of Adverse Childhood Experiences (ACEs) reported in the survey. The staff experiences of ACEs component of the survey contains 10 items that ask about whether or not the respondent experienced various ACEs, which are potentially traumatic experiences that some people experience in childhood (0-17 years old). The greater the number of ACEs that a person has experienced can have a long-term negative impact on health, well-being, and life opportunities. Below are a few example questions from this measure:
- Did you feel that you didn’t have enough to eat, had to wear dirty clothes, or had no one to protect or take care of you?
- Did you live with anyone who had a problem with drinking or using drugs, including prescription drugs?
This section of the survey also asked staff members if they had ever experienced discrimination.
4.2.2 Key Findings
- Most respondents in child-serving agencies have experienced at least one ACE, with almost half experiencing 1-3 ACEs.
- The most common ACEs experienced were emotional abuse, loss of a parent, household mental illness, substance abuse, and physical abuse.
- Staff experiences of ACEs closely mirror those reported by adults in Forsyth County.
- About 44% of respondents reported experiences of discrimination with Black / African American respondents, respondents not identifying as White, and middle-income respondents being the most likely to report these experiences.
4.2.3 Staff Experiences of ACEs
To measure ACEs, respondents were asked a series of yes/no questions about their childhood experiences. This section looks at the number and types of experiences respondents reported.
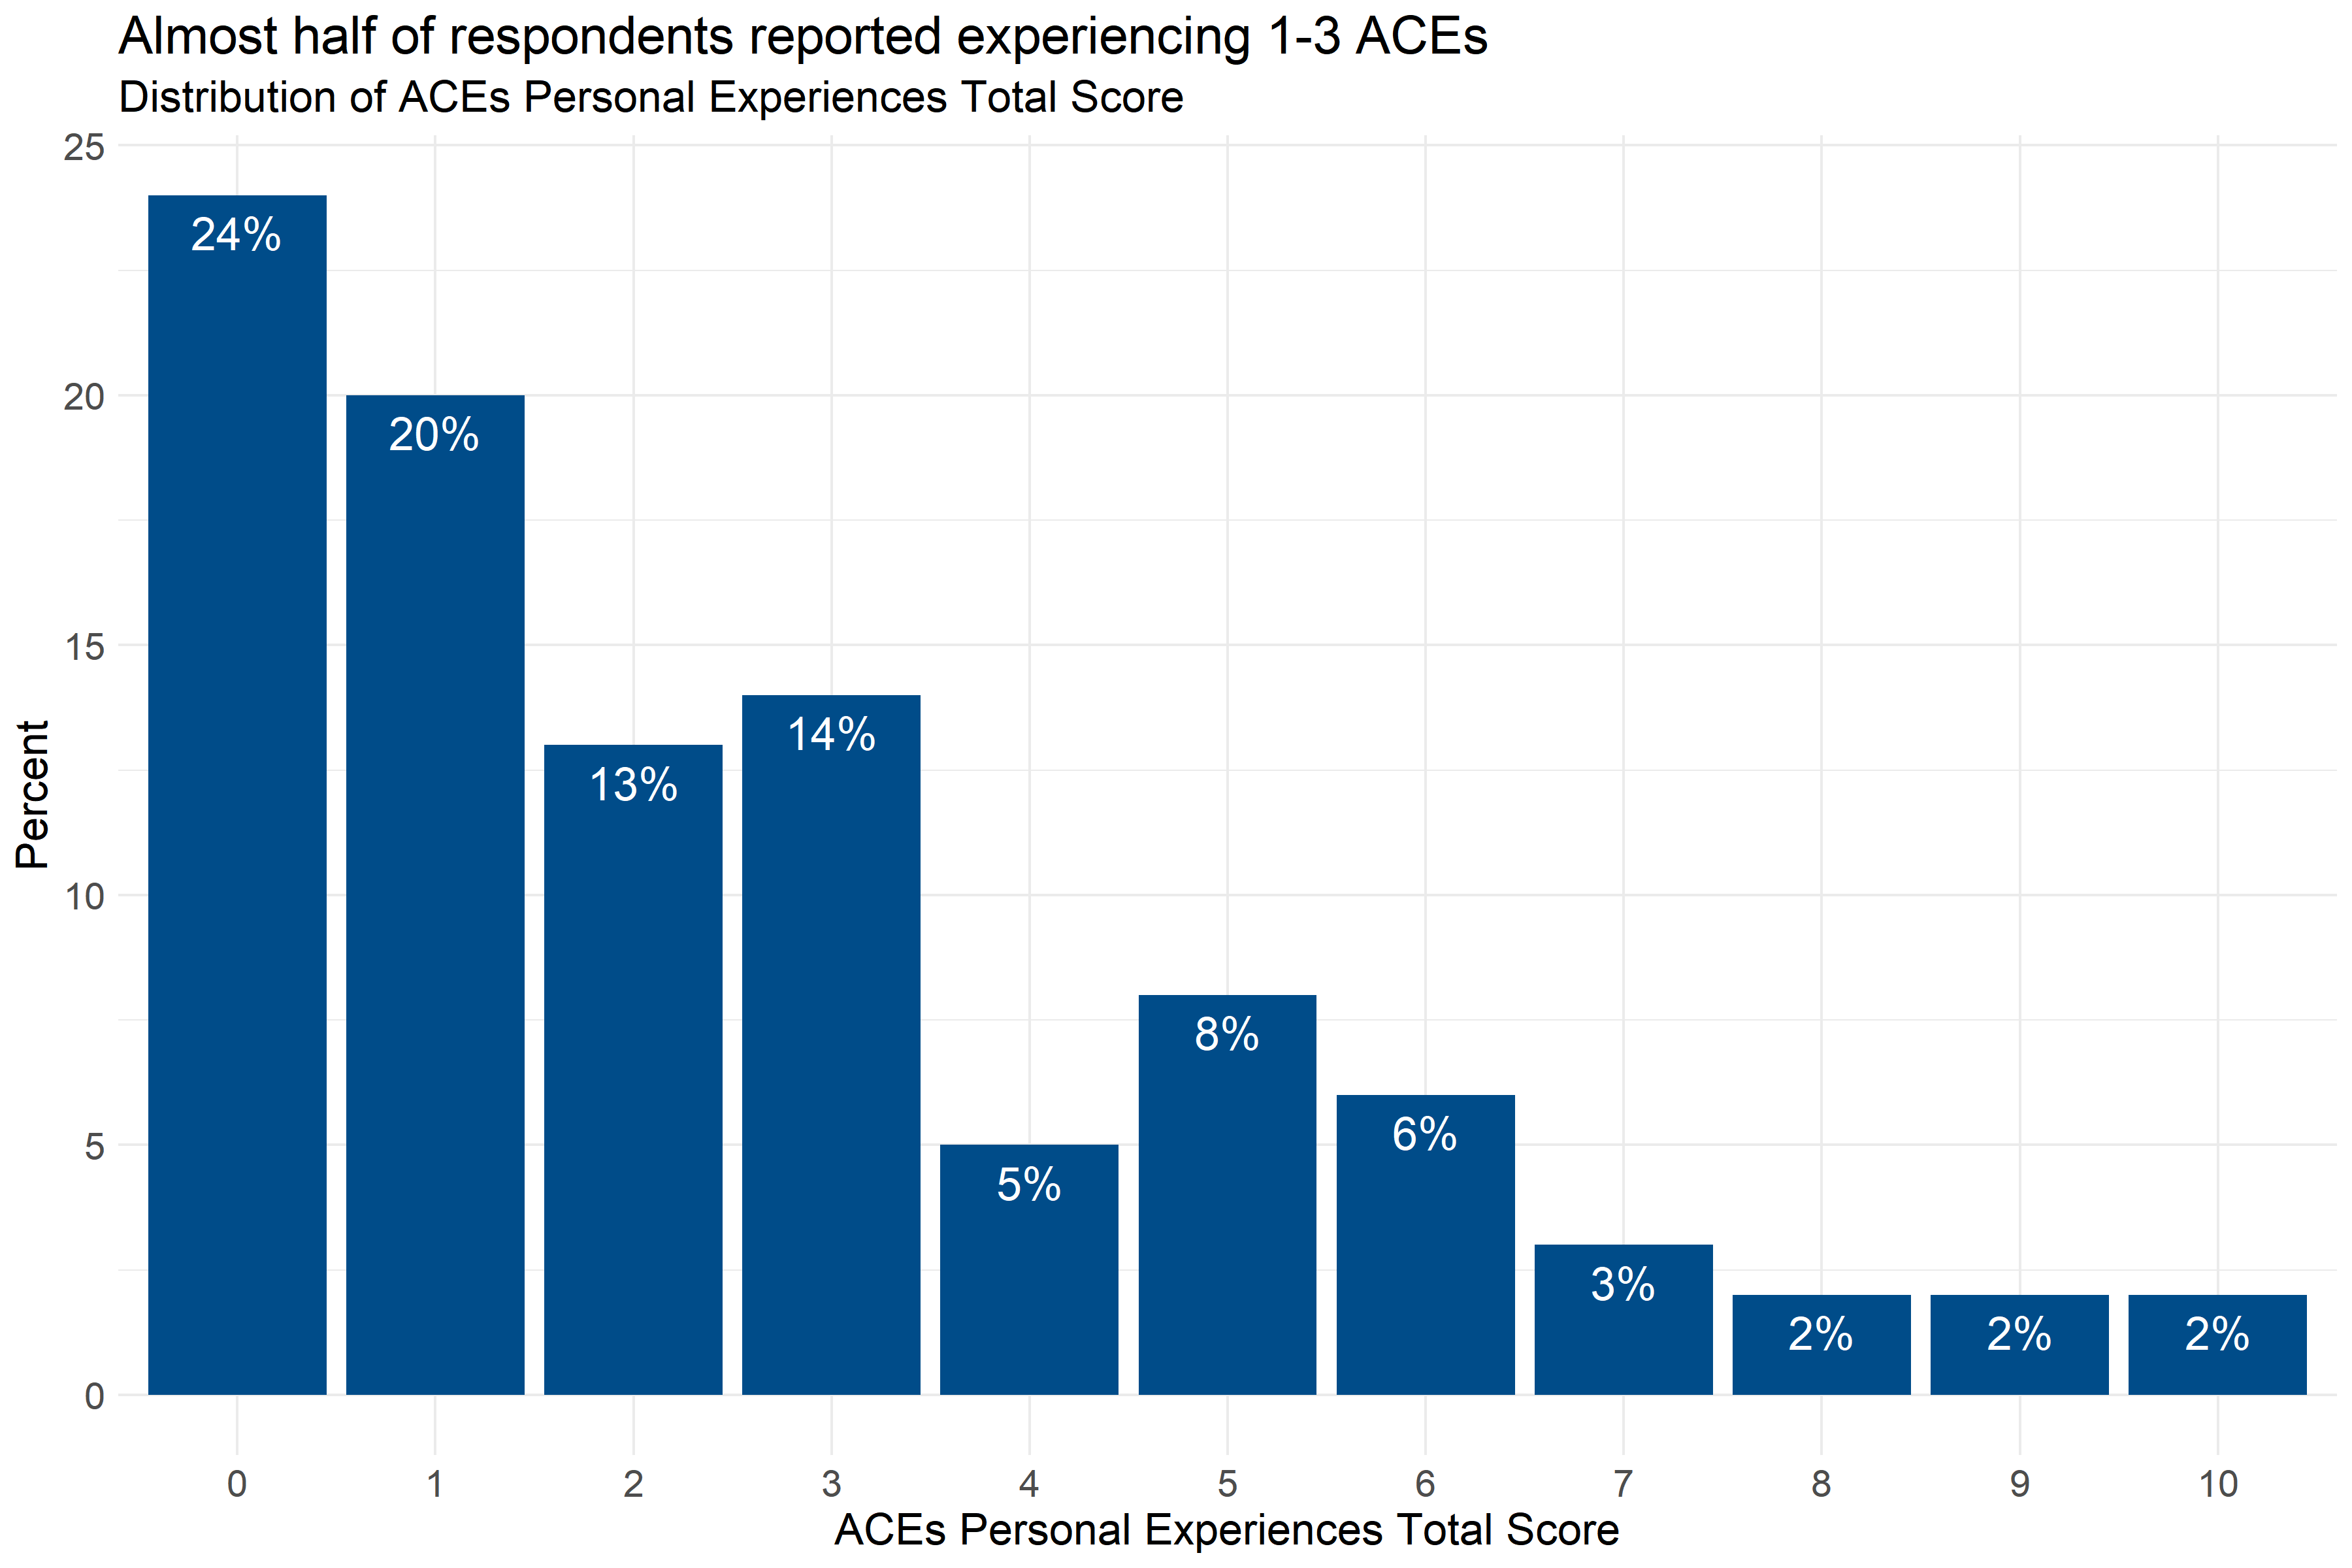
Figure 4.1: Distribution of the number of ACEs reported by respondents
Figure 4.1 shows that 76% of respondents reported experiencing at least one ACE, and 47% of respondents reported experiencing 1-3 ACEs. Analysts also tested the data to see if there were significant differences in the number of ACEs experienced by staff from different demographic groups and agencies, but did not find any statistically significant differences.
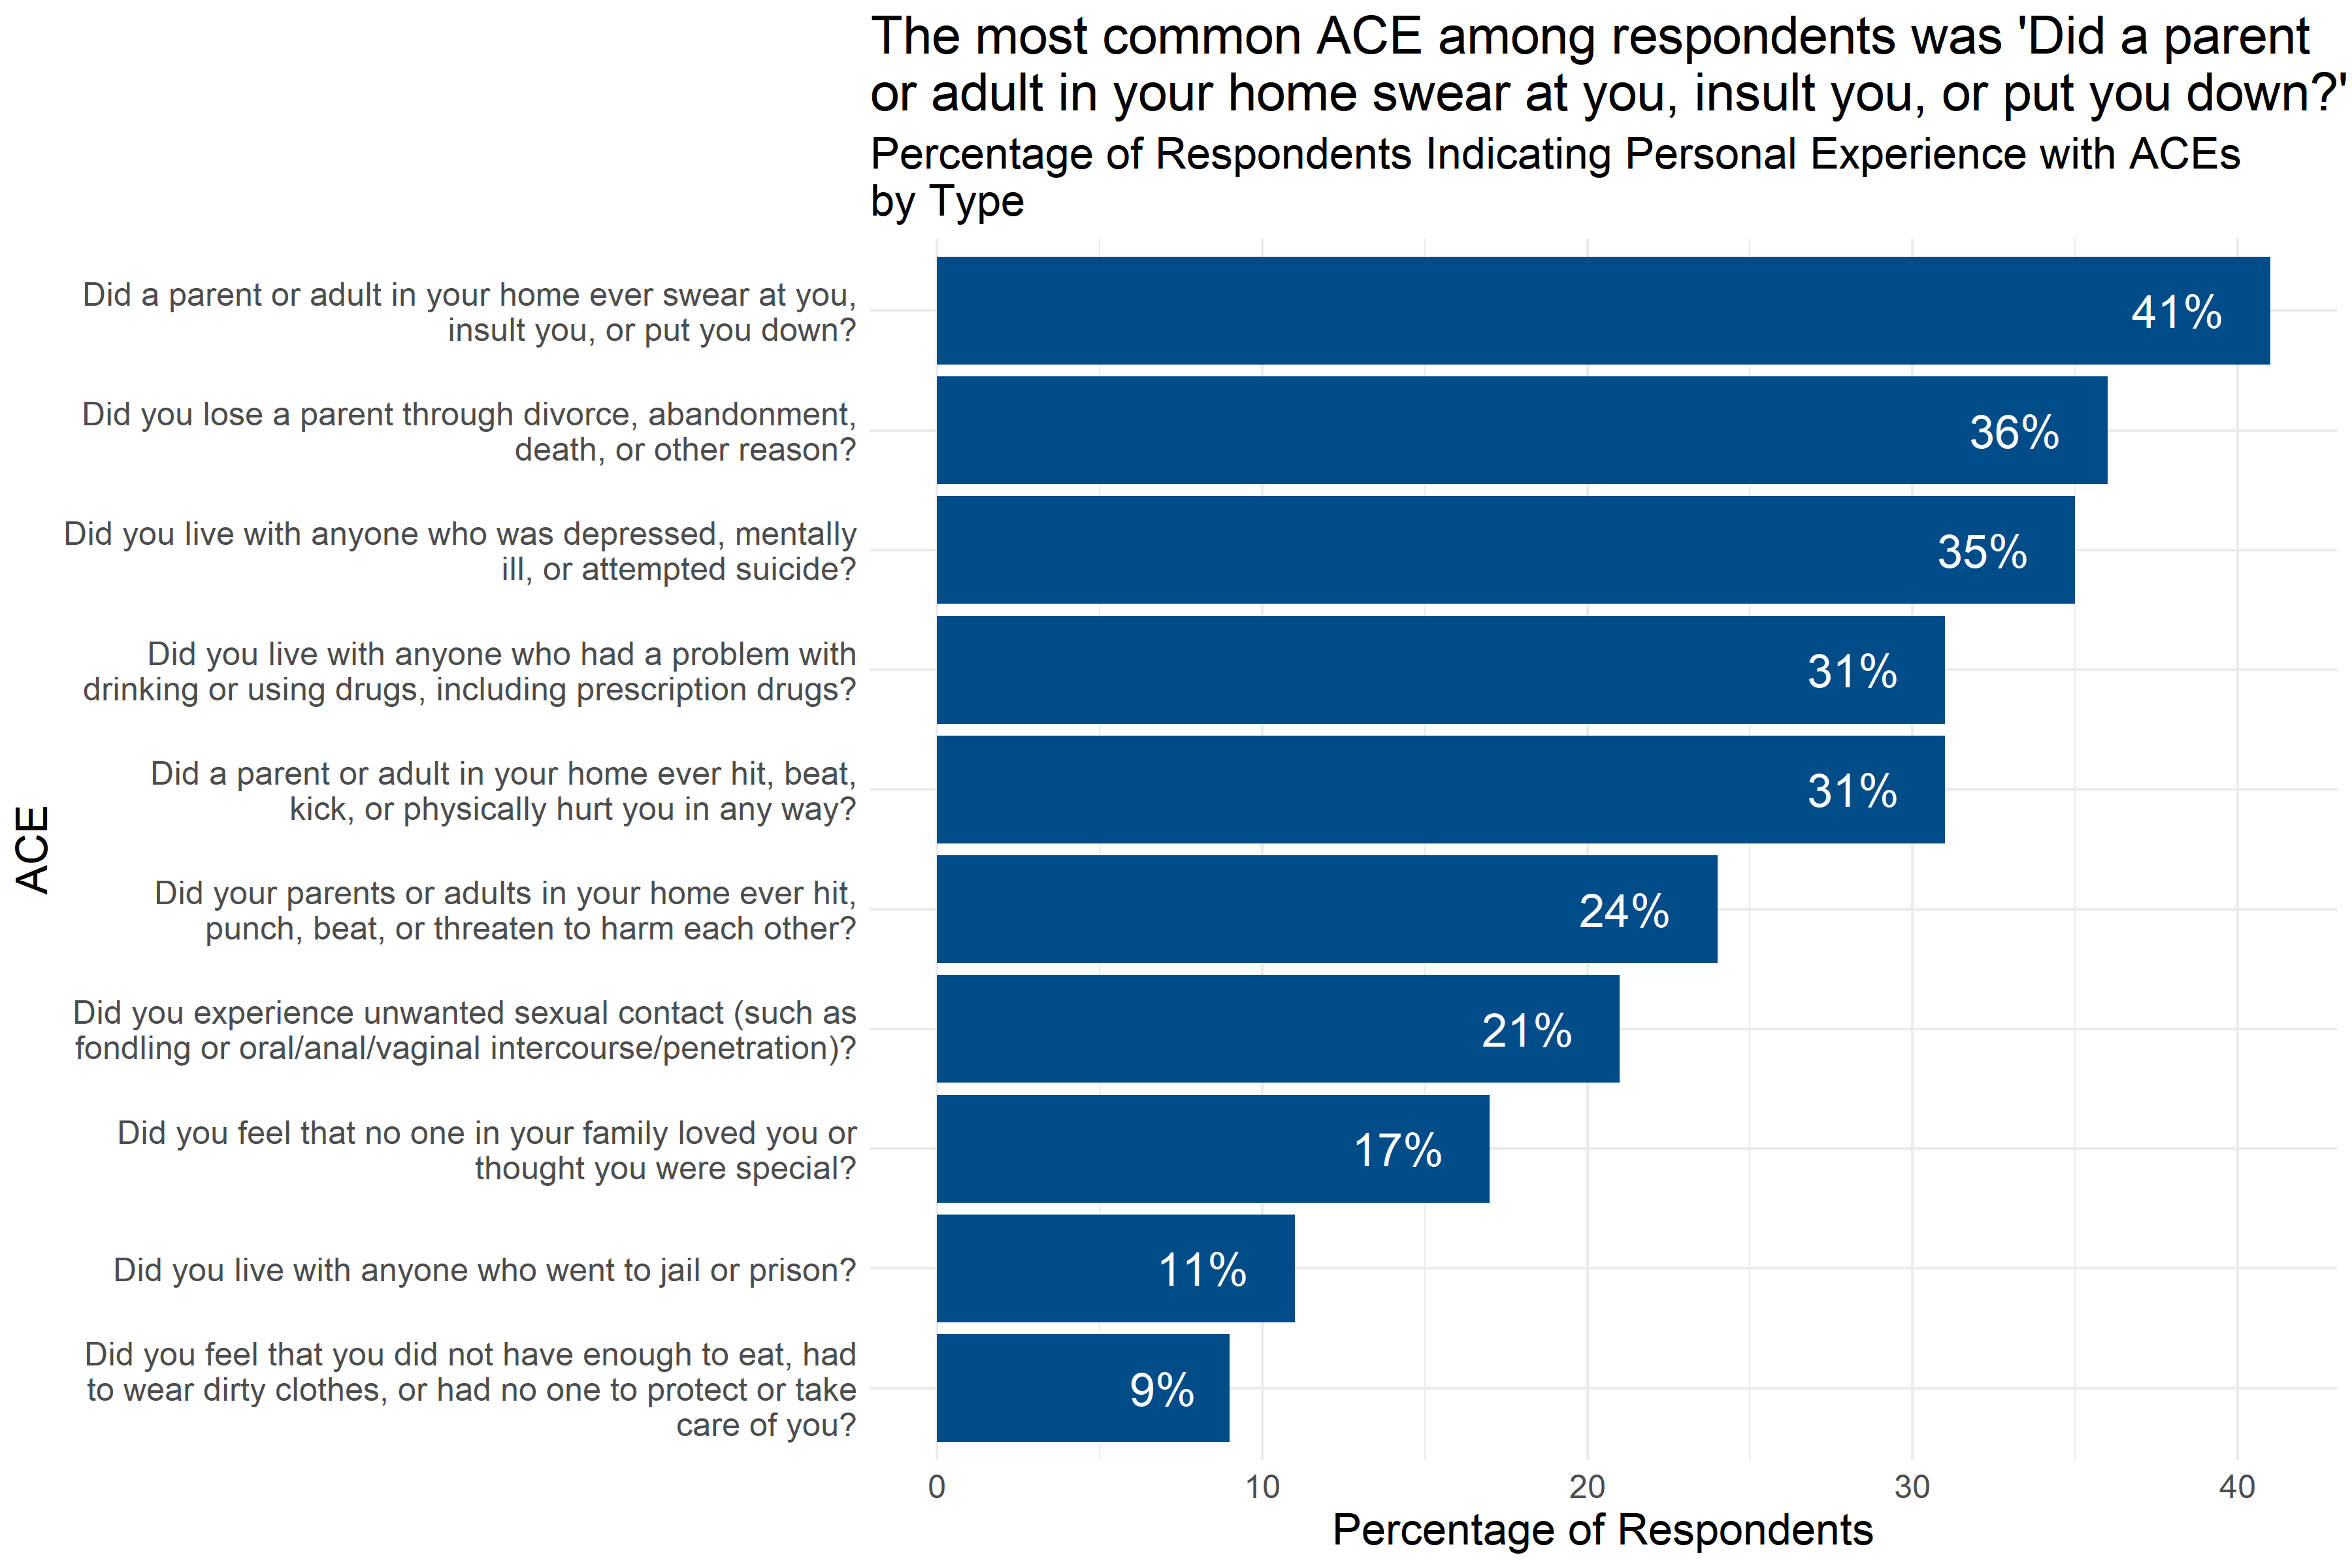
Figure 4.2: Percentage of respondents indicating personal experiences with ACEs by type of ACE
Figure 4.2 shows the percentage of survey respondents who indicated that they had experienced each kind of adverse experience. The most common adverse experience was having “a parent or adult in your home swear at you, insult you, or put you down” with 41% of respondents reporting this experience. Other common adverse experiences included the loss of a parent (including through divorce), household mental illness, substance abuse, and physical abuse, all reported by more than 25% of respondents.
4.2.4 Staff Experiences of Discrimination
Researchers also asked an additional question about experiences of discrimination: “Have you experienced discrimination? (for example, being hassled or made to feel inferior or excluded because of your race, ethnicity, gender identity, sexual orientation, religion, learning differences, or disabilities)”
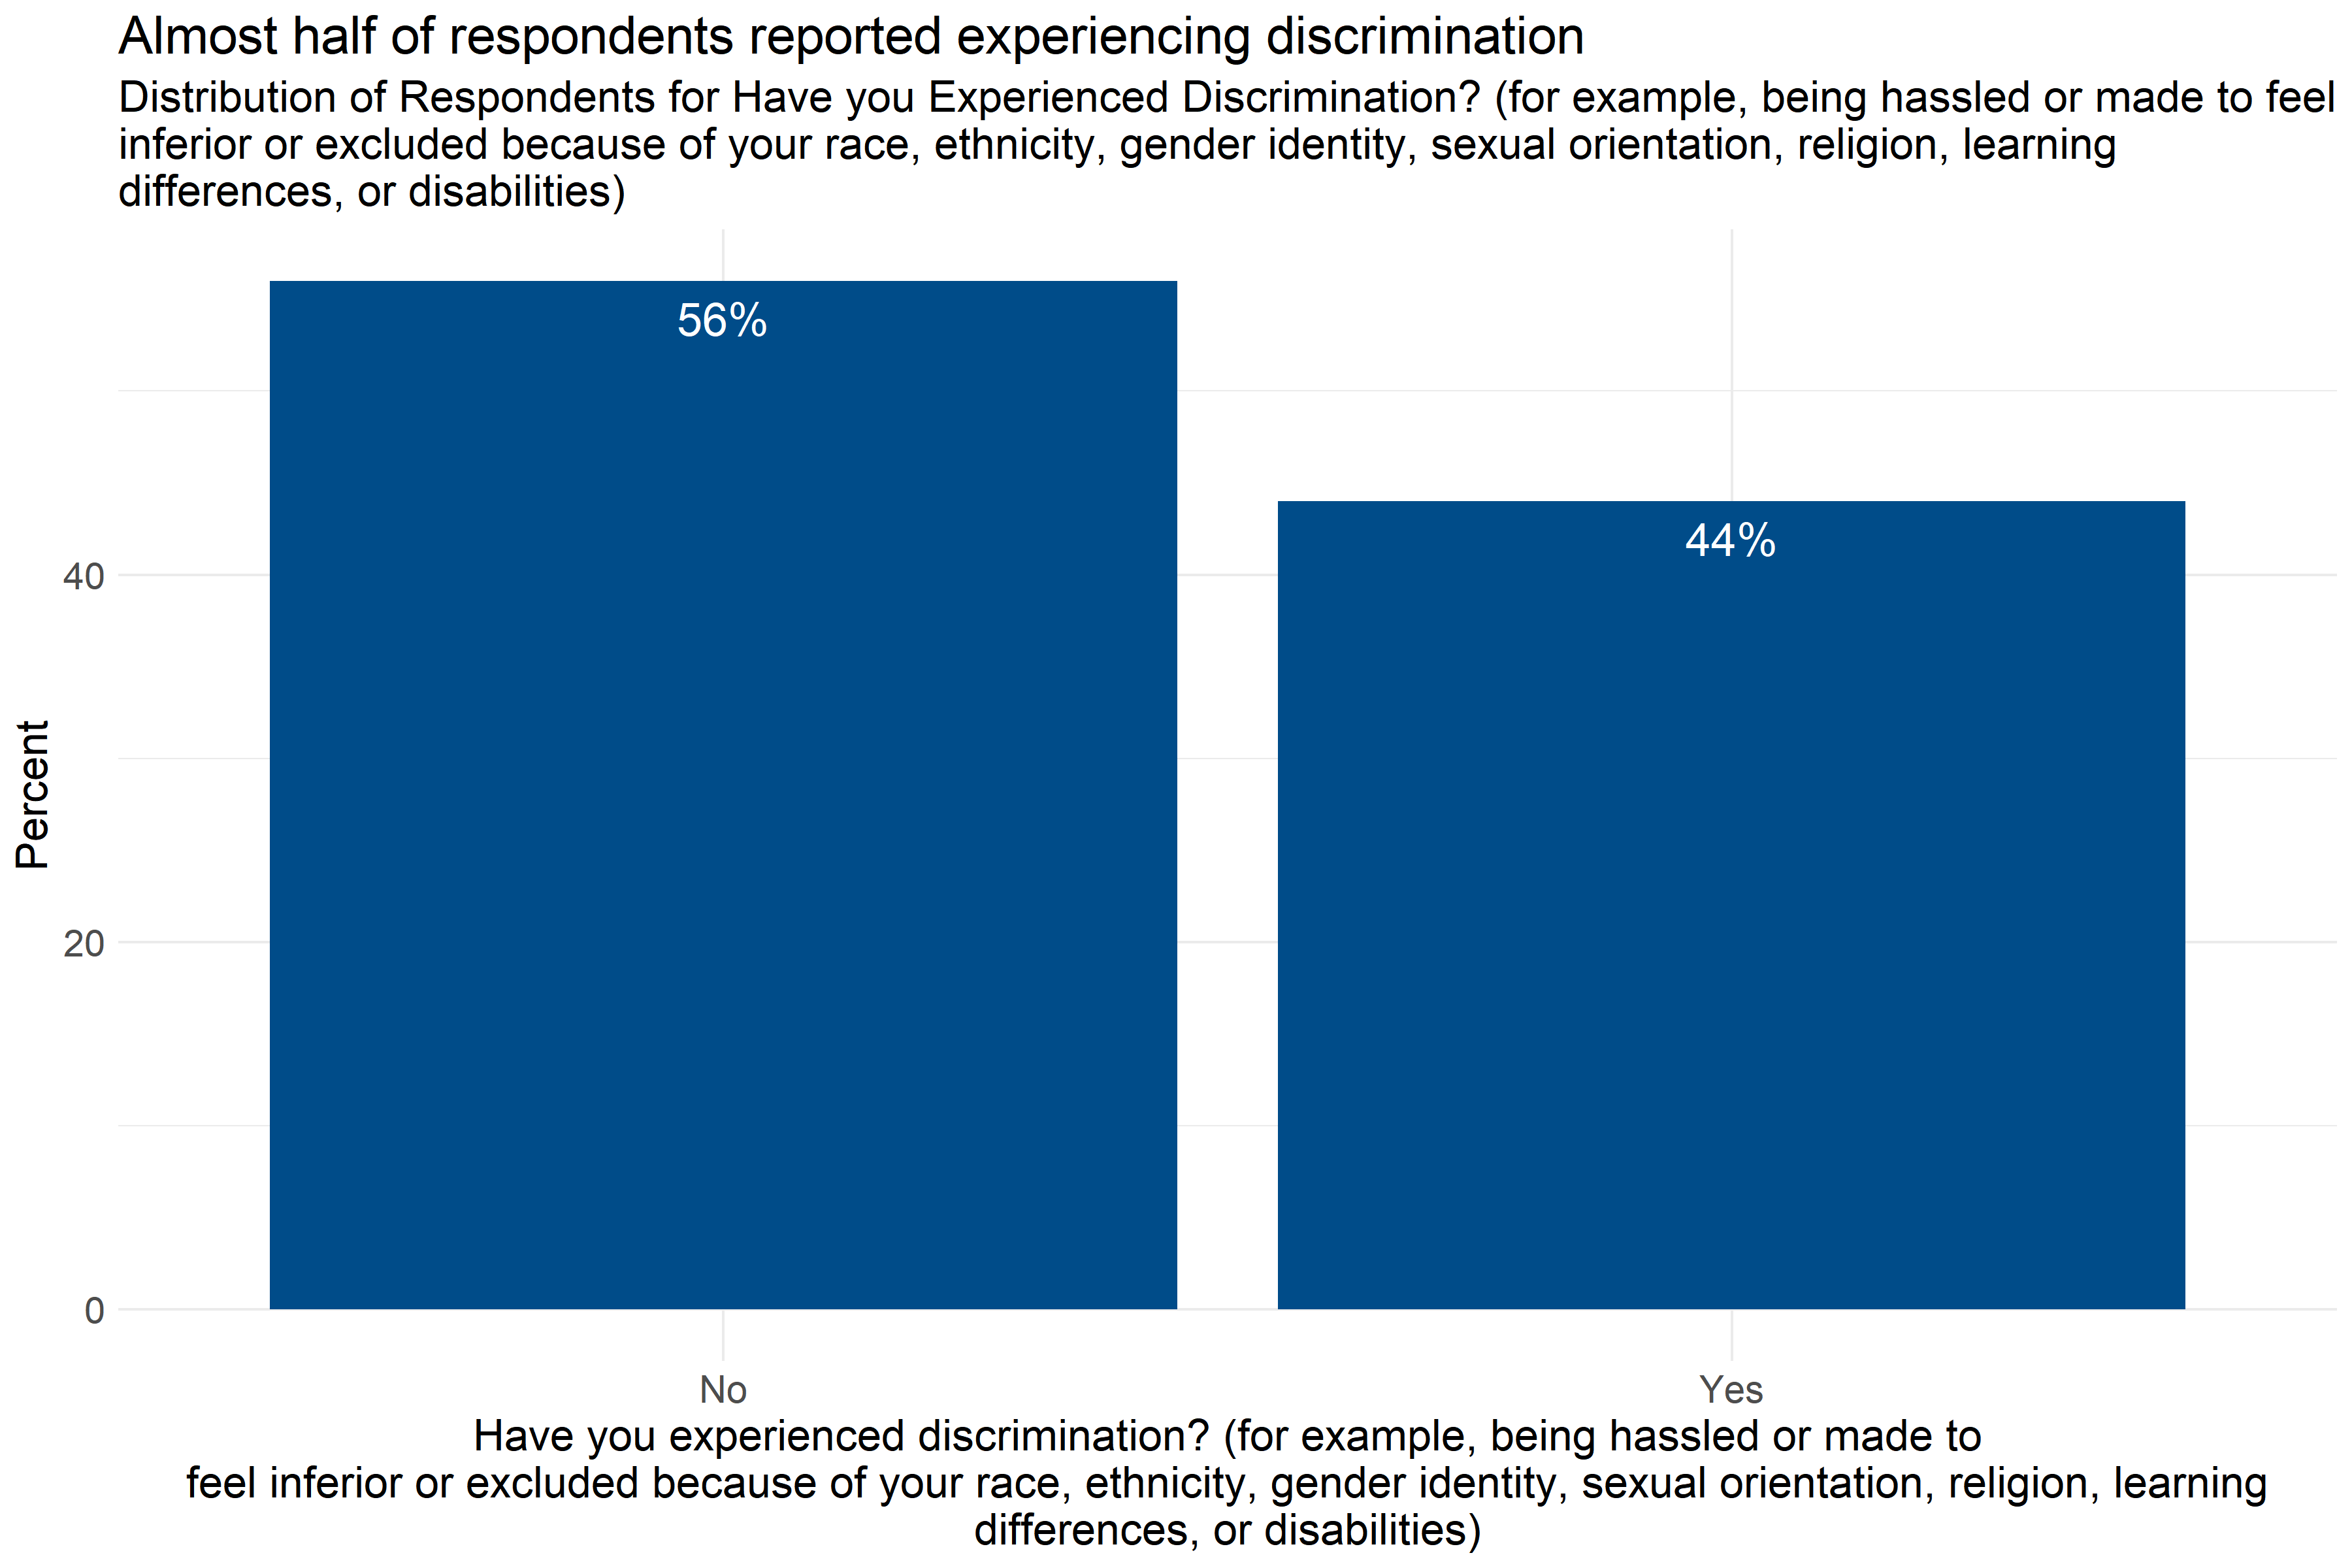
Figure 4.3: Percentage of respondents reporting experiences of discrimination
Figure 4.3 shows that almost half (44%) of respondents reported experiencing discrimination on the basis of their race, ethnicity, gender identity, sexual orientation, religion, learning differences, or disabilities.
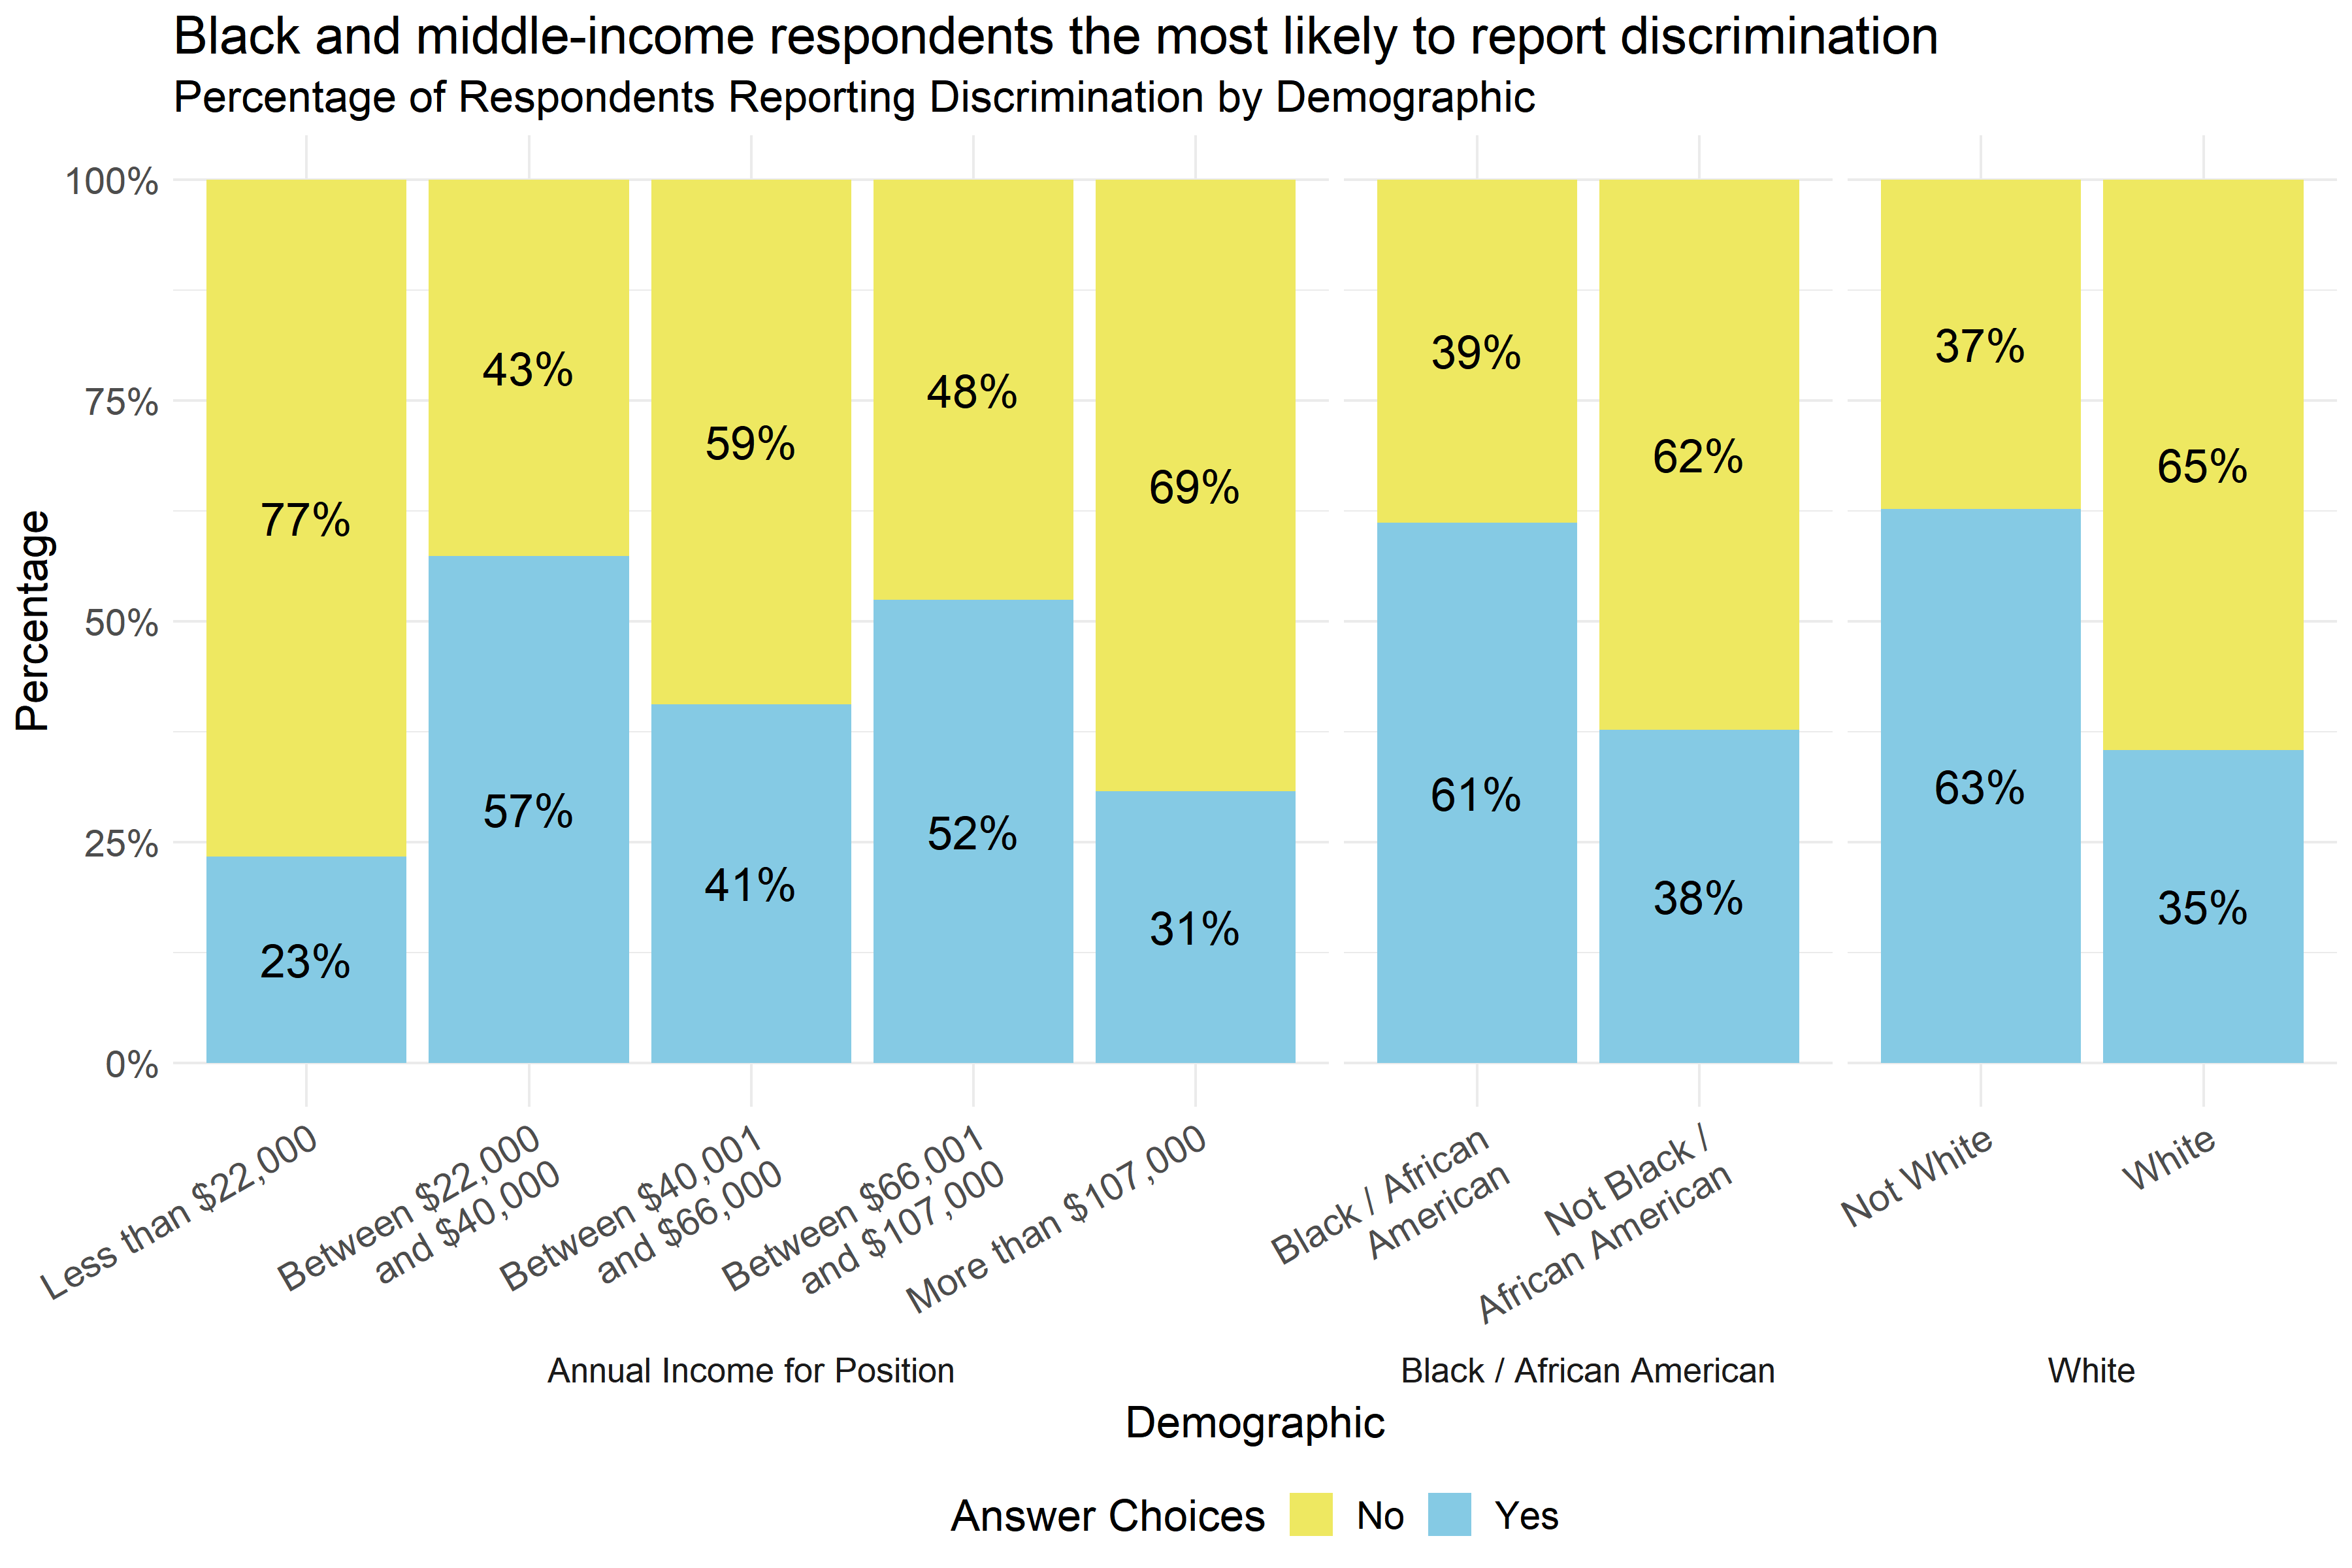
Figure 4.4: Percentage of respondents reporting discrimination by demographic
Figure 4.4 shows that there were significant differences in the percentage of respondents reporting discrimination by income and race. About 61% of respondents identifying as Black / African American reported experiences of discrimination, compared to 38% of respondents not identifying as Black / African American. Similarly, 35% of White respondents reported experiences of discrimination compared to 63% of respondents who did not identify as White. Respondents reporting mid-range annual incomes were also more likely to report experiences of discrimination, with the highest rate of reporting among those making $22,000-$40,000 a year.
The differences in reported experiences of discrimination and annual income are driven by respondents making less than $22,000 a year being much less likely to report discrimination and those making between $22,000 and $40,000 being more likely to report discrimination.
4.2.5 Conclusions
Most respondents in child-serving agencies have experienced at least one Adverse Childhood Experience (ACE), with almost half experiencing 1-3 ACEs. The most common ACEs experienced were emotional abuse, loss of a parent, household mental illness, substance abuse, and physical abuse, which closely mirrored the adverse experiences of adults in Forsyth County in general.
Additionally, 44% of respondents reported experiences of discrimination, with Black / African American respondents, respondents not identifying as White, and middle-income respondents being the most likely to report experiences of discrimination.
It is important to note that survey questions asked whether or not a staff member had ever had one of these experiences. The long-term impact of individual events that were not frequent occurrences may have different impacts on staff members than events that happened frequently, especially when responding to questions about verbal or emotional abuse. This survey did not ask how frequently these experiences happened, it only asked whether or not they happened.
This suggests that ACEs and experiences of discrimination, both potentially traumatizing experiences, are relatively common among staff in child-serving agencies. Some of the specific ACEs experienced by staff are likely to be similar to the experiences of adults in their clients’ households, which could result in staff experiencing triggers when interacting with some clients. A plan to implement a trauma-informed model in Forsyth County should take into account the experiences and potential needs of staff as well as residents in the community.
4.3 Staff Impact from COVID-19
This section includes results of staff responses on the degree to which COVID-19 has impacted them, as well as the type of impact it has had on them. To assess the degree of impact, the following survey question was asked “To what extent have you been impacted by the COVID 19 pandemic?” with response options on a five-point scale from “Not at all impacted” to "Very much impacted". The type of impact was determined by an open response question on surveys completed that was analyzed by the Wake Forest Baptist Health team.
4.3.1 Key Findings
- 78% of respondents reported being at least somewhat impacted by COVID-19, and 20% reported being “very much impacted.”
- Respondents with doctoral degrees and part-time respondents reported more impact than others from COVID-19.
- The most common ways that COVID-19 has impacted respondents were job changes and stressors, isolation/separation from others, job losses or disruption, kids’ school changes, and family stressors.
4.3.2 Extent of COVID-19 Impact
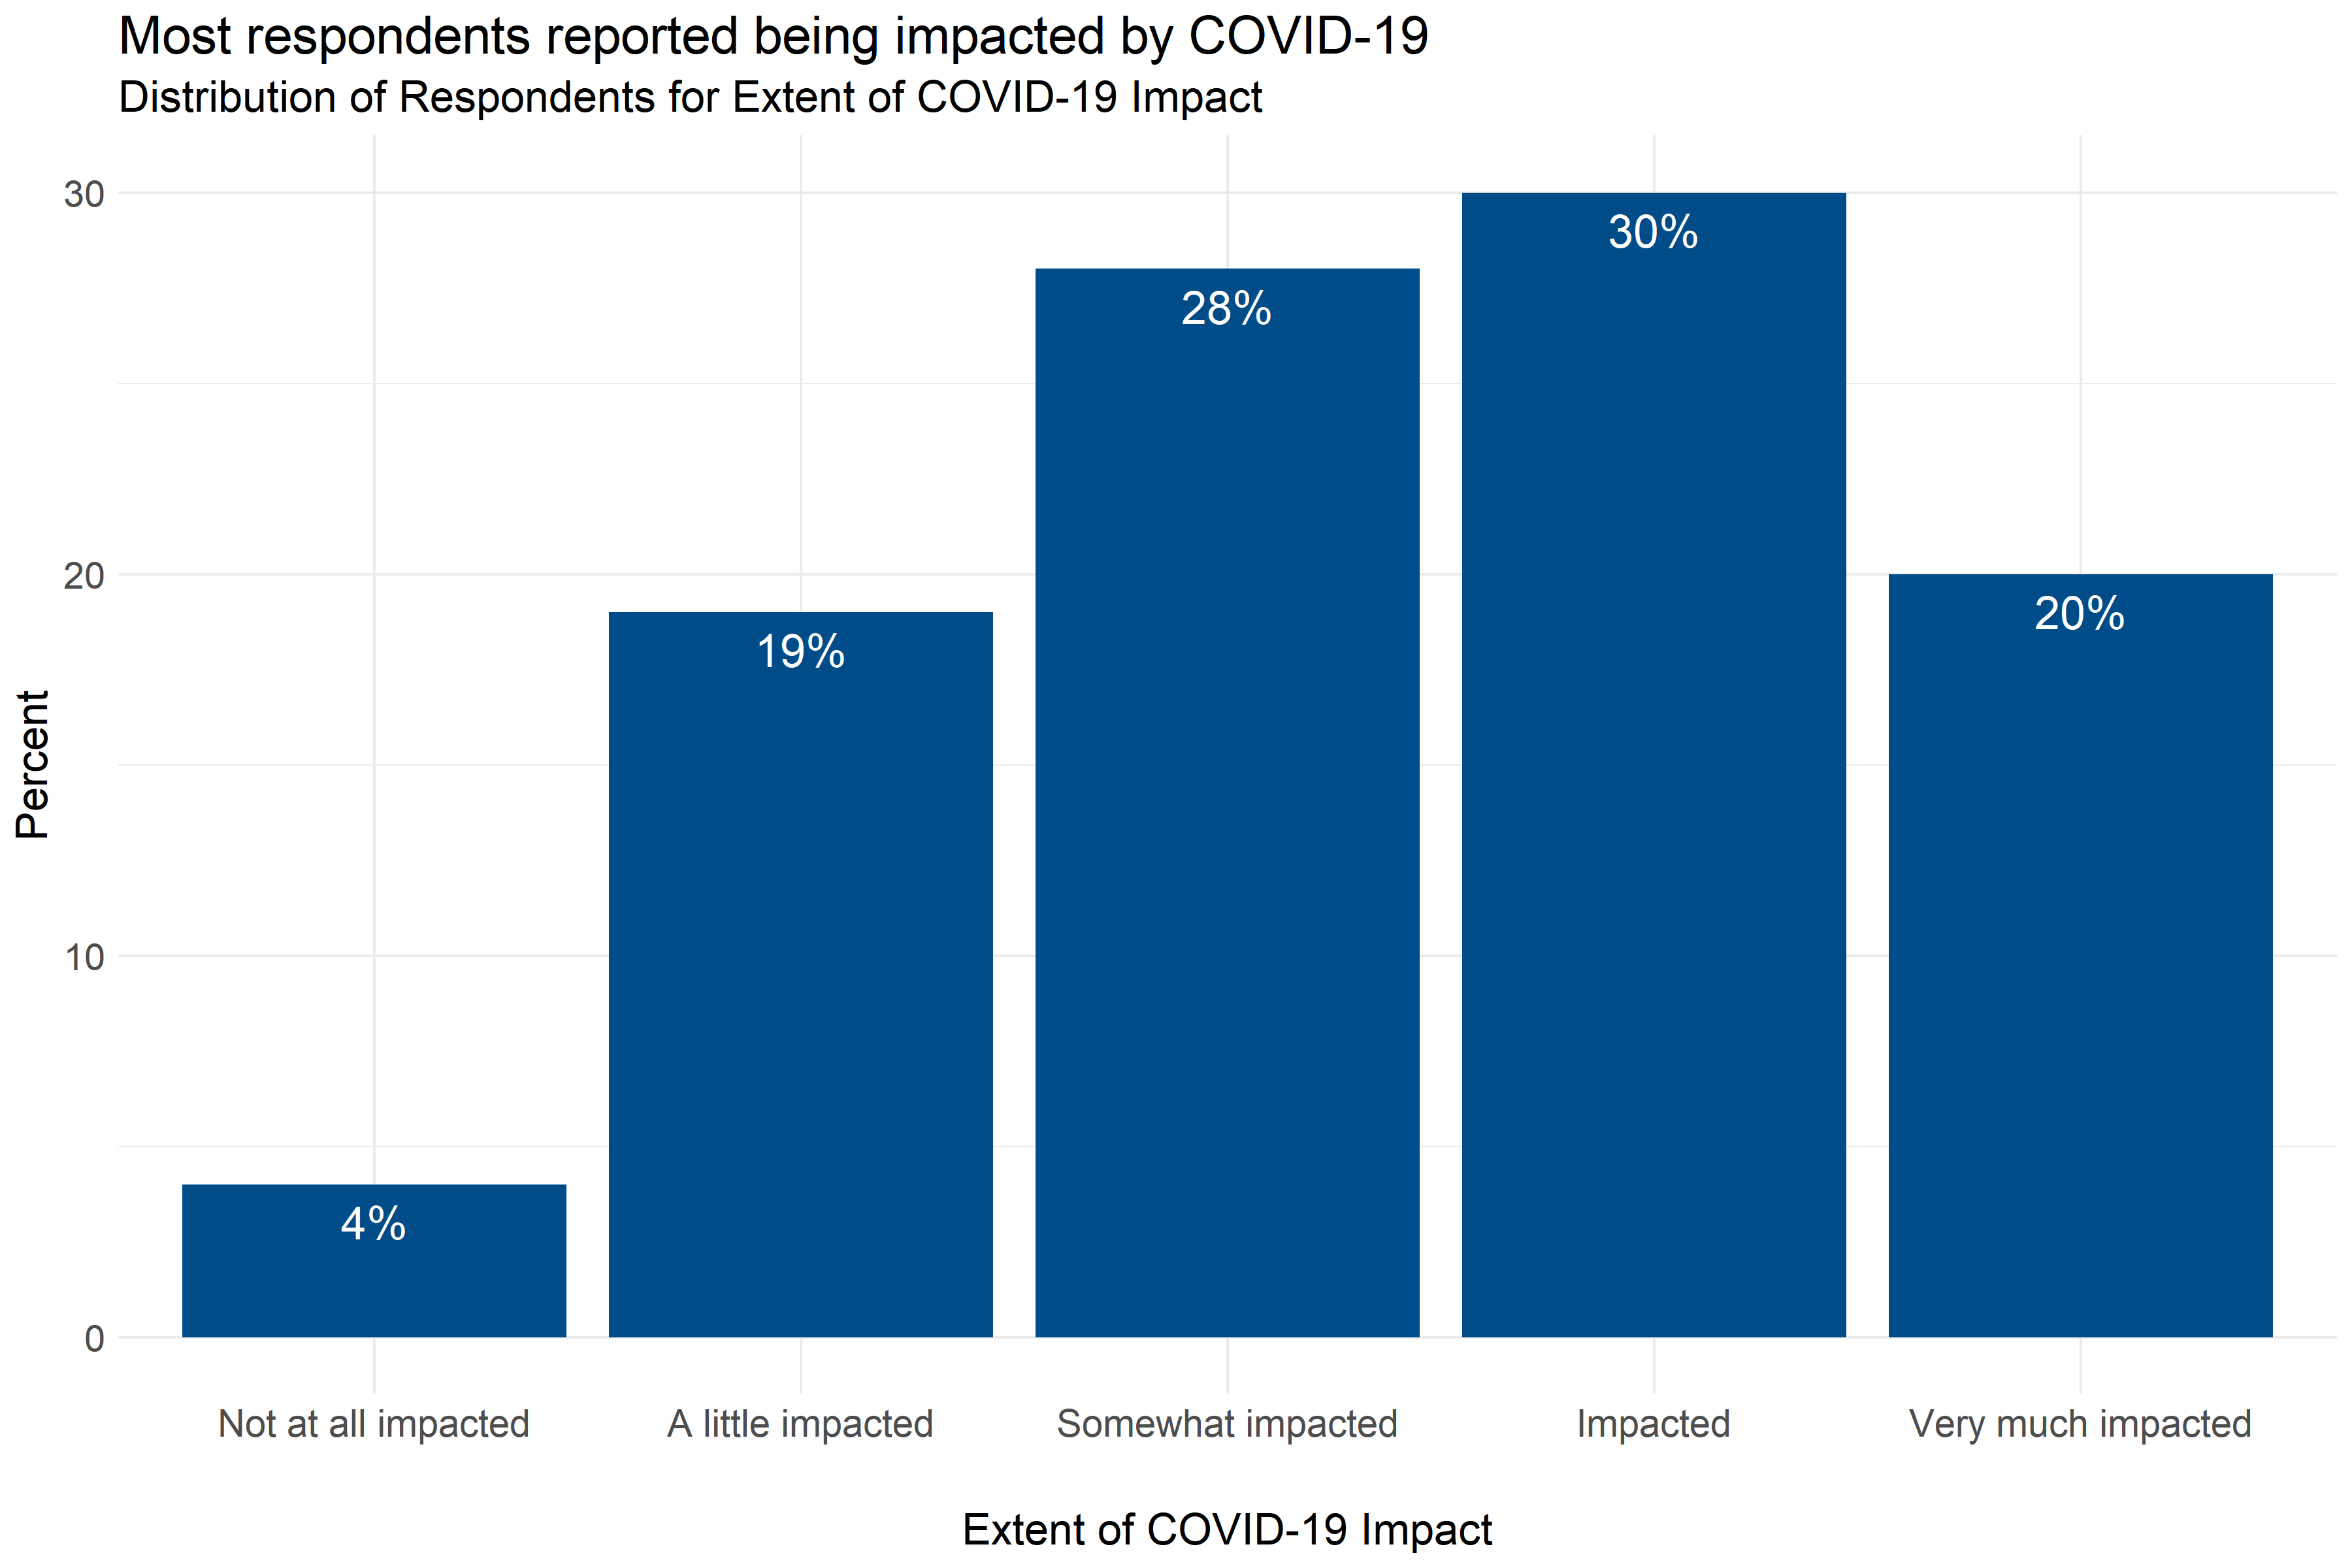
Figure 4.5: Distribution of responses about the extent to which COVID-19 has impacted respondents
Figure 4.5 shows that most respondents, around 78%, reported being at least somewhat impacted by COVID-19. Only 4% of respondents reported being “not at all impacted,” and 20% of respondents reported being “very much impacted.”
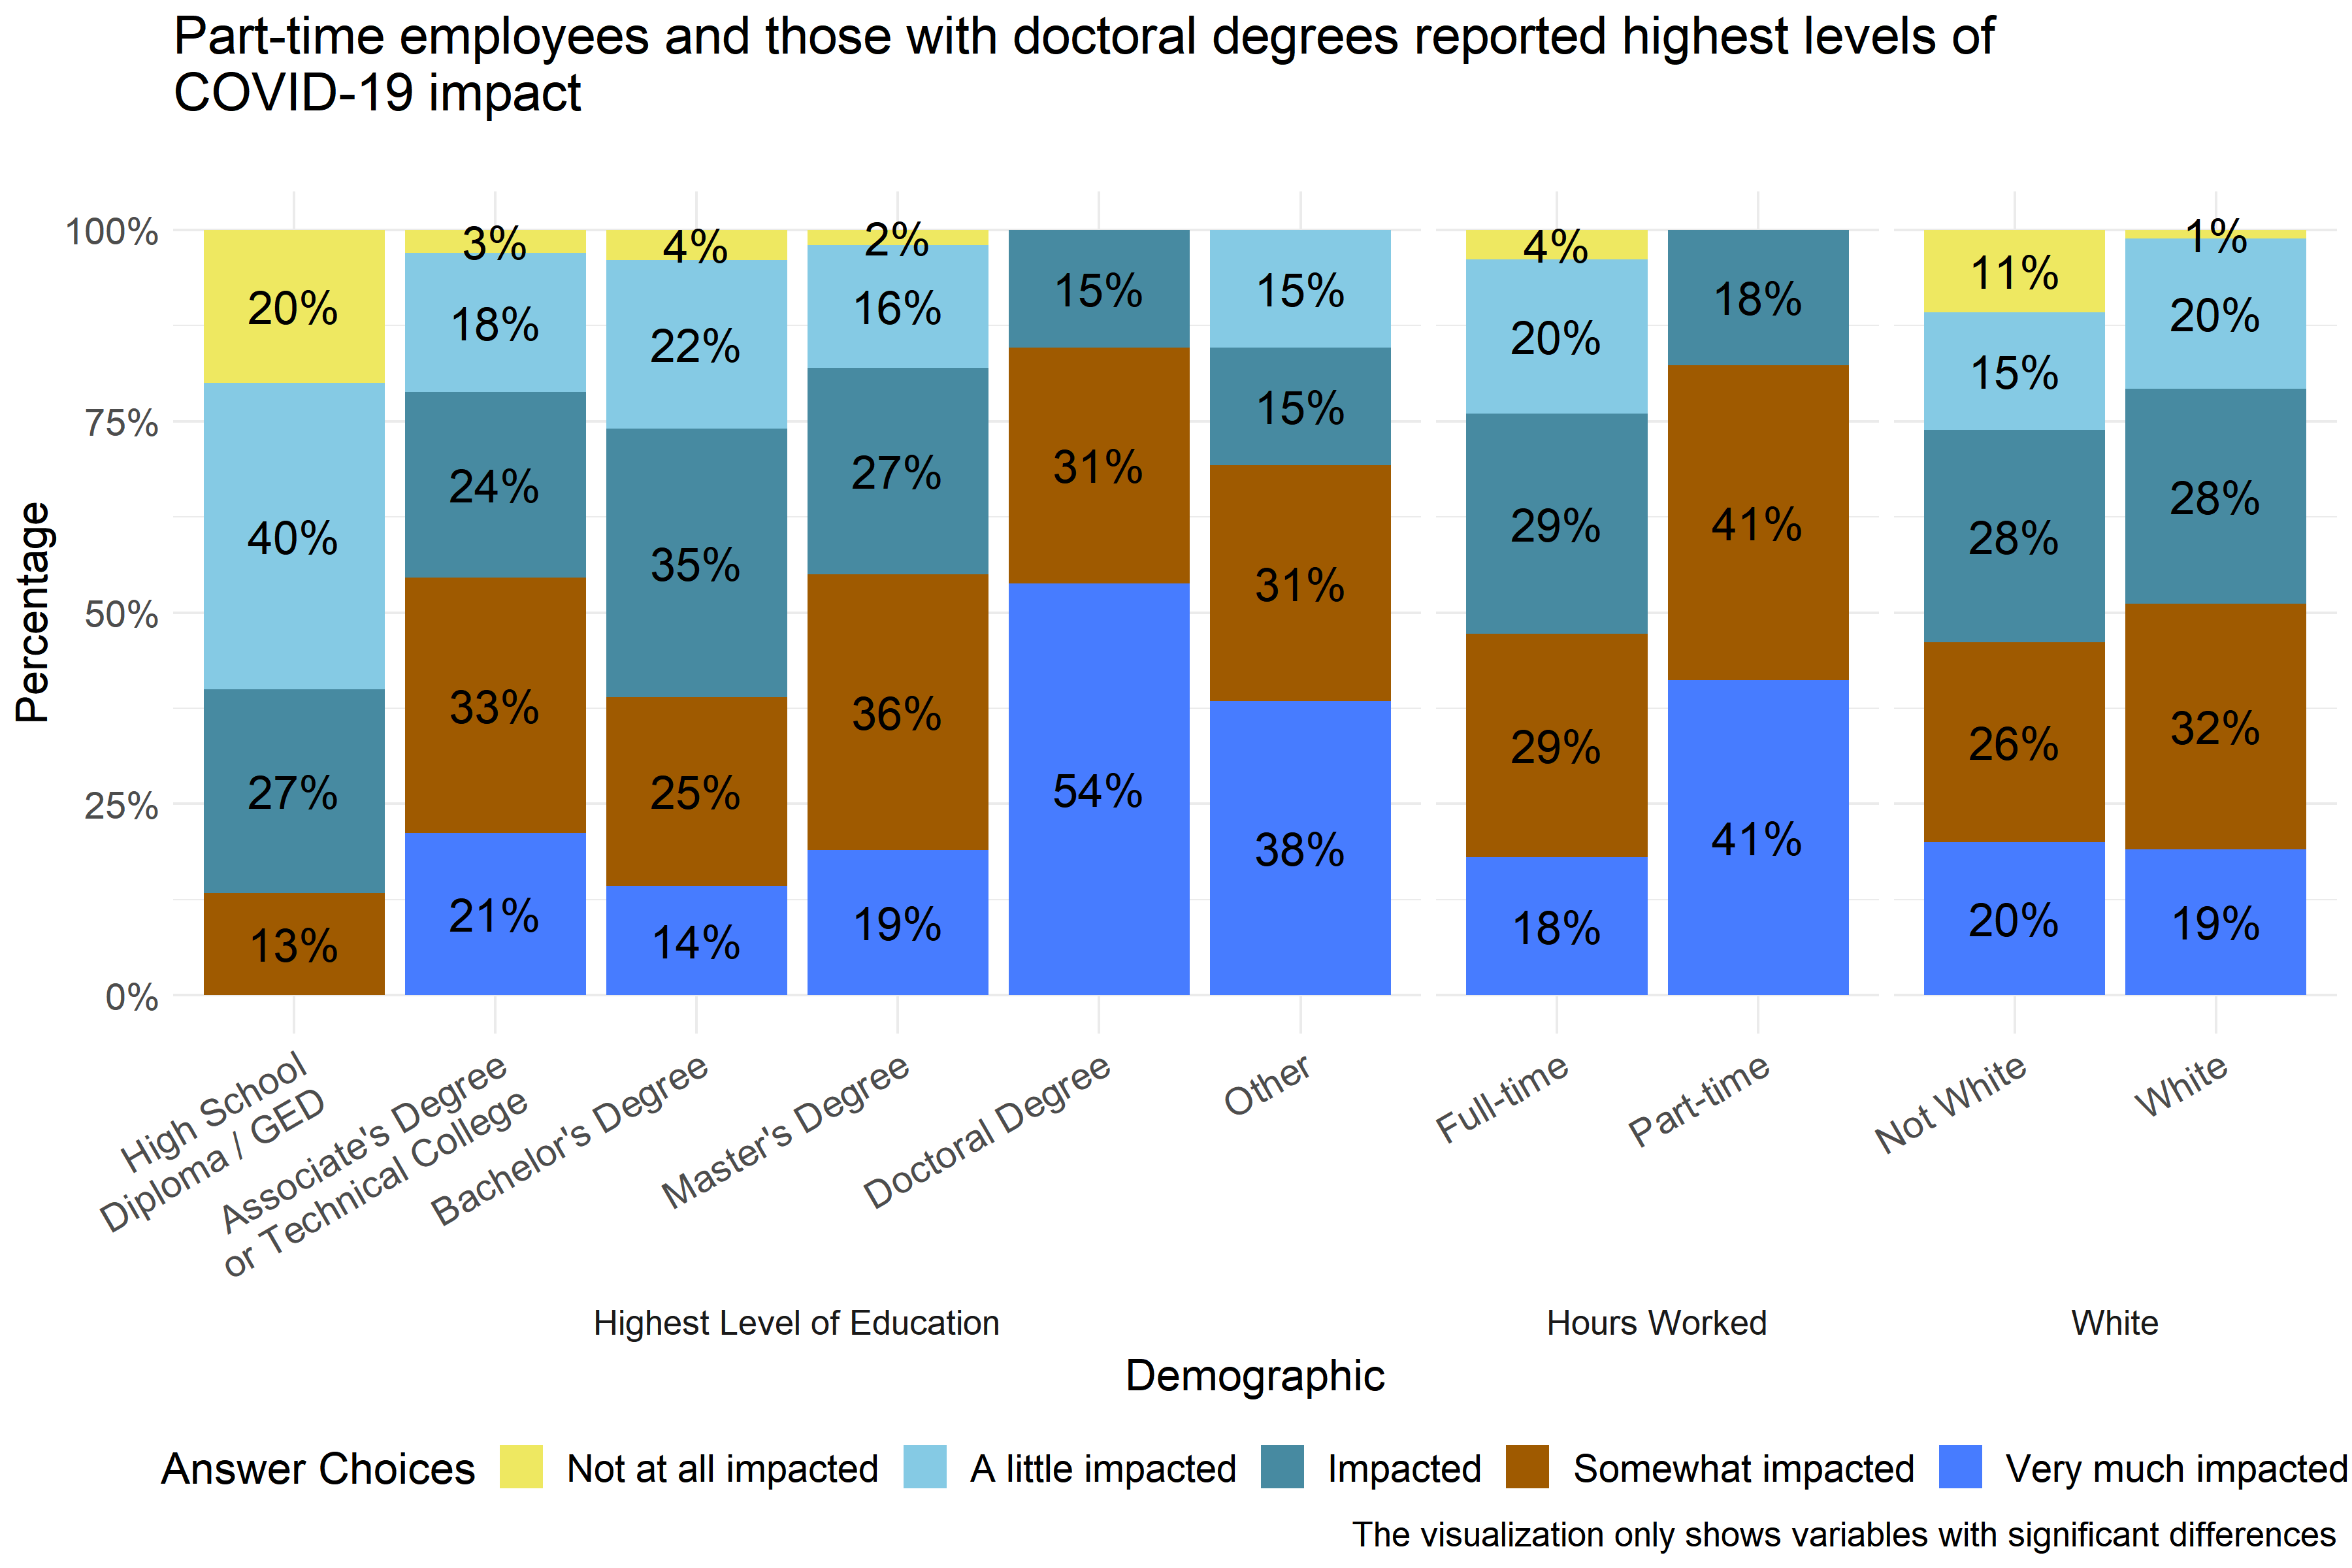
Figure 4.6: Extent of COVID-19 impact reported by demographic
Analysts found statistically significant differences in how respondents described the extent of COVID-19 impact that they had experienced by level of education, hours worked, whether or not respondents described themselves as White, and specific agency where respondents were employed. Figure 4.6 shows that all respondents with doctoral degrees reported that they were at least “impacted” by COVID-19, with 54% reporting that they have been “very much impacted.” Similarly all part-time workers reported being at least “impacted,” with 41% reporting being “very much impacted.” And, only 1% of White respondents reported being “not at all impacted,” compared to 11% who did not describe themselves as White. Analysts also found significant differences in reported COVID-19 impact across specific agencies, but did not include that information in Figure 4.6 to protect the privacy of employees at those agencies.
4.3.3 Types of Impact from COVID-19 Pandemic
The survey included an open-item response option for respondents to indicate how COVID-19 has impacted them and their family. The five most common types of impacts were as follows:
- Job changes or stressors (e.g., delivering services virtually) - 29% of respondents
- Isolation/Separation from others - 22% of respondents
- Job loss or disruption (self/spouse/family member) - 14% of respondents
- Kids’ School Changes - 14% of respondents
- Family stressors (including illness, tension over COVID) - 12% of respondents
4.3.4 Conclusions
The survey found that most staff in child-serving agencies have been impacted by the COVID-19 pandemic. About 78% of survey respondents reported being at least “somewhat impacted” by COVID-19, and about 20% reported being “very much impacted.” Analysts found that respondents with doctoral degrees and part-time respondents reported more impact from COVID-19 than others. (It is possible that respondents with doctoral degrees were disproportionately working in pediatric healthcare settings.) This suggests that any efforts taken to mitigate the stressors or emotional impact of COVID-19 on agency staff should be sure to include part-time employees as well as those with high levels of education. Some individual agencies may also have staff who have been more impacted by COVID-19 than others.
The most common COVID-19 impacts reported by child-serving agencies were job changes and stressors, isolation/separation from others, job losses or disruption, kids’ school changes, and family stressors. This is consistent with what analysts learned from interviews with child-serving agency staff.
4.4 Staff Experiences of Secondary Traumatic Stress (STS)
This section includes survey results of the staff experiences of STS or what is also known as ‘compassion fatigue.’ The questions asked in this section include statements made by people who have been impacted by their work with traumatized clients. STS (or compassion fatigue) can have negative effects such as mental and physical health issues, strained relationships at home, and poor work performance. Below are a few example questions from this measure:
- “My heart started pounding when I thought about my work with clients.”
- “I felt jumpy.”
4.4.1 Key Findings
- Scores on the STS Scale subscales were generally low, but some respondents did report high scores.
- Scores on the Arousal Subscale were the highest of the three subscales.
- Across all three subscales, respondents who identified themselves as White had higher scores than those who did not, and those who identified themselves as Black / African American had lower subscores than those who did not.
- Executive officers and administrators had lower scores on the Arousal and Avoidance subscales than other respondents.
- Respondents not at all impacted by COVID-19 and those reporting more years of experience in the field had lower scores on the Arousal Subscale.
4.4.1.1 Intrusion Subscale
The Intrusion Subscale of the Secondary Traumatic Stress Scale Survey measures how employees responded to questions about the “recurrent and distressing recollections of patients.” (Orrù et al. 2021) Respondents answered on a five point scale with options ranging from 1 “Never” to 5 “Very Often” to statements like, “My heart started pounding when I thought about my work with clients.” and “Reminders of my work with clients upset me.” Individual responses to each of the questions in this scale can be found in Appendix B: Detailed Question Responses by Scale. Lower scores on this scale indicate little or no intrusion, and higher scores indicate high or severe intrusion.
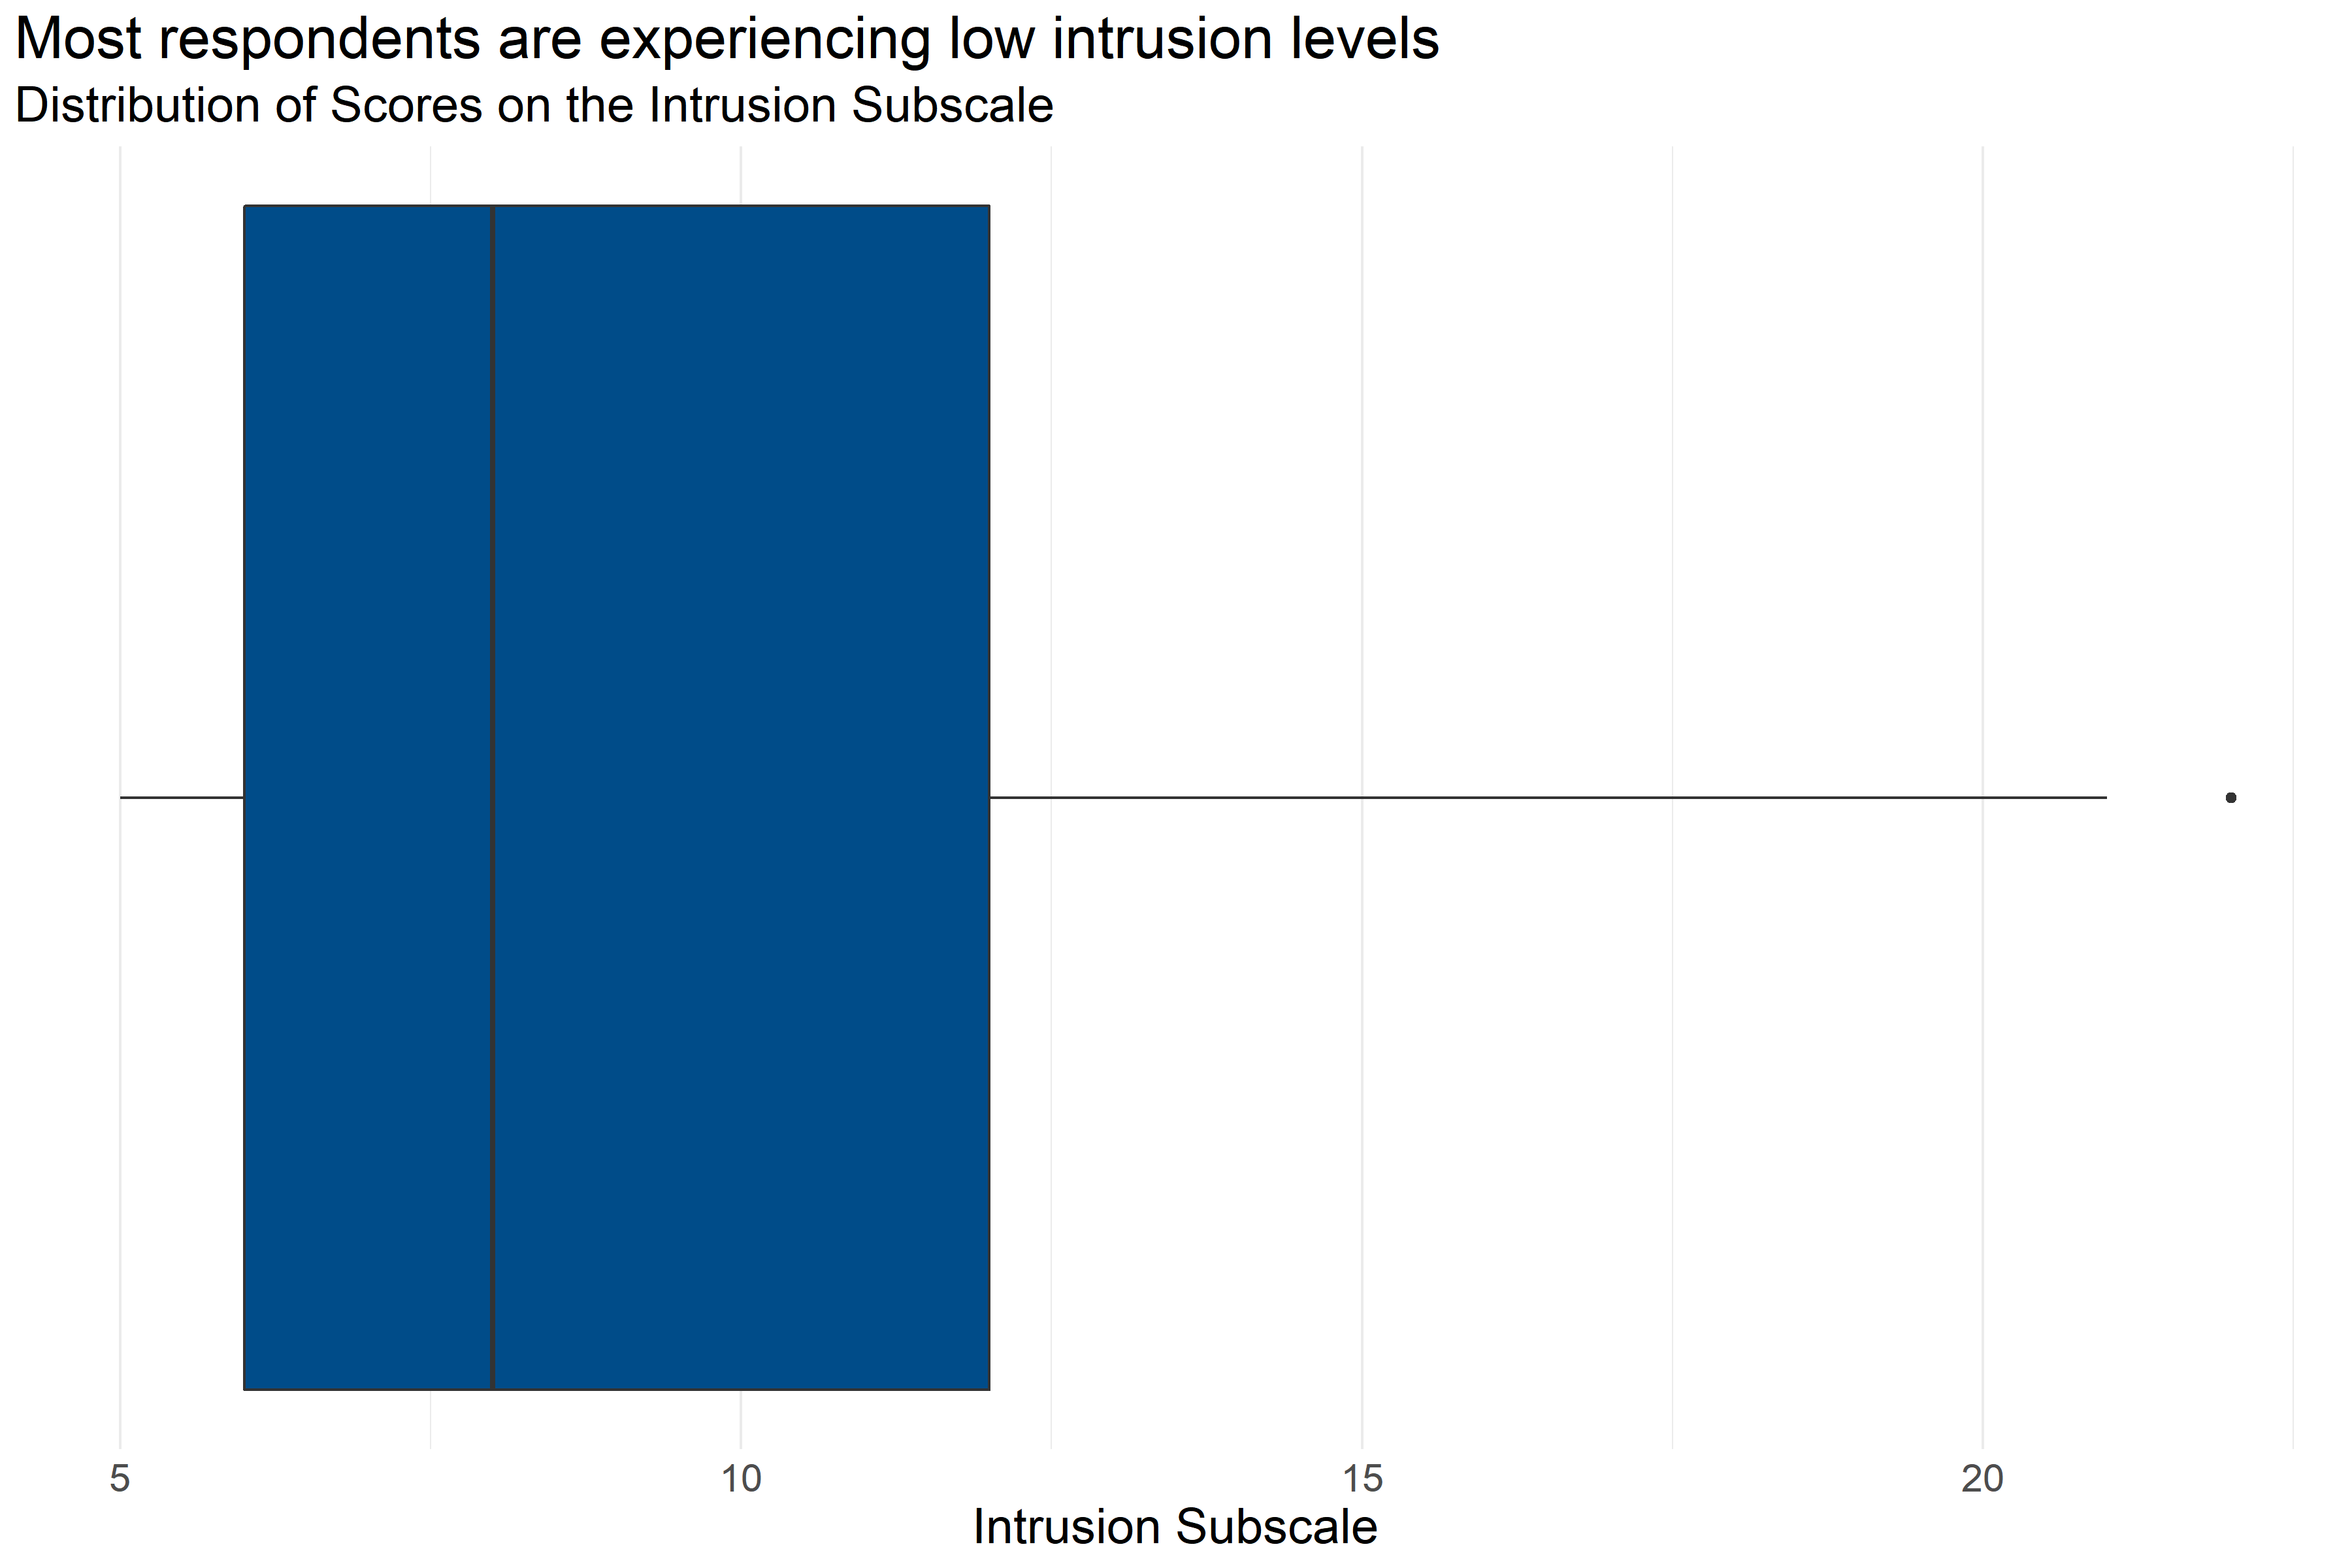
Figure 4.7: Boxplot of score distributions for the Intrusion Subscale
| Number of Answers | Average Score | Lowest Score | First Quartile | Median | Third Quartile | Highest Score |
|---|---|---|---|---|---|---|
| 227 | 9.32 | 5 | 6 | 8 | 12 | 22 |
Figure 4.7 and Table 4.22 provide information about how respondents scored on the Intrusion Subscale. They provide the following information:
- Response: 227 respondents answered all questions in the scale.
- Average: The average score was 5.
- Range: Scores ranged from 9.32 to 22.
- Median: About half of respondents scored below 8 and half scored above 8.
- Interquartile Range: If the range of responses were cut into quarters, the middle half of respondents (between the first and third quartiles) scored between 6 and 12.
This indicates that most respondents are experiencing relatively low levels of intrusion as a potential symptom of secondary traumatic stress syndrome, but some respondents reported experiencing higher levels of intrusion.
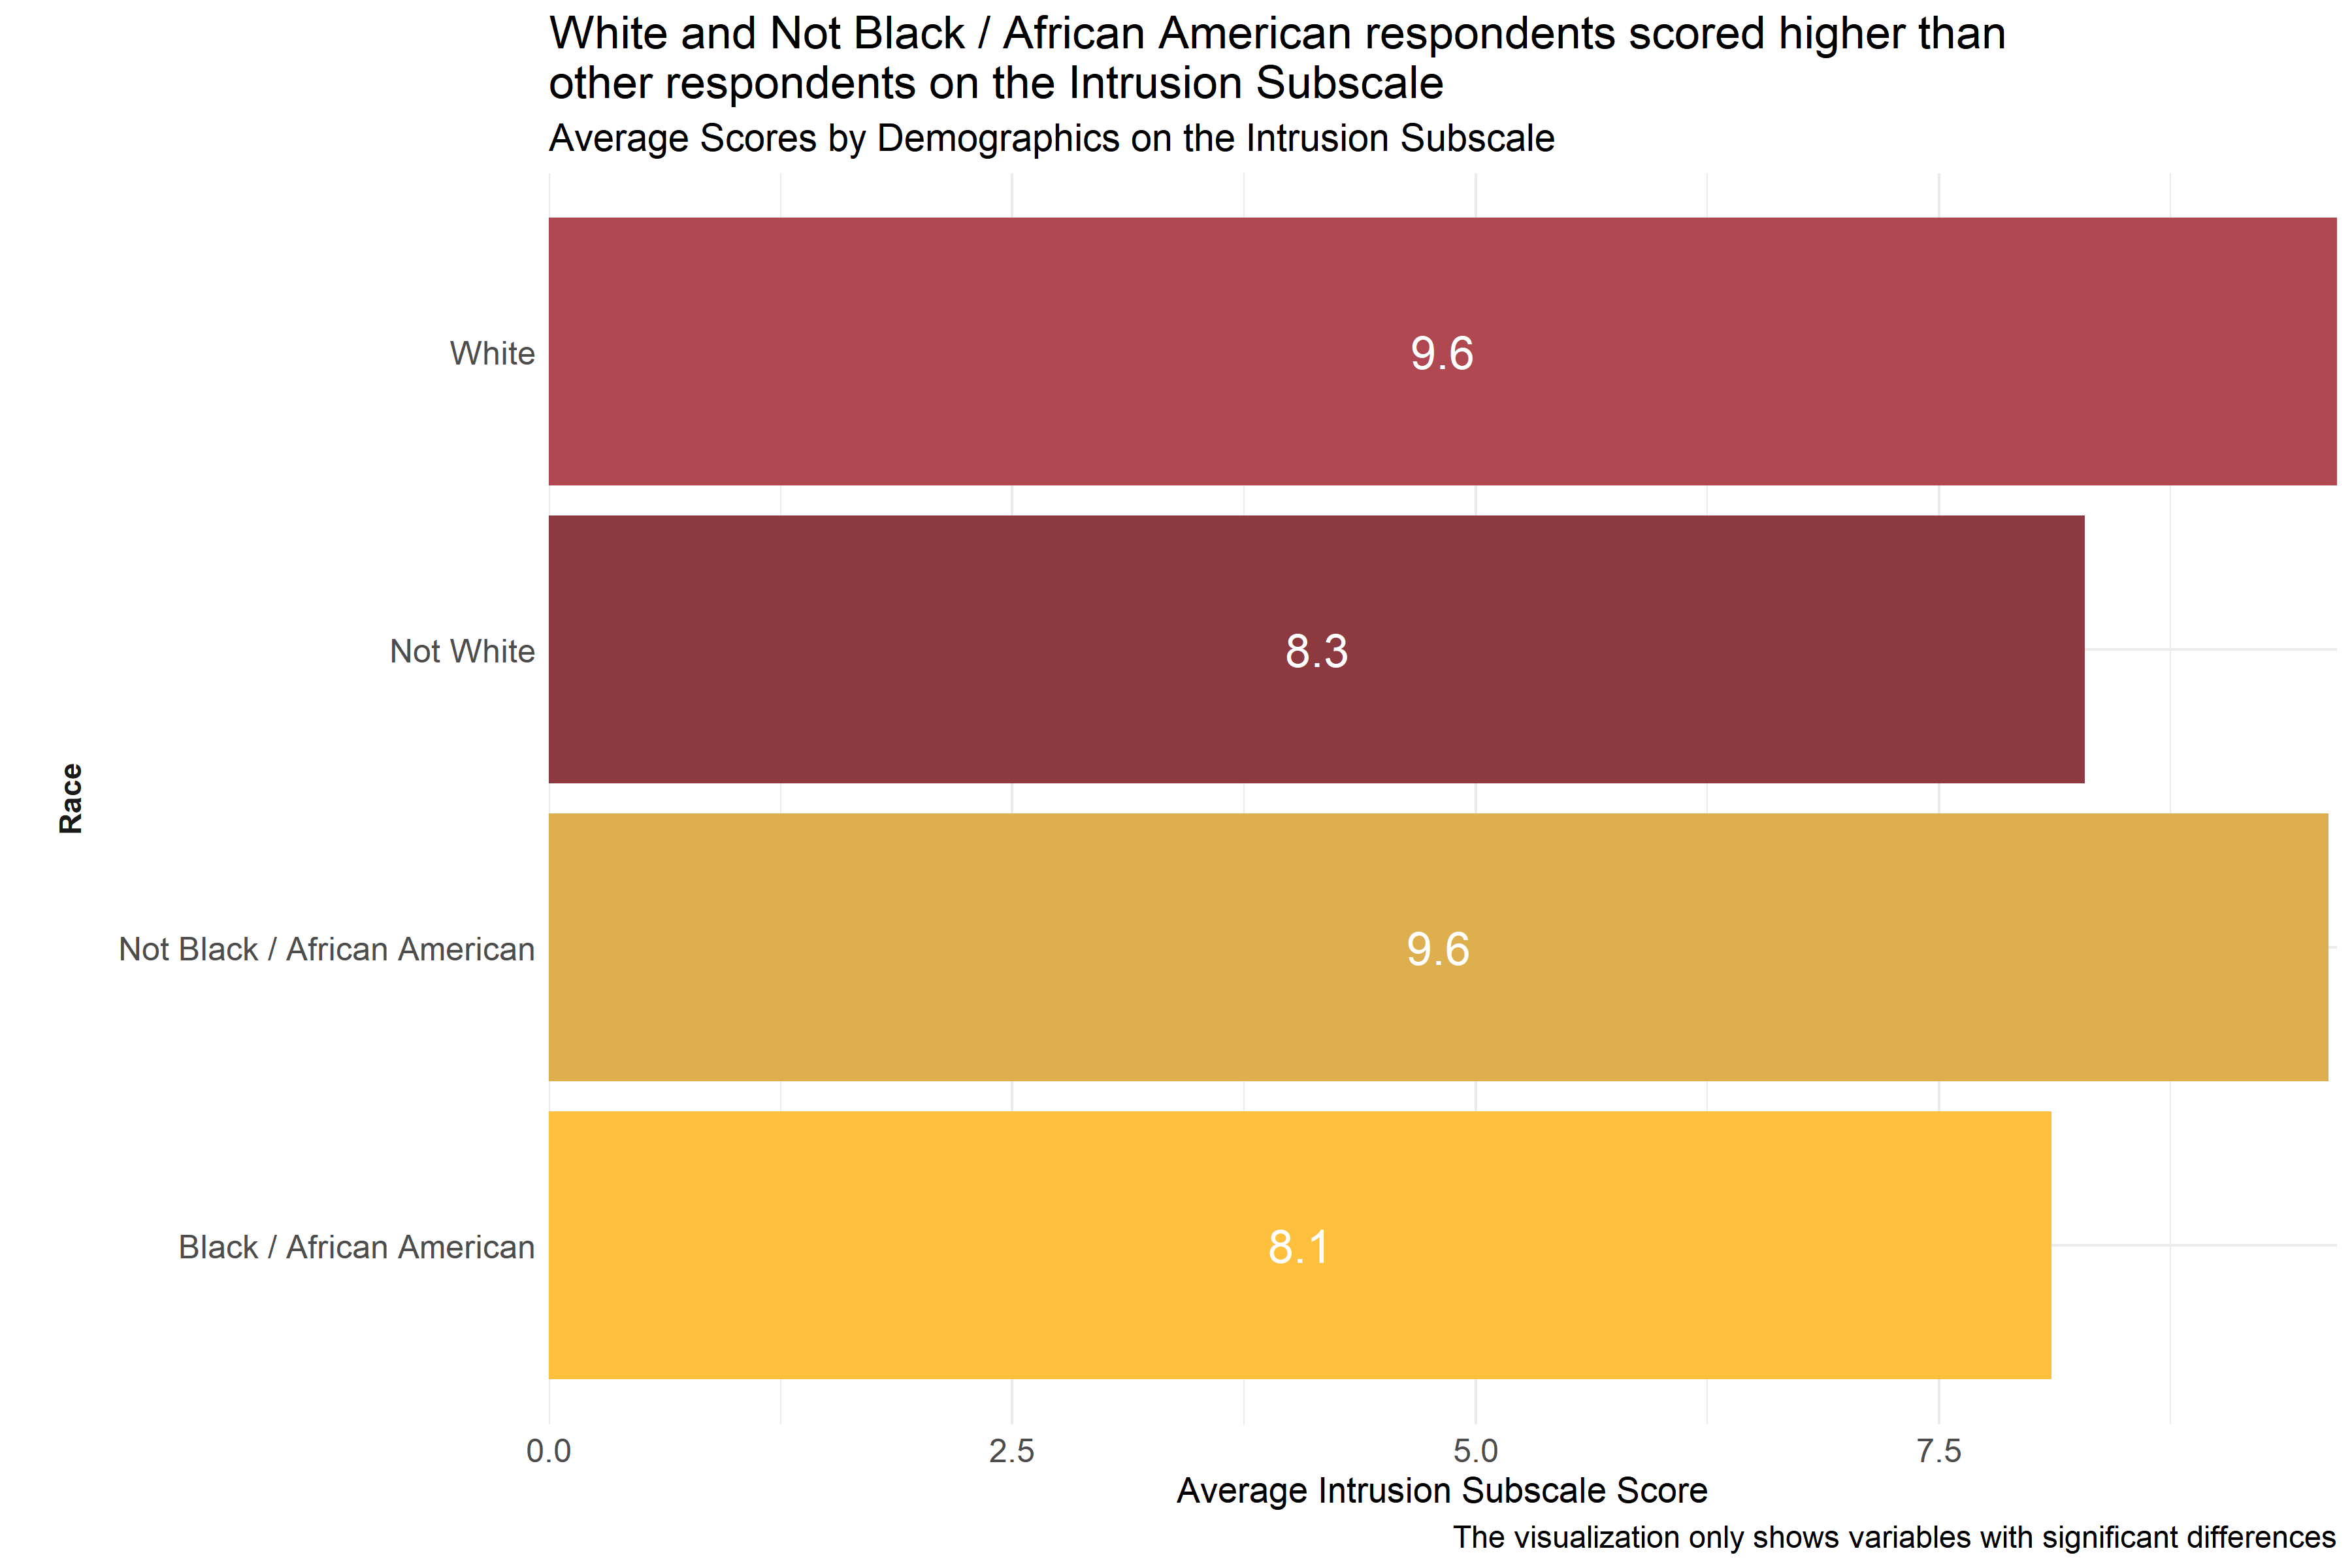
Figure 4.8: Average scores for Intrusion Subscale across demographic groups
Analysts tested the average scores on the Intrusion Subscale across demographic groups to identify differences in how respondents answered questions about potential symptoms of secondary traumatic stress. As Figure 4.8 shows, respondents who identified themselves as White or Not Black / African American scored higher on the Intrusion Subscale than other races. (Respondents were asked to select racial identities from a list of options and could select more than one.) This suggests that respondents identifying as White or Not Black / African American are experiencing more intrusion.
Analysts also observed differences in average scores across different agencies, but these scores are not included in Figure 4.8 to protect the privacy of those agencies.
4.4.1.2 Avoidance Subscale
The Avoidance Subscale of the Secondary Traumatic Stress Scale Survey measures how employees responded to questions about “the avoidance of stimuli associated with the care of patients and the numbing of general responsiveness.” (Orrù et al. 2021) Respondents answered on a five point scale with options ranging from 1 “Never” to 5 “Very Often” to statements like, “I had little interest in being around others.” and “I avoided people, places, or things that reminded me of my work with clients.” Individual responses to each of the questions in this scale can be found in Appendix B: Detailed Question Responses by Scale. Lower scores on this scale indicate little or no avoidance, and higher scores indicate high or severe avoidance.
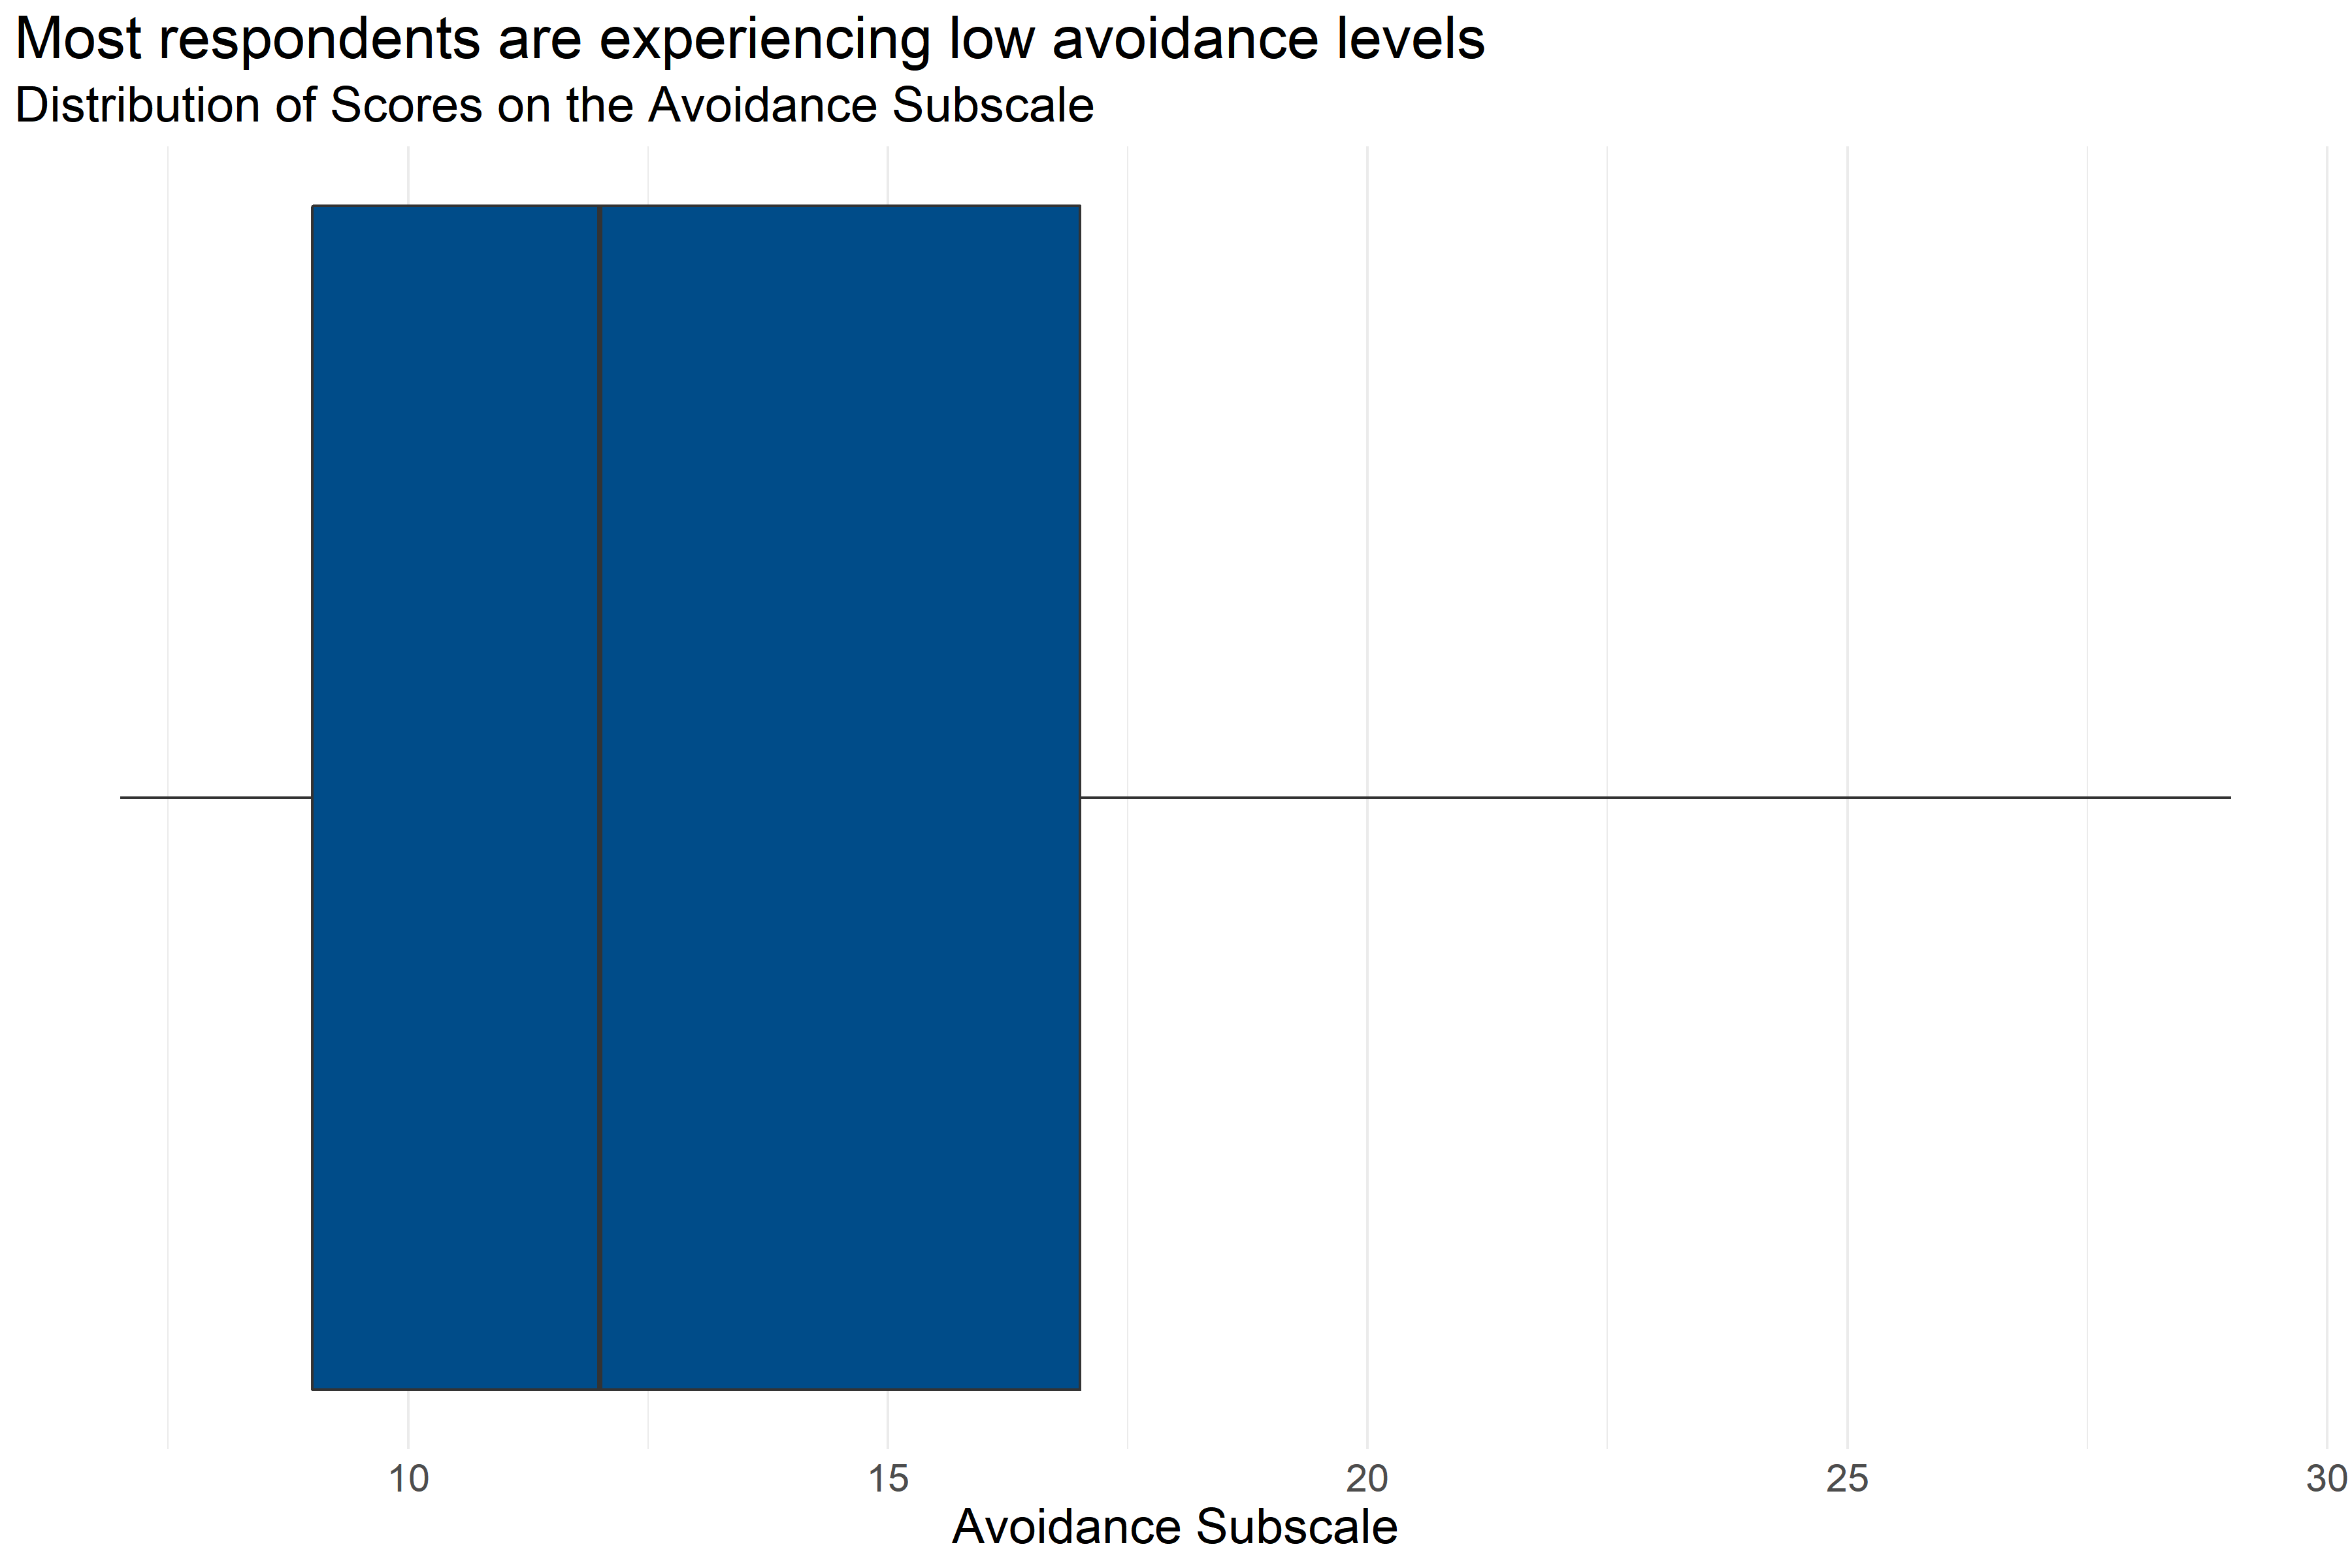
Figure 4.9: Boxplot of score distributions for the Avoidance Subscale
| Number of Answers | Average Score | Lowest Score | First Quartile | Median | Third Quartile | Highest Score |
|---|---|---|---|---|---|---|
| 217 | 13.13 | 7 | 9 | 12 | 17 | 29 |
Figure 4.9 and Table 4.23 provide information about how respondents scored on the Avoidance Subscale. They provide the following information:
- Response: 217 respondents answered all questions in the scale.
- Average: The average score was 7.
- Range: Scores ranged from 13.13 to 29.
- Median: About half of respondents scored below 12 and half scored above 12.
- Interquartile Range: If the range of responses were cut into quarters, the middle half of respondents (between the first and third quartiles) scored between 9 and 17.
While most respondents scored relatively low on the avoidance subscale, there were some respondents with relatively high scores.
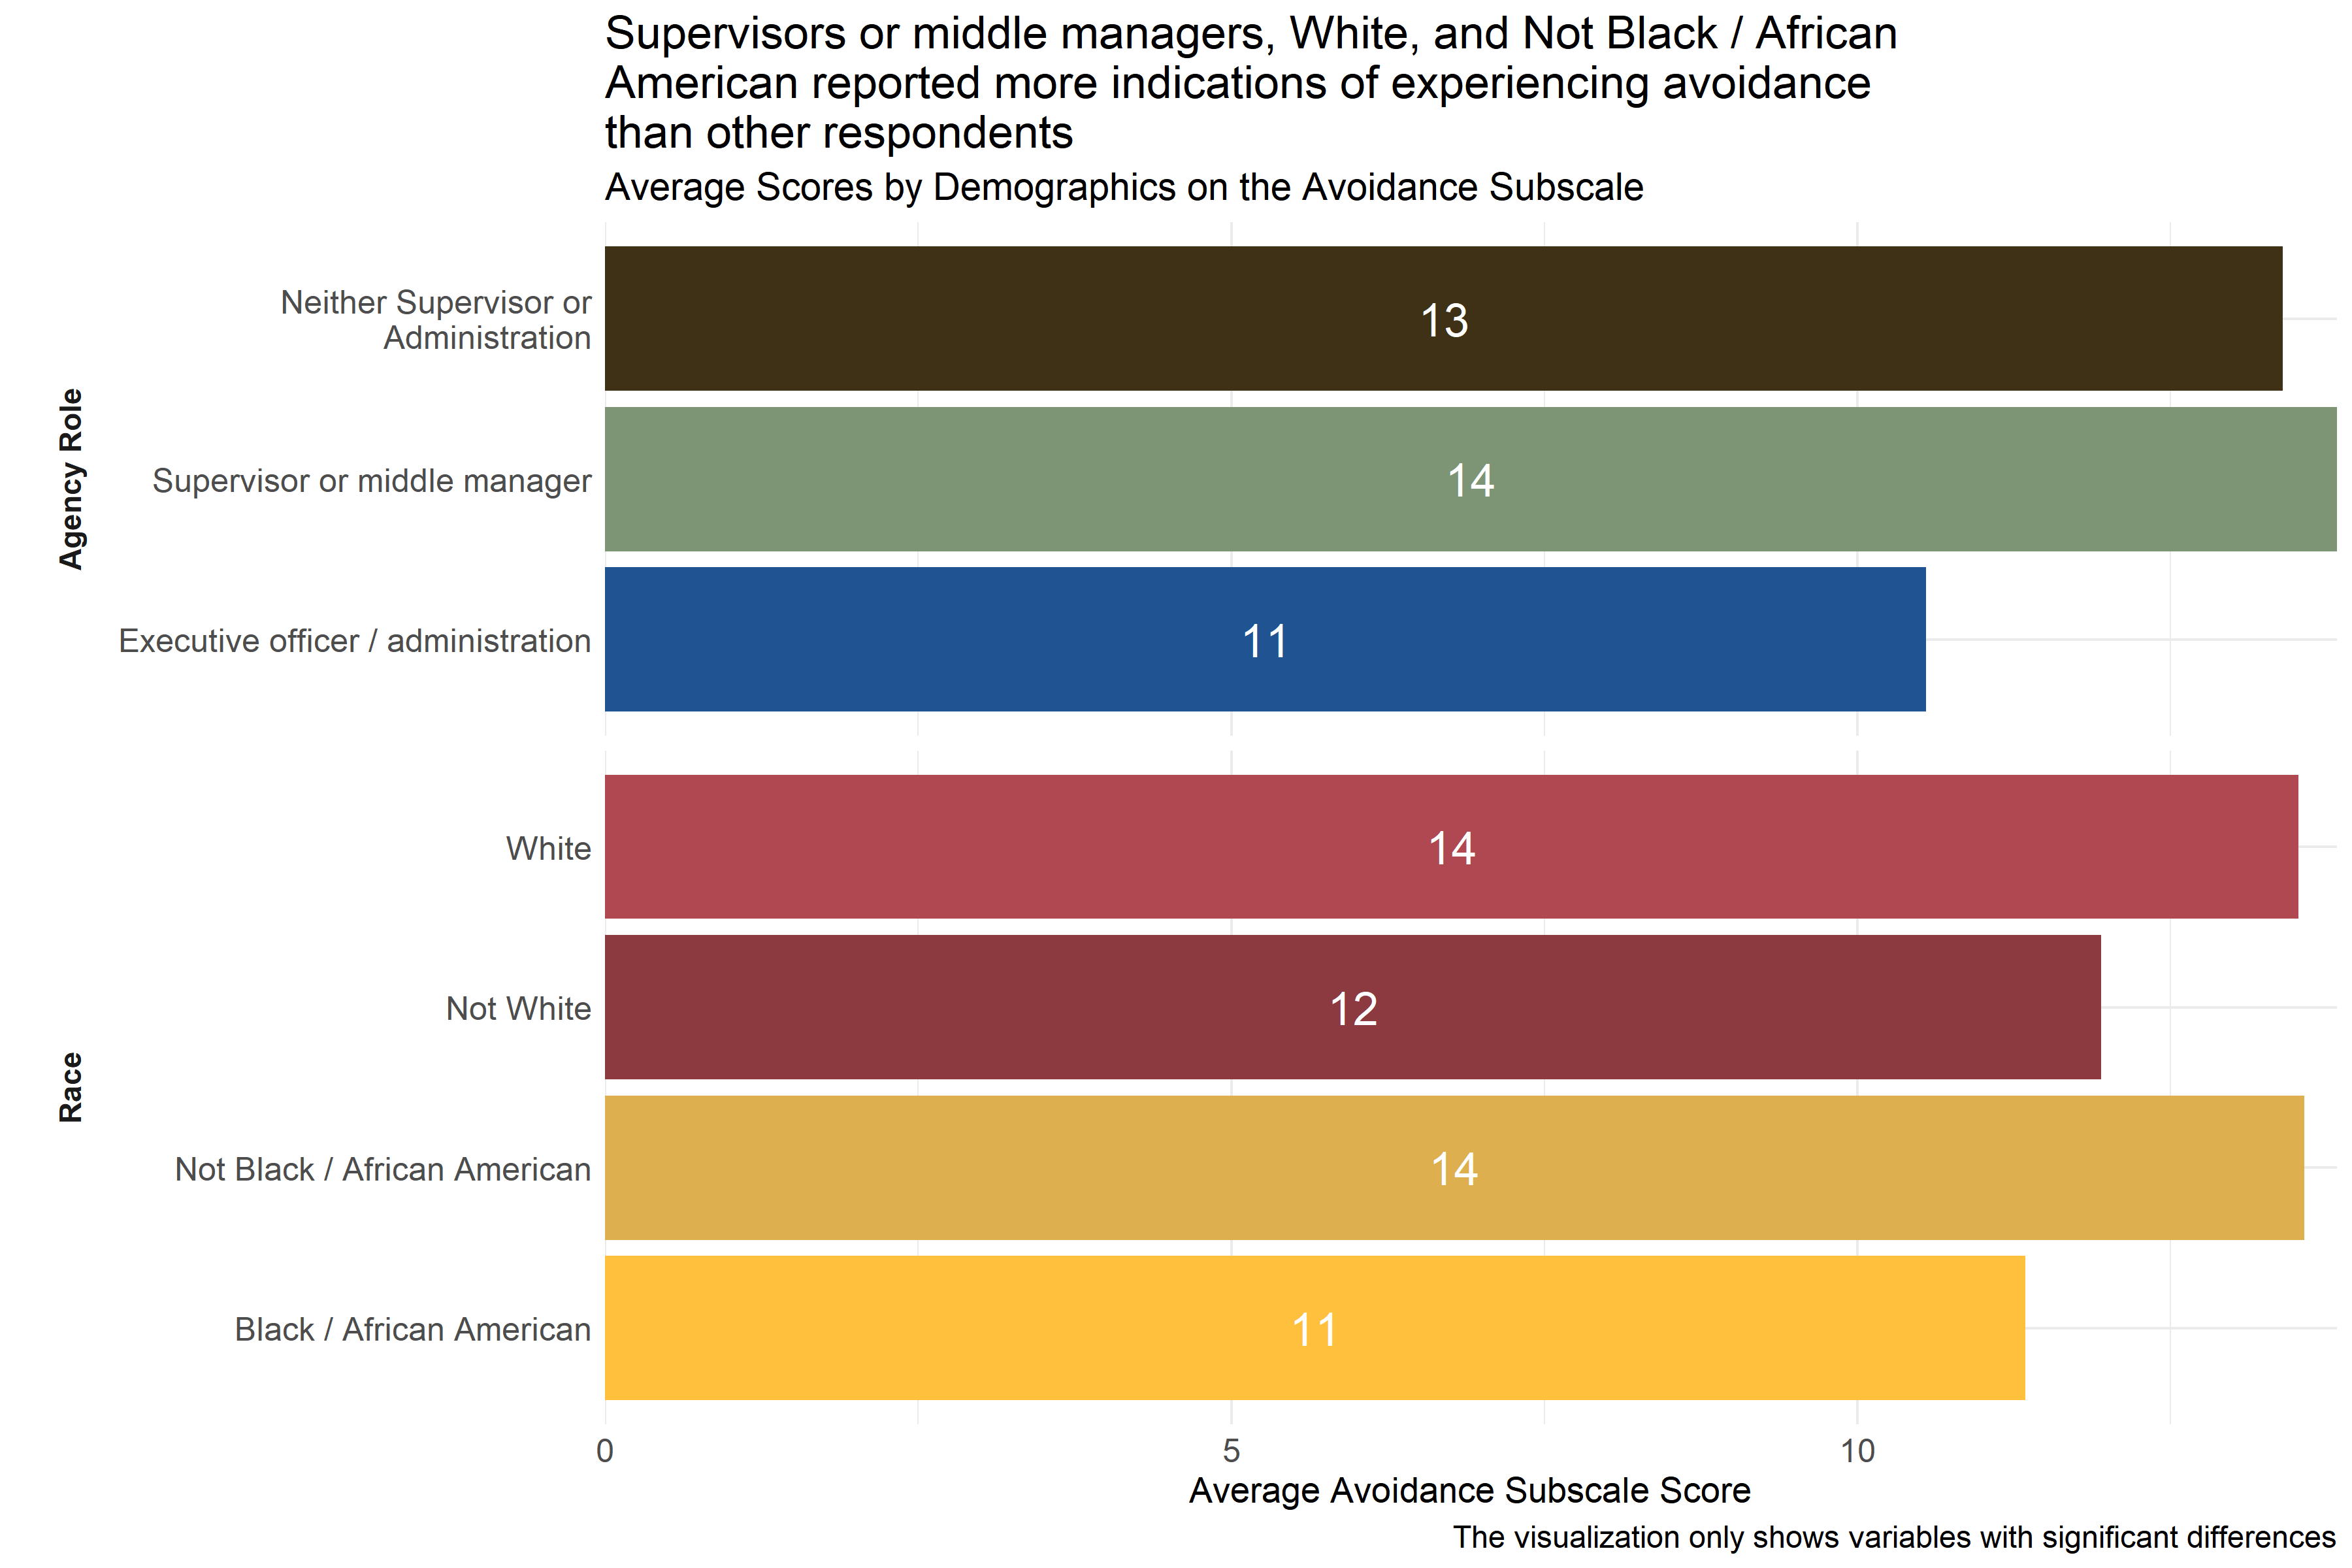
Figure 4.10: Average scores for Avoidance Subscale across demographic groups
Analysts tested the average scores on the Avoidance Subscale across demographic groups to identify differences in how respondents answered questions about potential symptoms of secondary traumatic stress. As Figure 4.10 shows, there were some statistically significant differences in average score across respondent groups by race and role in agency. Respondents identifying as executive officers or administrators had lower average scores than respondents in other agency roles. Additionally, Not Black / African American and White respondents reported higher scores than other respondents. (Respondents were asked to select racial identities from a list of options and could select more than one.)
Analysts also observed significant differences in average scores across agencies, but scores from these specific agencies were not included in Figure 4.10 to protect those agencies’ privacy.
4.4.1.3 Arousal Subscale
The Arousal Subscale of the Secondary Traumatic Stress Scale Survey measures how employees responded to questions “that assess symptoms like irritability, hypervigilance, and difficulty concentrating.” (Orrù et al. 2021) Respondents answered on a five point scale with options ranging from 1 “Never” to 5 “Very Often” to statements like, “I had trouble concentrating.” and “I expected something bad to happen.” Individual responses to each of the questions in this scale can be found in Appendix B: Detailed Question Responses by Scale. Lower scores on this scale indicate little or no arousal, and higher scores indicate high or severe arousal.
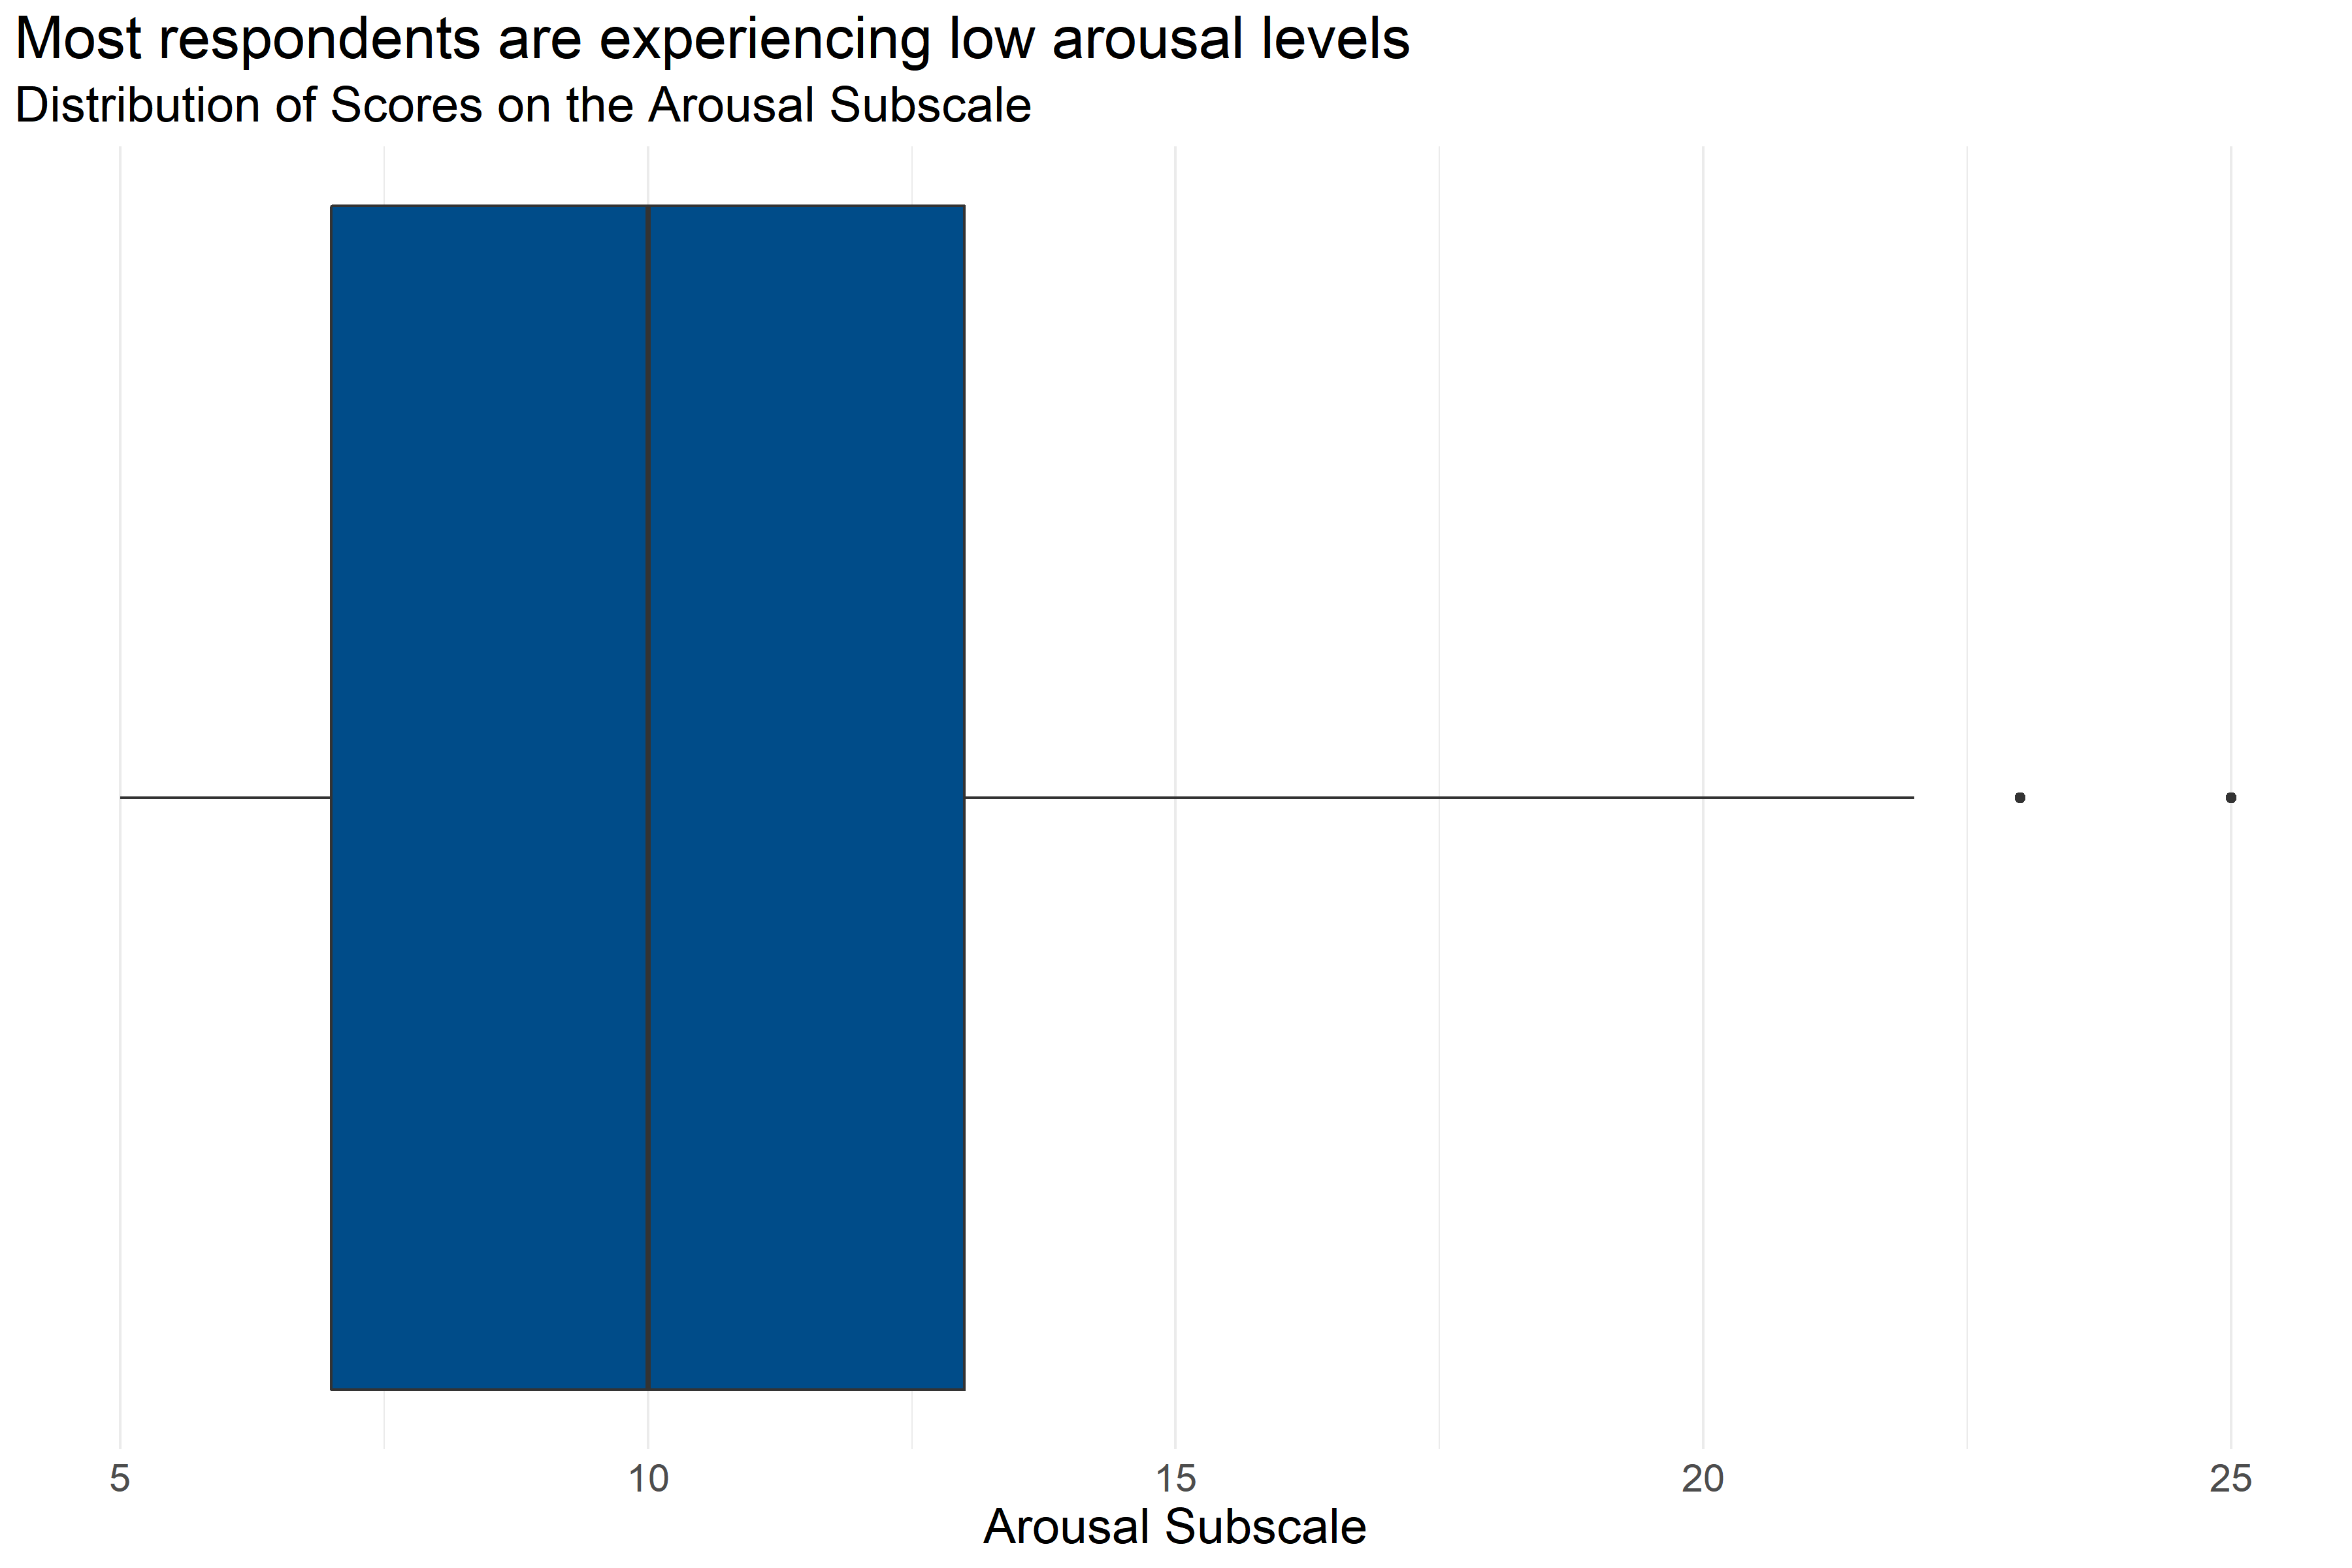
Figure 4.11: Boxplot of score distributions for the Arousal Subscale
| Number of Answers | Average Score | Lowest Score | First Quartile | Median | Third Quartile | Highest Score |
|---|---|---|---|---|---|---|
| 239 | 10.66 | 5 | 7 | 10 | 13 | 25 |
Figure 4.11 and Table 4.24 provide information about how respondents scored on the Arousal Subscale. They provide the following information:
- Response: 239 respondents answered all questions in the scale.
- Average: The average score was 5.
- Range: Scores ranged from 10.66 to 25.
- Median: About half of respondents scored below 10 and half scored above 10.
- Interquartile Range: If the range of responses were cut into quarters, the middle half of respondents (between the first and third quartiles) scored between 7 and 13.
While most respondents scored relatively low on the arousal subscale, there were some respondents with relatively high scores.
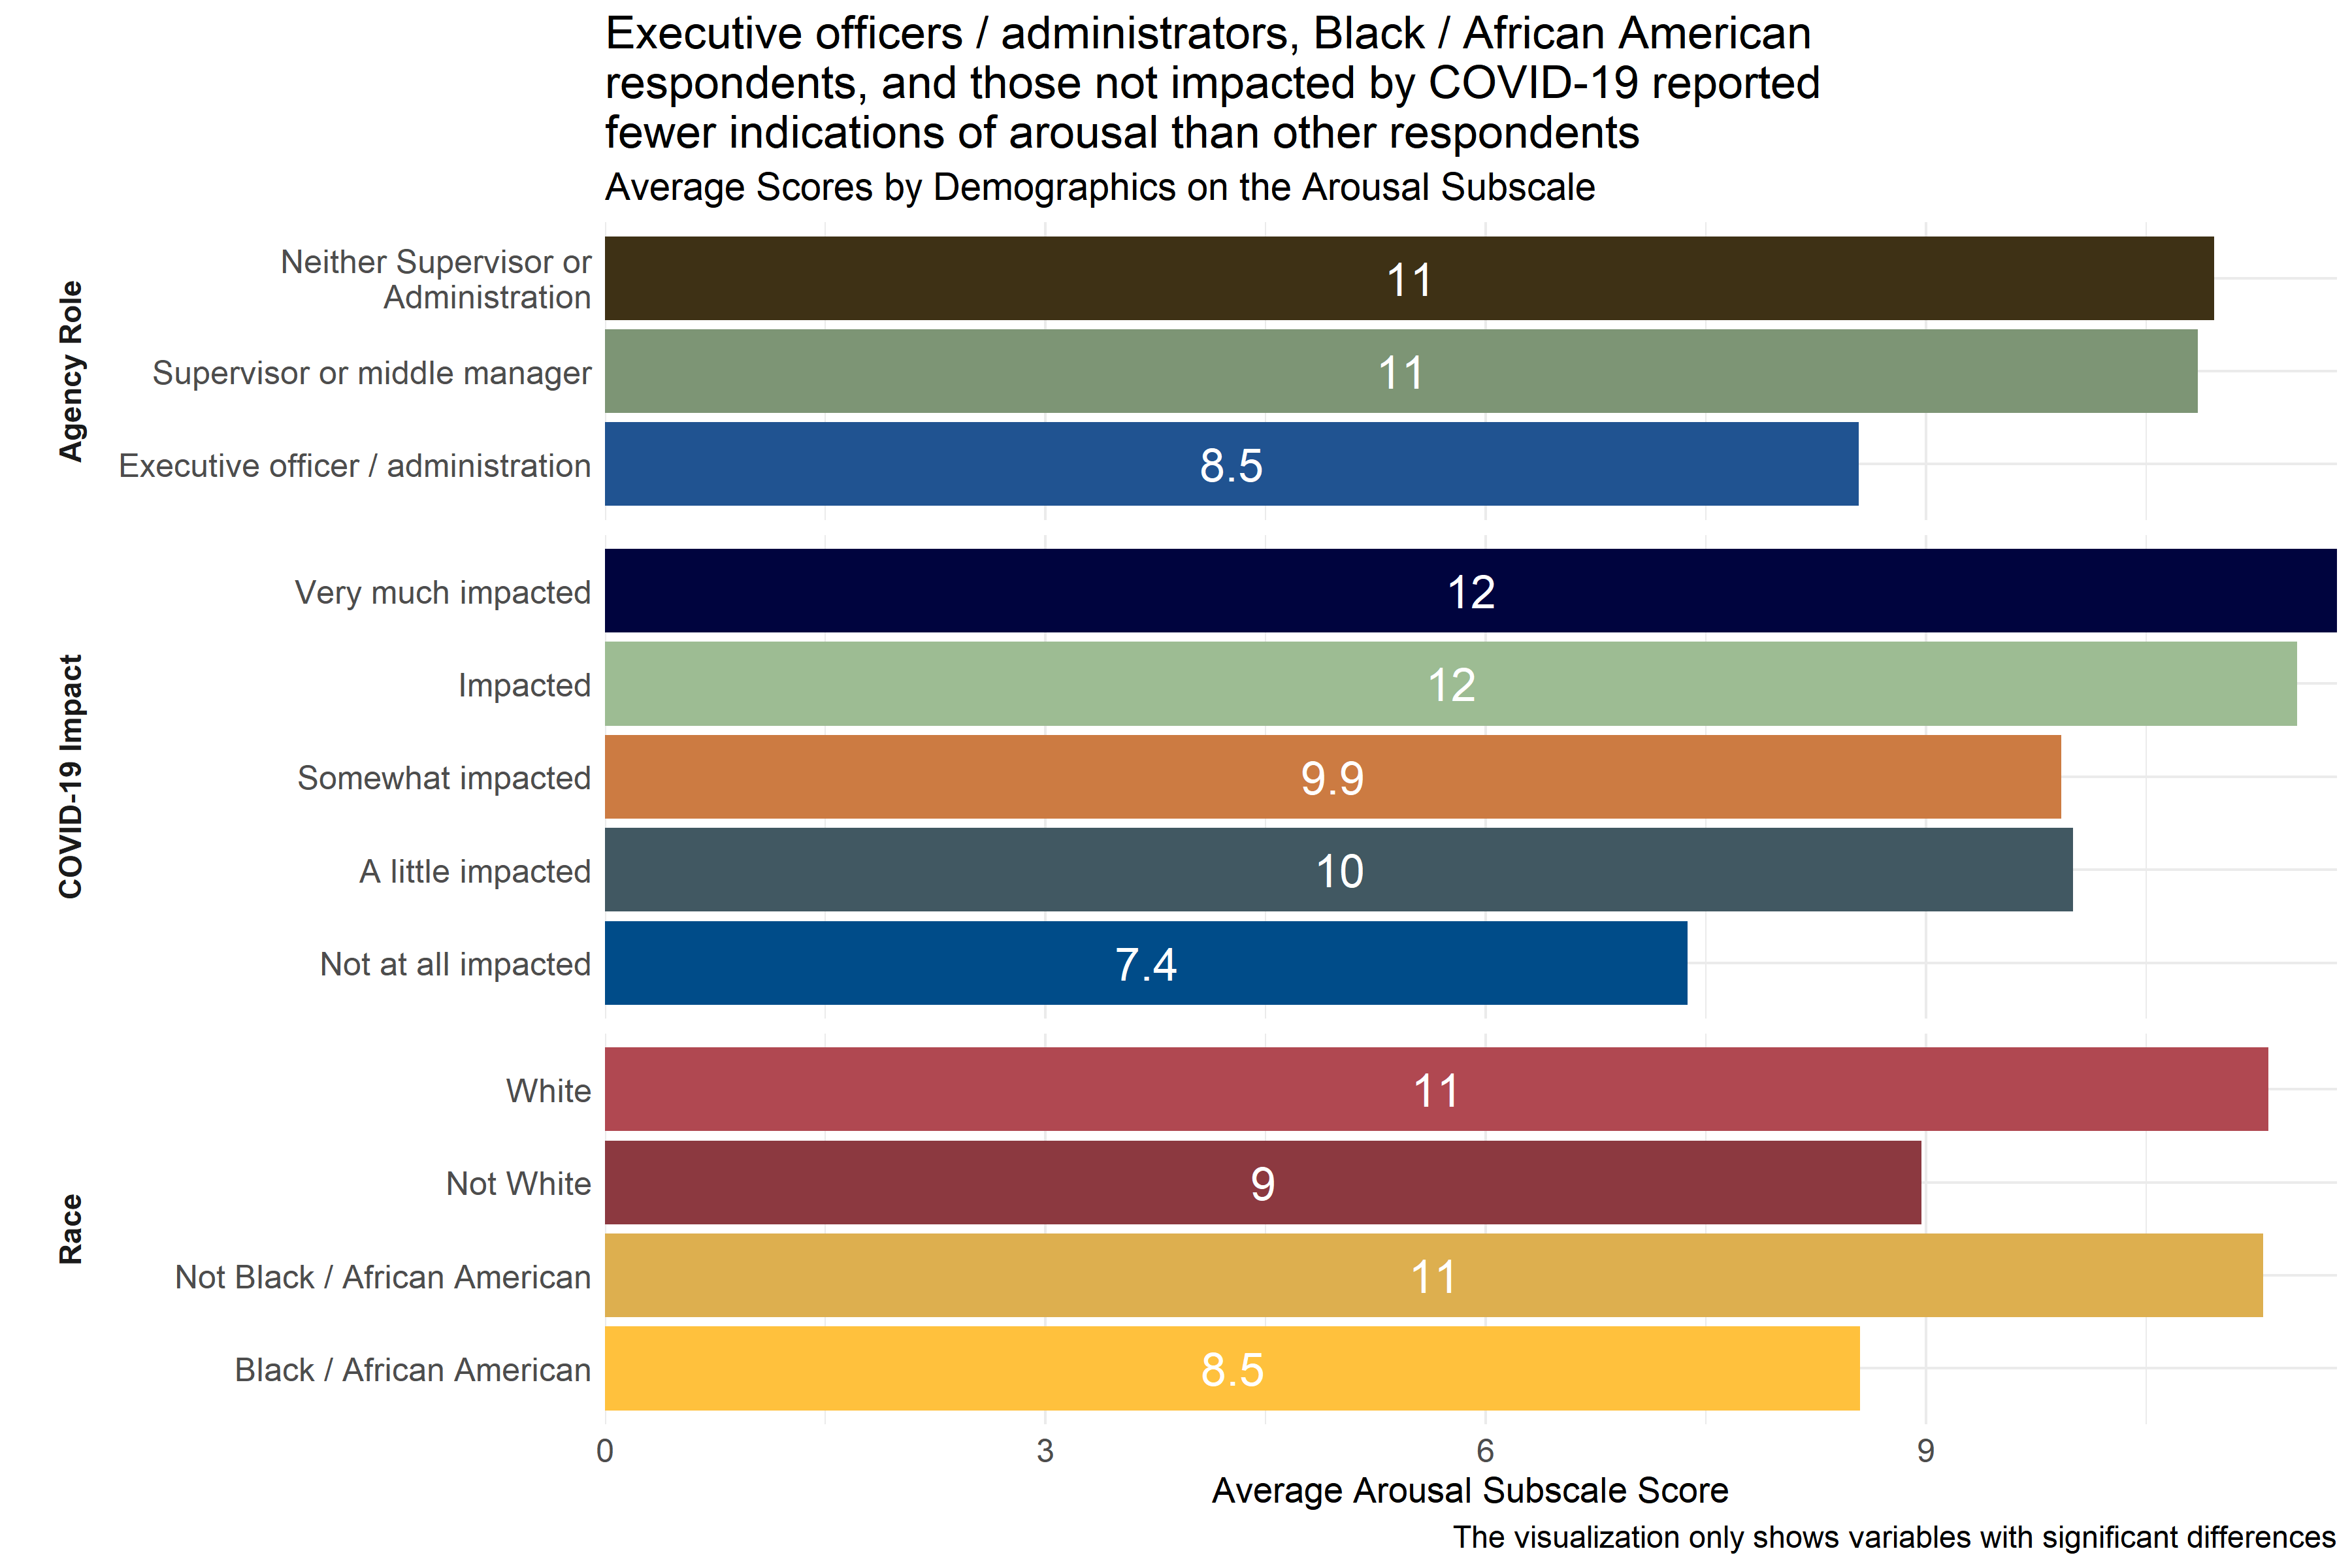
Figure 4.12: Average scores for Arousal Subscale across demographic groups
Analysts tested the average scores on the Arousal Subscale across demographic groups to identify differences in how respondents answered questions about potential symptoms of secondary traumatic stress. As Figure 4.12 shows, executive officers / administrators had lower average scores than respondents in other agency roles, as did respondents who identified themselves as Black / African American or did not identify as White. (Respondents were asked to select racial identities from a list of options and could select more than one.) When compared to respondents who reported experiencing some level of impact from COVID-19, those who reported that they were “not at all impacted” had lower scores on the arousal subscale. This suggests that respondents identifying as executive officers / administrators or as Black / African American and those reporting no impact from COVID-19 are experiencing less arousal.
Analysts also observed significant differences in average scores across agencies, but scores from these specific agencies were not included in Figure 4.12 to protect those agencies’ privacy.
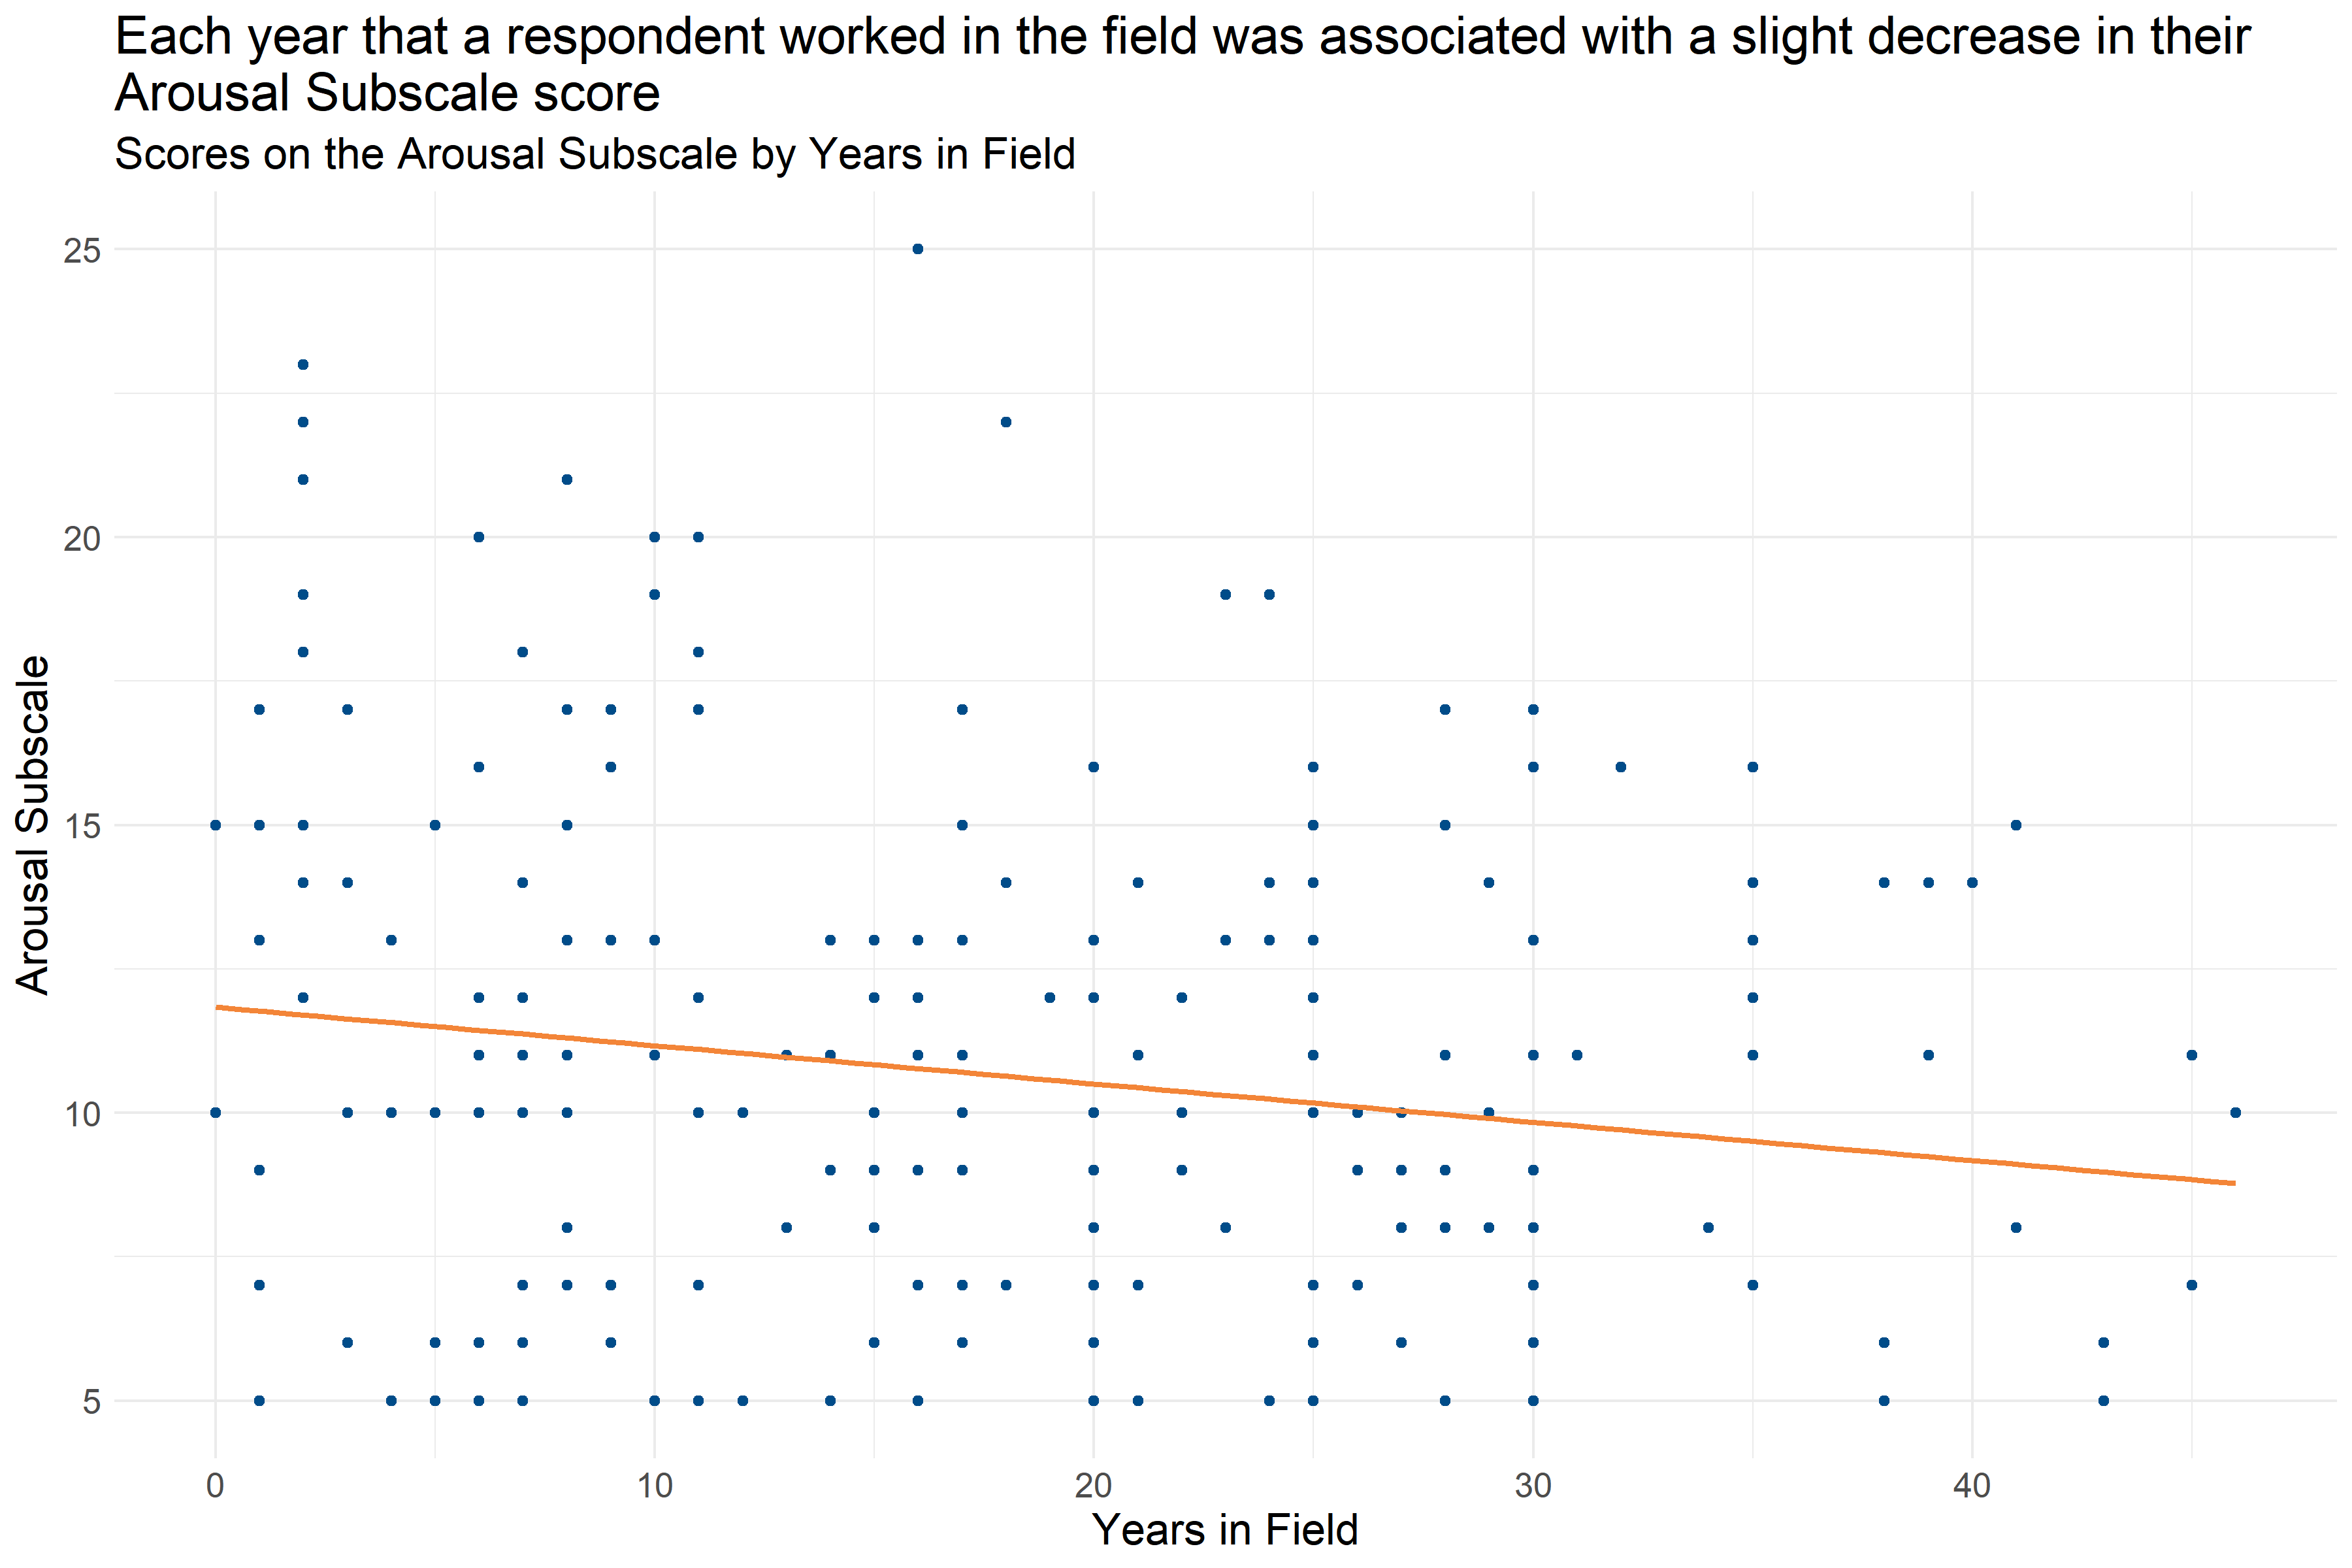
Figure 4.13: Scatter plot of Years in Field and Arousal Subscale Score
Analysts measured Years in Field against the Arousal Subscale to identify patterns between the two variables. As Figure 4.13 displays, as Years in Field increases, there is a slight decline in ratings on the Arousal Subscale.
4.4.2 Conclusions
4.4.2.1 Scores on Secondary Traumatic Stress Scale Subscales
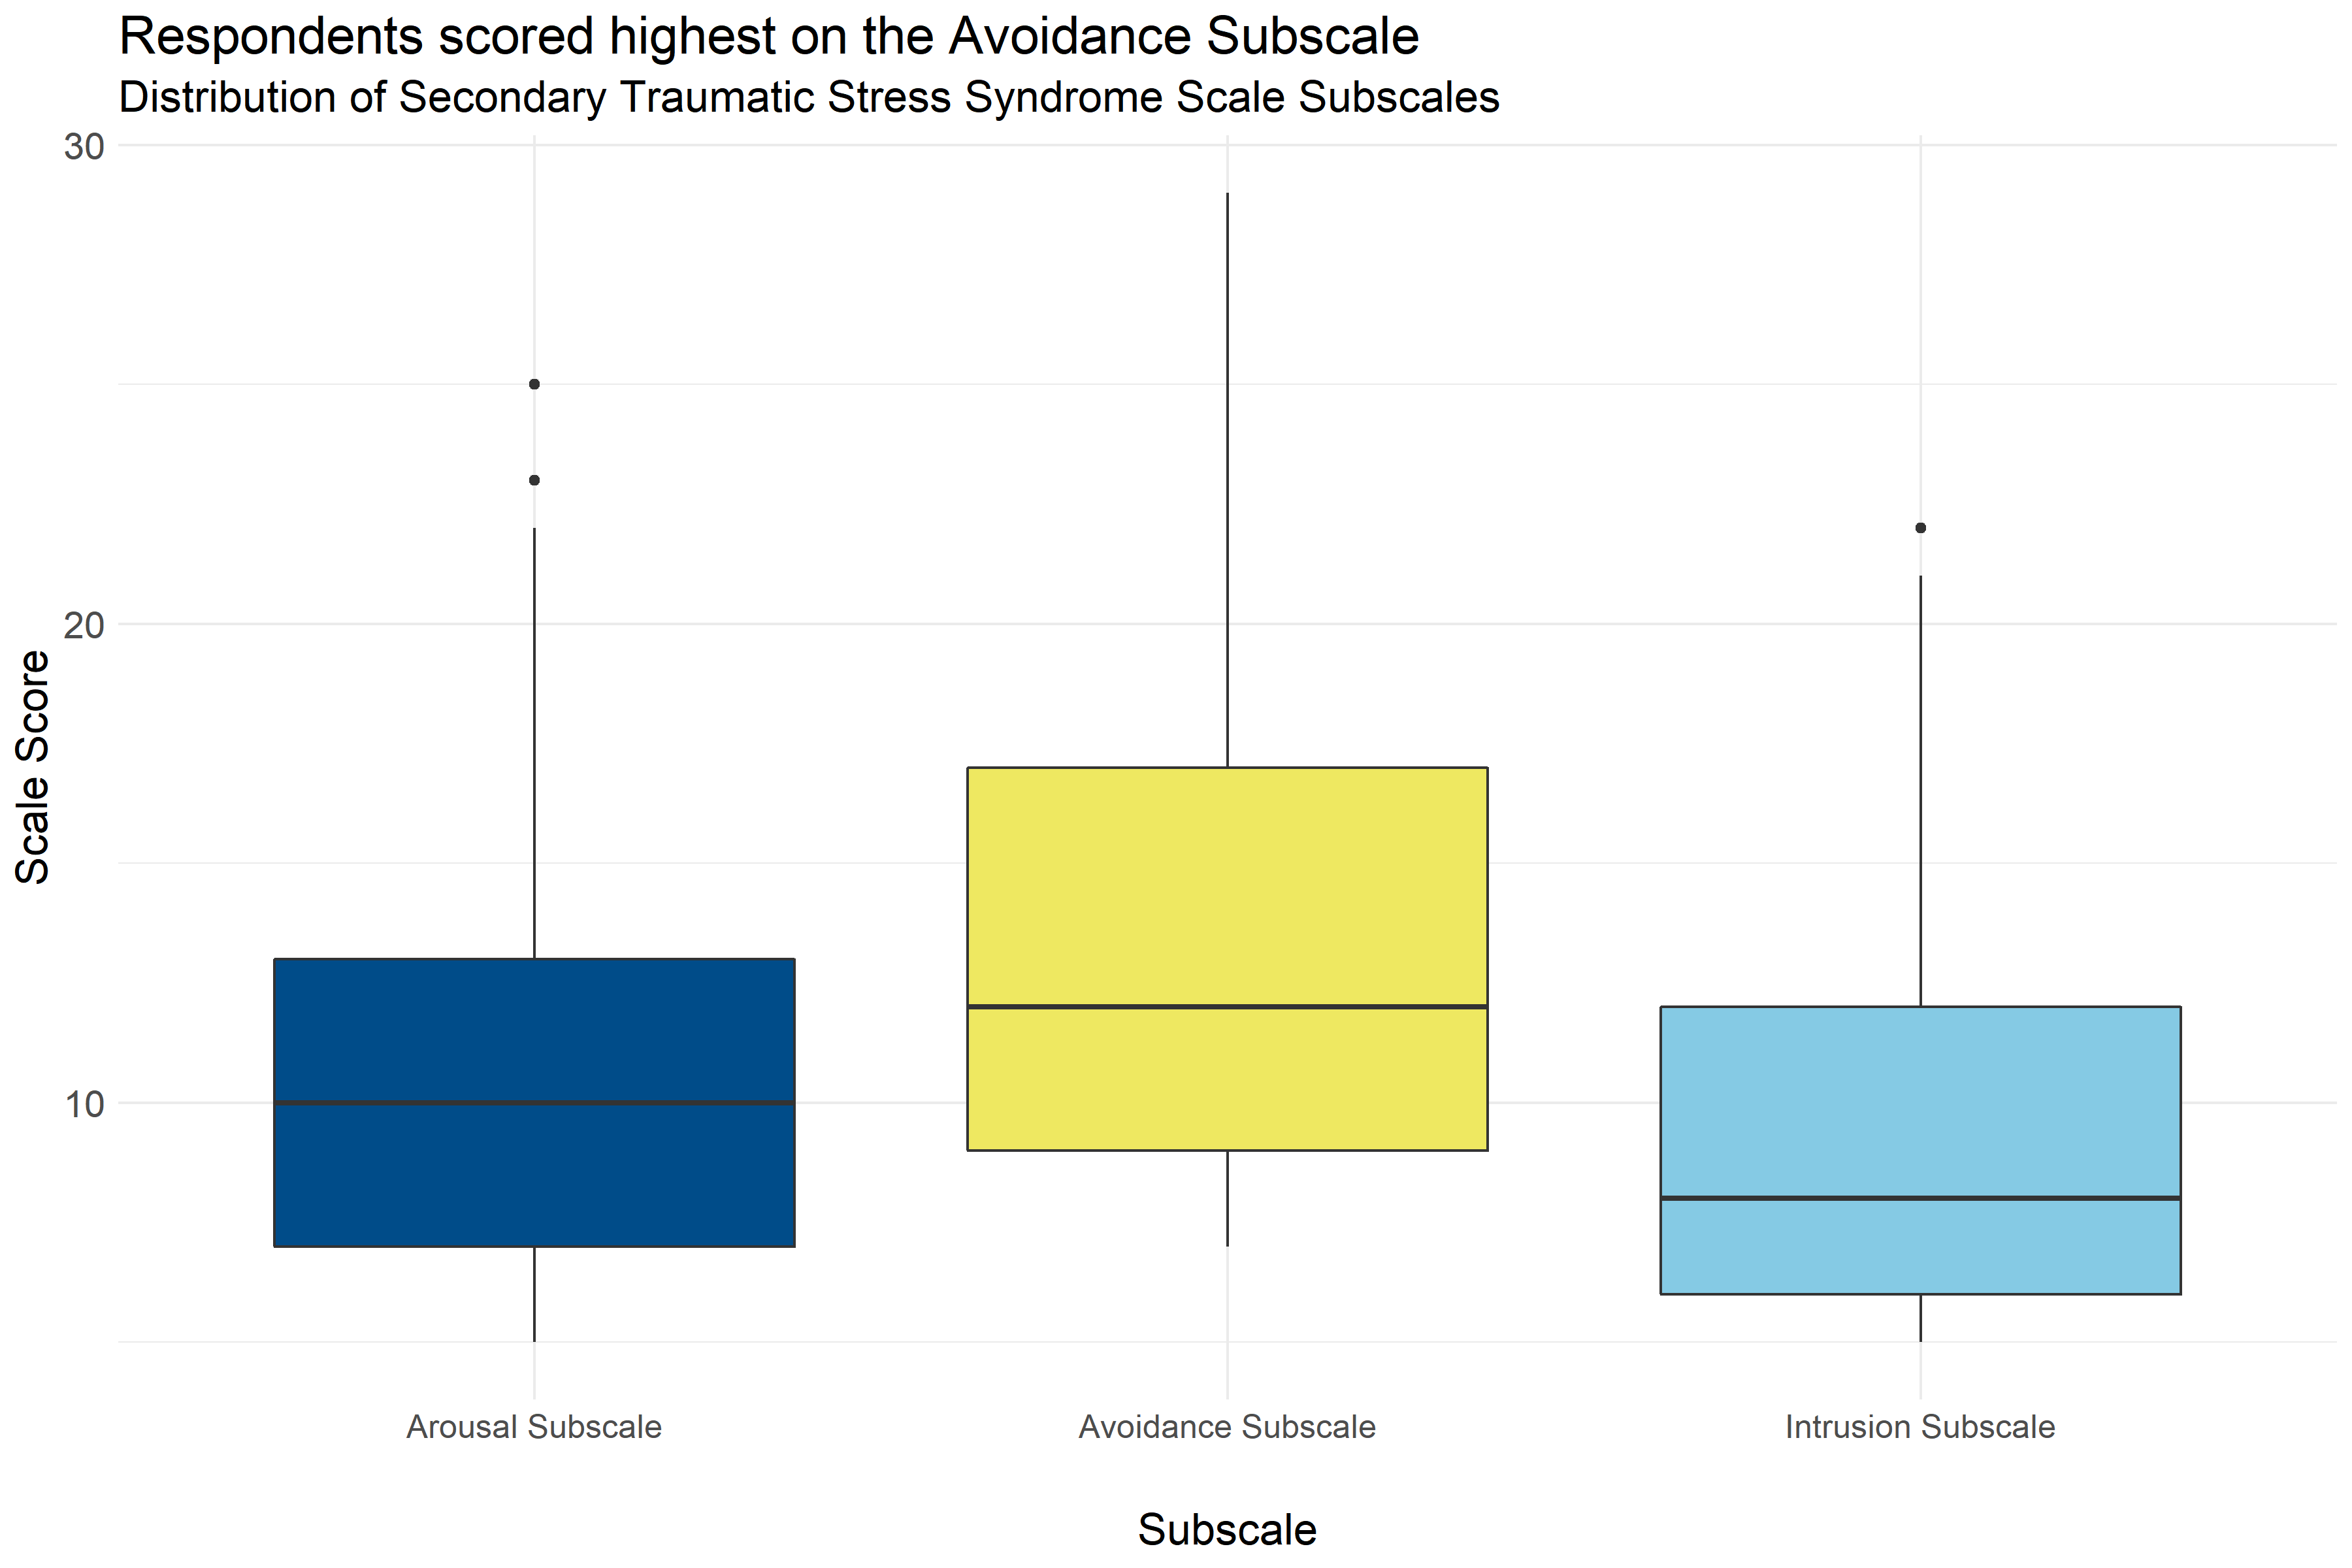
Figure 4.14: Boxplot of score distributions on the Secondary Traumatic Stress Syndrome Scale Subscales
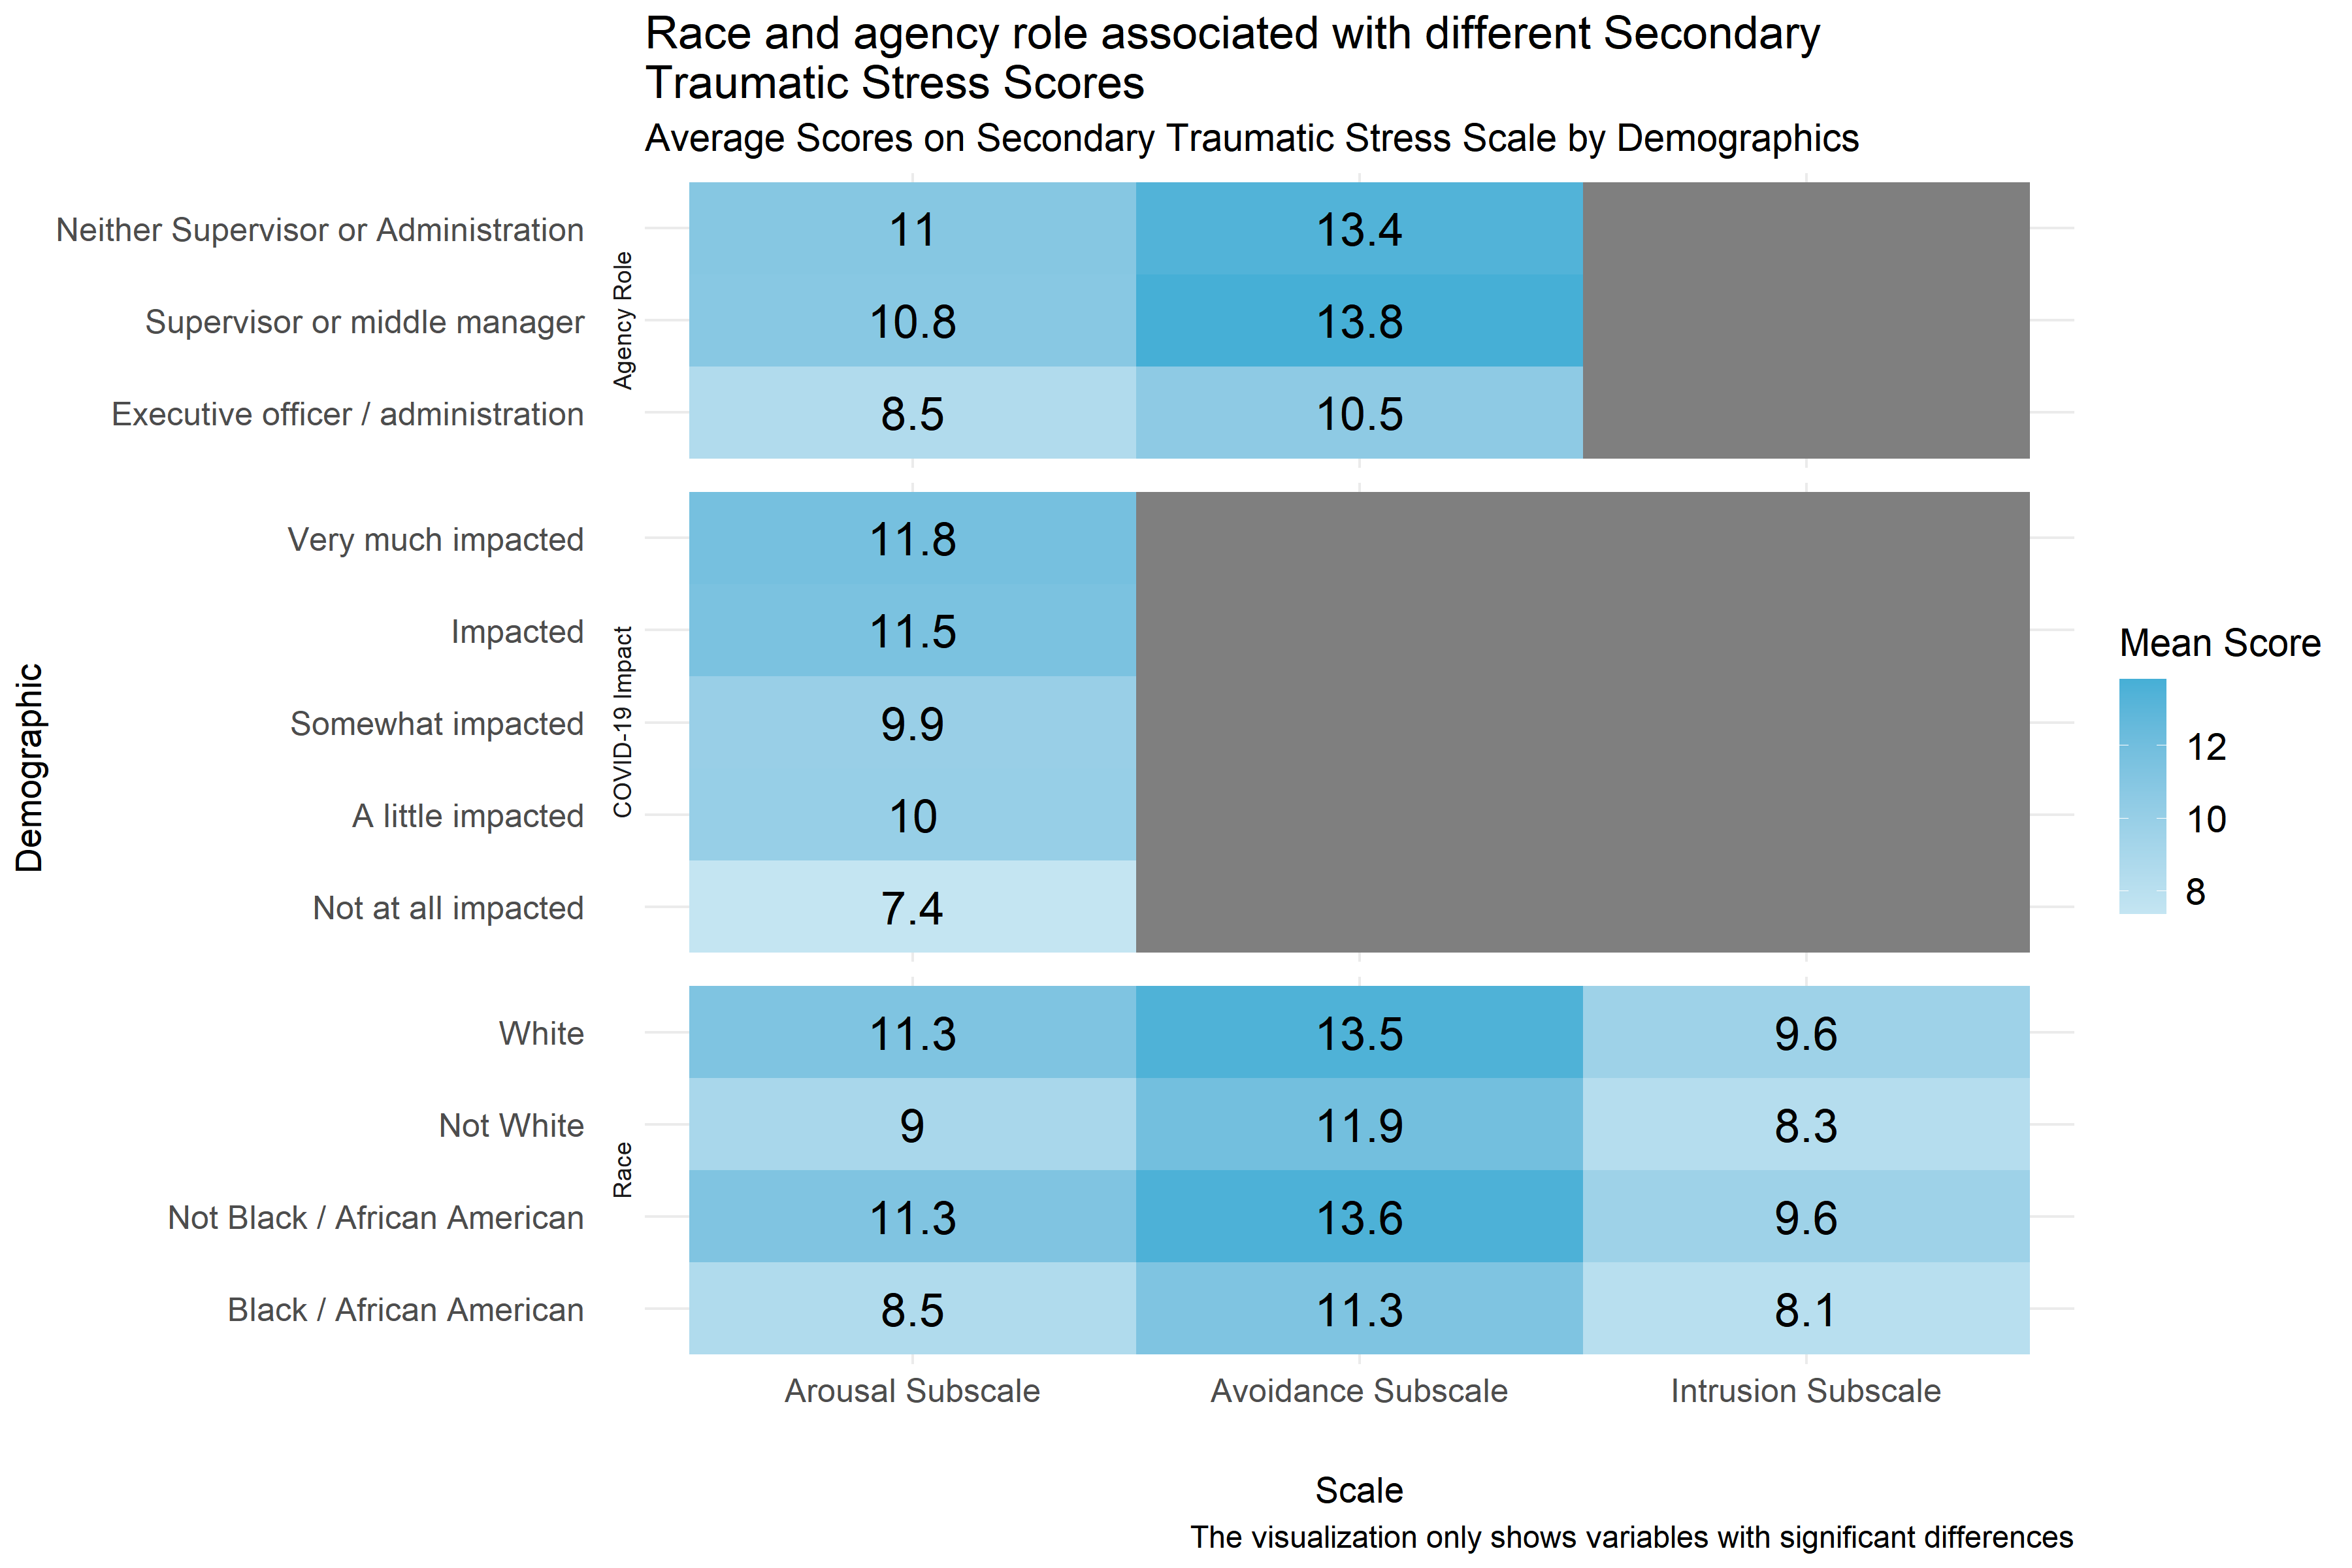
Figure 4.15: Mean score on Secondary Traumatic Stress Subscales by demographic
Figure 4.14 shows the distribution of scores on the Secondary Traumatic Stress Scale’s three subscales: Arousal, Avoidance, and Intrusion. The colored boxes represent the range that the scores of the middle half of respondents fell into. (If you were to cut all of the scores into quarters, this would be between the first and third quartiles.) And, the lines and dots represent the full distribution of scores on each scale. Scales with dots on either side indicate unusually high or low scores. Figure 4.14 shows that of the three subscales, respondents generally scored highest on the Avoidance subscale, but scores on all three scales were generally low. Despite the generally low scores, it is notable that some respondents scored high on these scales indicating that some staff at child-serving agencies may be experiencing symptoms of secondary traumatic stress.
Similarly Figure 4.15 shows the average scores by demographics for all three subscales for all of the demographics for which analysts were able to identify statistically significant differences in scores. Gray boxes indicate that demographic differences for that scale were not statistically significant. Figure 4.15 shows that in addition to having the highest average scores, the Arousal subscale had the most consistent significant differences across different demographic groups, and that there are consistent racial differences in scores across all three subscales. Respondents identifying themselves as White and respondents not identifying themselves as Black / African American consistently scored higher than those not identifying themselves as White and those identifying as Black / African American on all three scales. Respondents who identified their agency roles as being executive officers and administrators also consistently scored lower than other respondents on both the Arousal and Avoidance Subscales. It also worth noting that respondents reporting that they were not at all impacted by COVID-19 reported lower scores on the Arousal Subscale. Analysts also noted significant differences between specific agencies across all three subscales, but those scores are not included in Figure 4.15 to protect the privacy of those respondents and agencies.
Lastly, the number of years that respondents reported working in the field was only significantly associated with the Arousal Subscale, in which it was associated with a slight decrease (about one point decrease per every ten years of experience) as can be seen in Figure 4.13, and years spent at a particular agency were not associated with any of the subscales.
4.4.2.2 Important Considerations
These demographic breakdowns only compare scores by demographics considering one demographic at a time. In cases where these demographics may be interrelated (for example, executive officers and administrators also having more experience than other staff or agencies having different racial demographics) it is not possible to know from this analysis what those differences would look like if those relationships were controlled for (for example, looking at agency role while controlling for years of experience). It is possible that some of these differences in scores are actually the result of other demographic differences, even differences not measured in this analysis.
Additionally, this data is based on a survey that respondents volunteered to take across a variety of fields. There could be ways that the people who volunteered to take the survey are different than other people who work in child-serving agencies. And, because smaller differences between groups are easier to see with a higher number of survey responses, it is possible that there are other differences that exist across demographics that analysts would be able to measure with a larger group of respondents.
4.4.2.3 Implications
Despite that fact that most scores on the Secondary Traumatic Stress Scale were relatively low, some staff scored highly on the subscales indicating that some respondents may be experiencing symptoms of secondary traumatic stress syndrome. It is essential for planners to be mindful that those not describing themselves as executive officers and administrators and individuals who have not worked in the field long, on the aggregate, are likely to score higher on the Secondary Traumatic Stress Scales, and may need more assistance in their current roles.
4.5 Current Implementation of Trauma Informed Practices
4.5.1 Introduction
This section includes survey results on the current implementation of trauma-informed practices within local human service organizations and institutions. There are three subsections included within the current implementation section of trauma-informed practices which are:
- the level of familiarity with trauma-informed practices by survey respondents;
- An environmental assessment; and
- Staff practices.
4.5.2 Key Findings
- About 72% of respondents in child-serving agencies were not familiar with the TRC model, and an additional 26% of respondents reported familiarity with the model but no training.
- Respondents with higher levels of training generally scored higher on the staff practices survey, indicating higher levels of alignment with trauma-informed care practice at their agencies.
- Scores on the Environmental Assessment scale and Staff Practices Survey generally showed neutral to moderate alignment with Trauma informed practice. Some respondents had lower scores, particularly on the Environmental Assessment and some subscales of the staff practices survey. This suggests that there may be variation across agencies or staff.
- Organizational leaders often had higher scores than other employees on the Environmental Assessment Scale and Staff Practices Survey. Interview participants indicated that there has been a greater sense of urgency for racial equity-based work within the past few years, suggesting that organizations and staff are responsive to the socio-political landscape (e.g., COVID-19, George Floyd protests, etc).
- Some interview respondents identified that engaging in more racial equity-based work is an area of growth in their organization. There were more instances reported of organizations lacking equity-based policies and practices than having such measures in place.
- Some organizations prioritize diversity of staff over diversity of leadership in order to match the populations they serve. In these cases, there can be less diversity in leadership, reflecting the lack of an employee pipeline within the organization for people of color.
- Some organizations have sufficient resources to engage in racial equity-based practices and policies, while others face barriers such as leadership, funding, and/or staff buy-in.
- Respondents report that, in general, their organization’s culture is inclusive and supportive of people from diverse backgrounds, however several respondents indicated that there is an expectation for people of color to assimilate into dominant white norm culture.
- The COVID-19 pandemic not only affected how community service providers served the community, but it also added extra personal and professional stressors and trauma.
- Many organizations serve members of the community who have experienced structural violence, which suggests that there are many adverse experiences that the community encounters which can compound pre-existing trauma or lead to new forms of stress and trauma.
4.5.3 Familiarity with Trauma Informed Practices
This section includes survey results about staff familiarity with trauma-informed practices. The survey included a question that asked the respondent “Which of the following BEST describes your current experience with the TRC Model?” with the following response options:
- I am not familiar with the TRC Model
- I am familiar with the TRC Model and have not attended any presentations or participated in any training activities
- I am in the process of participating in TRC staff training modules I have attended and completed the 3-day TRC leadership training
- I have attended and completed the 5-day TRC Train-the-Trainer training
4.5.3.1 Key Findings
- About 72% of respondents in child-serving agencies were not familiar with the TRC model, and an additional 26% of respondents reported familiarity with the model but no training.
- A small percentage of respondents reported that they were in the process of attending staff training modules.
- Respondents in lower-earning positions and respondents who were not in supervisory or administrative roles generally reported lower levels of familiarity with the model.
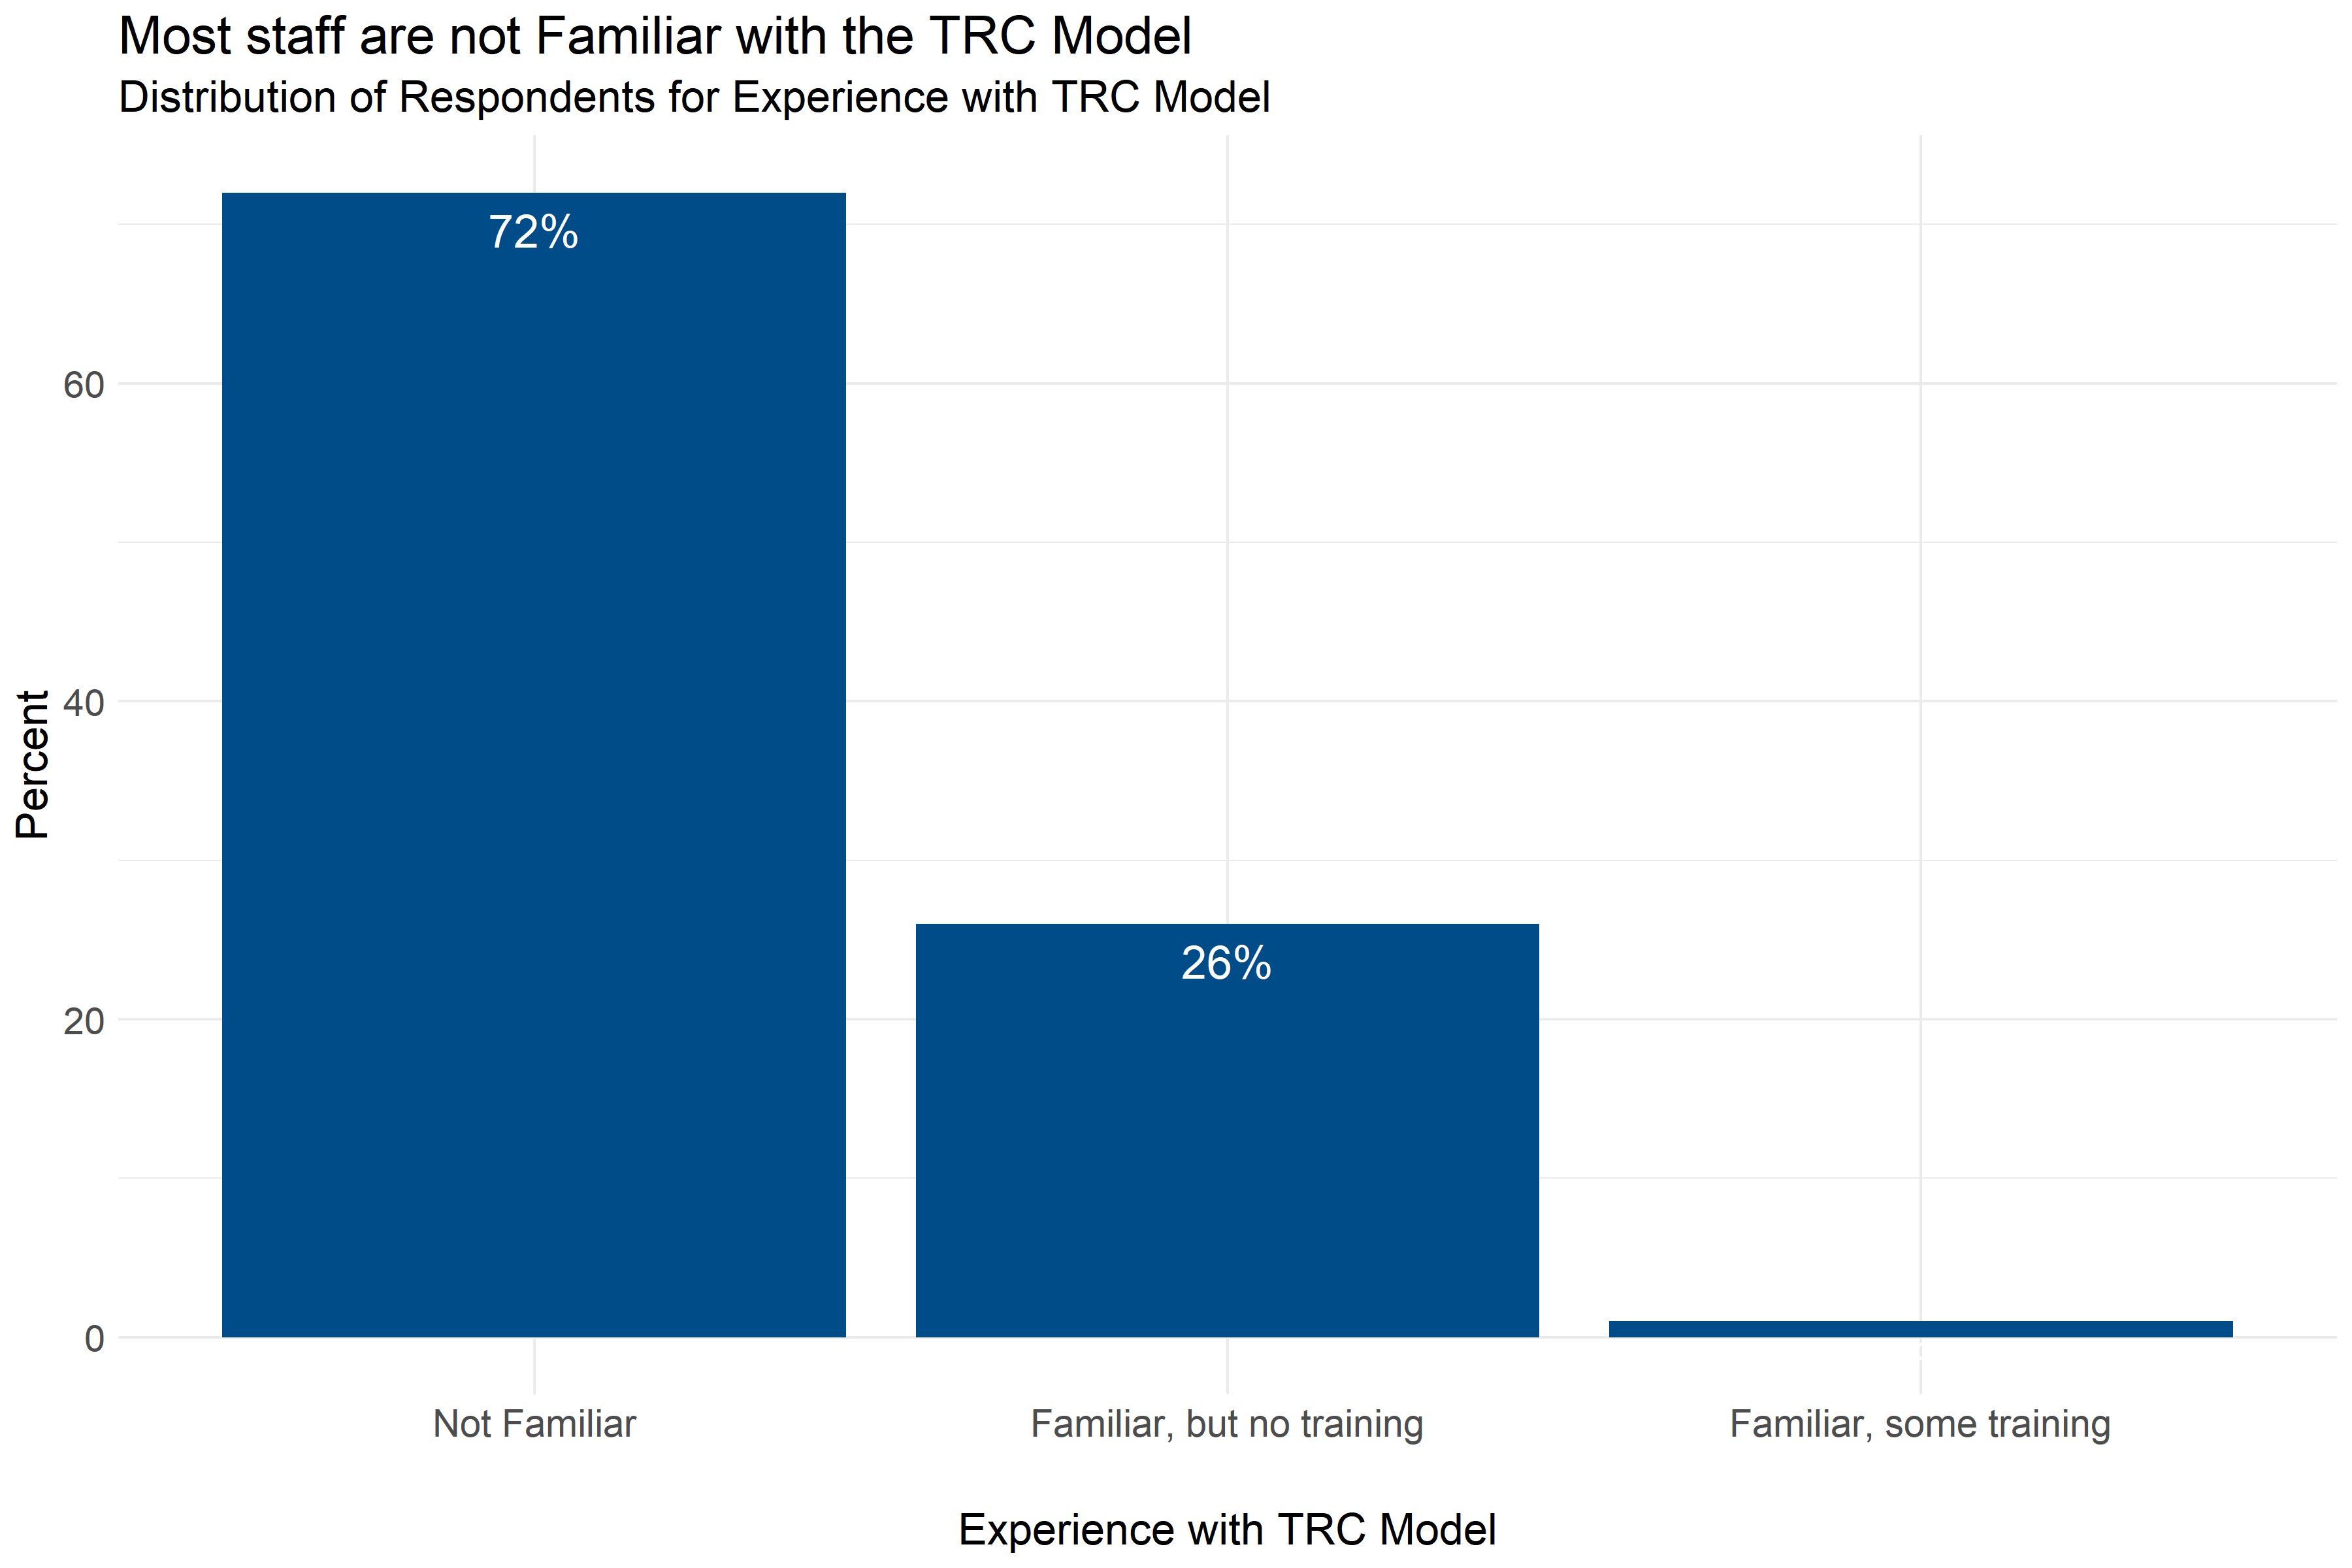
Figure 4.16: Distribution of responses about level of experience with the TRC Model
Figure 4.16 shows that most respondents, 72%, were not familiar with the TRC Model, and an additional 26% of respondents reported being familiar with the TRC Model but not having any training. However, a small percentage of respondents indicated that they were in the process of participating in TRC staff training modules.
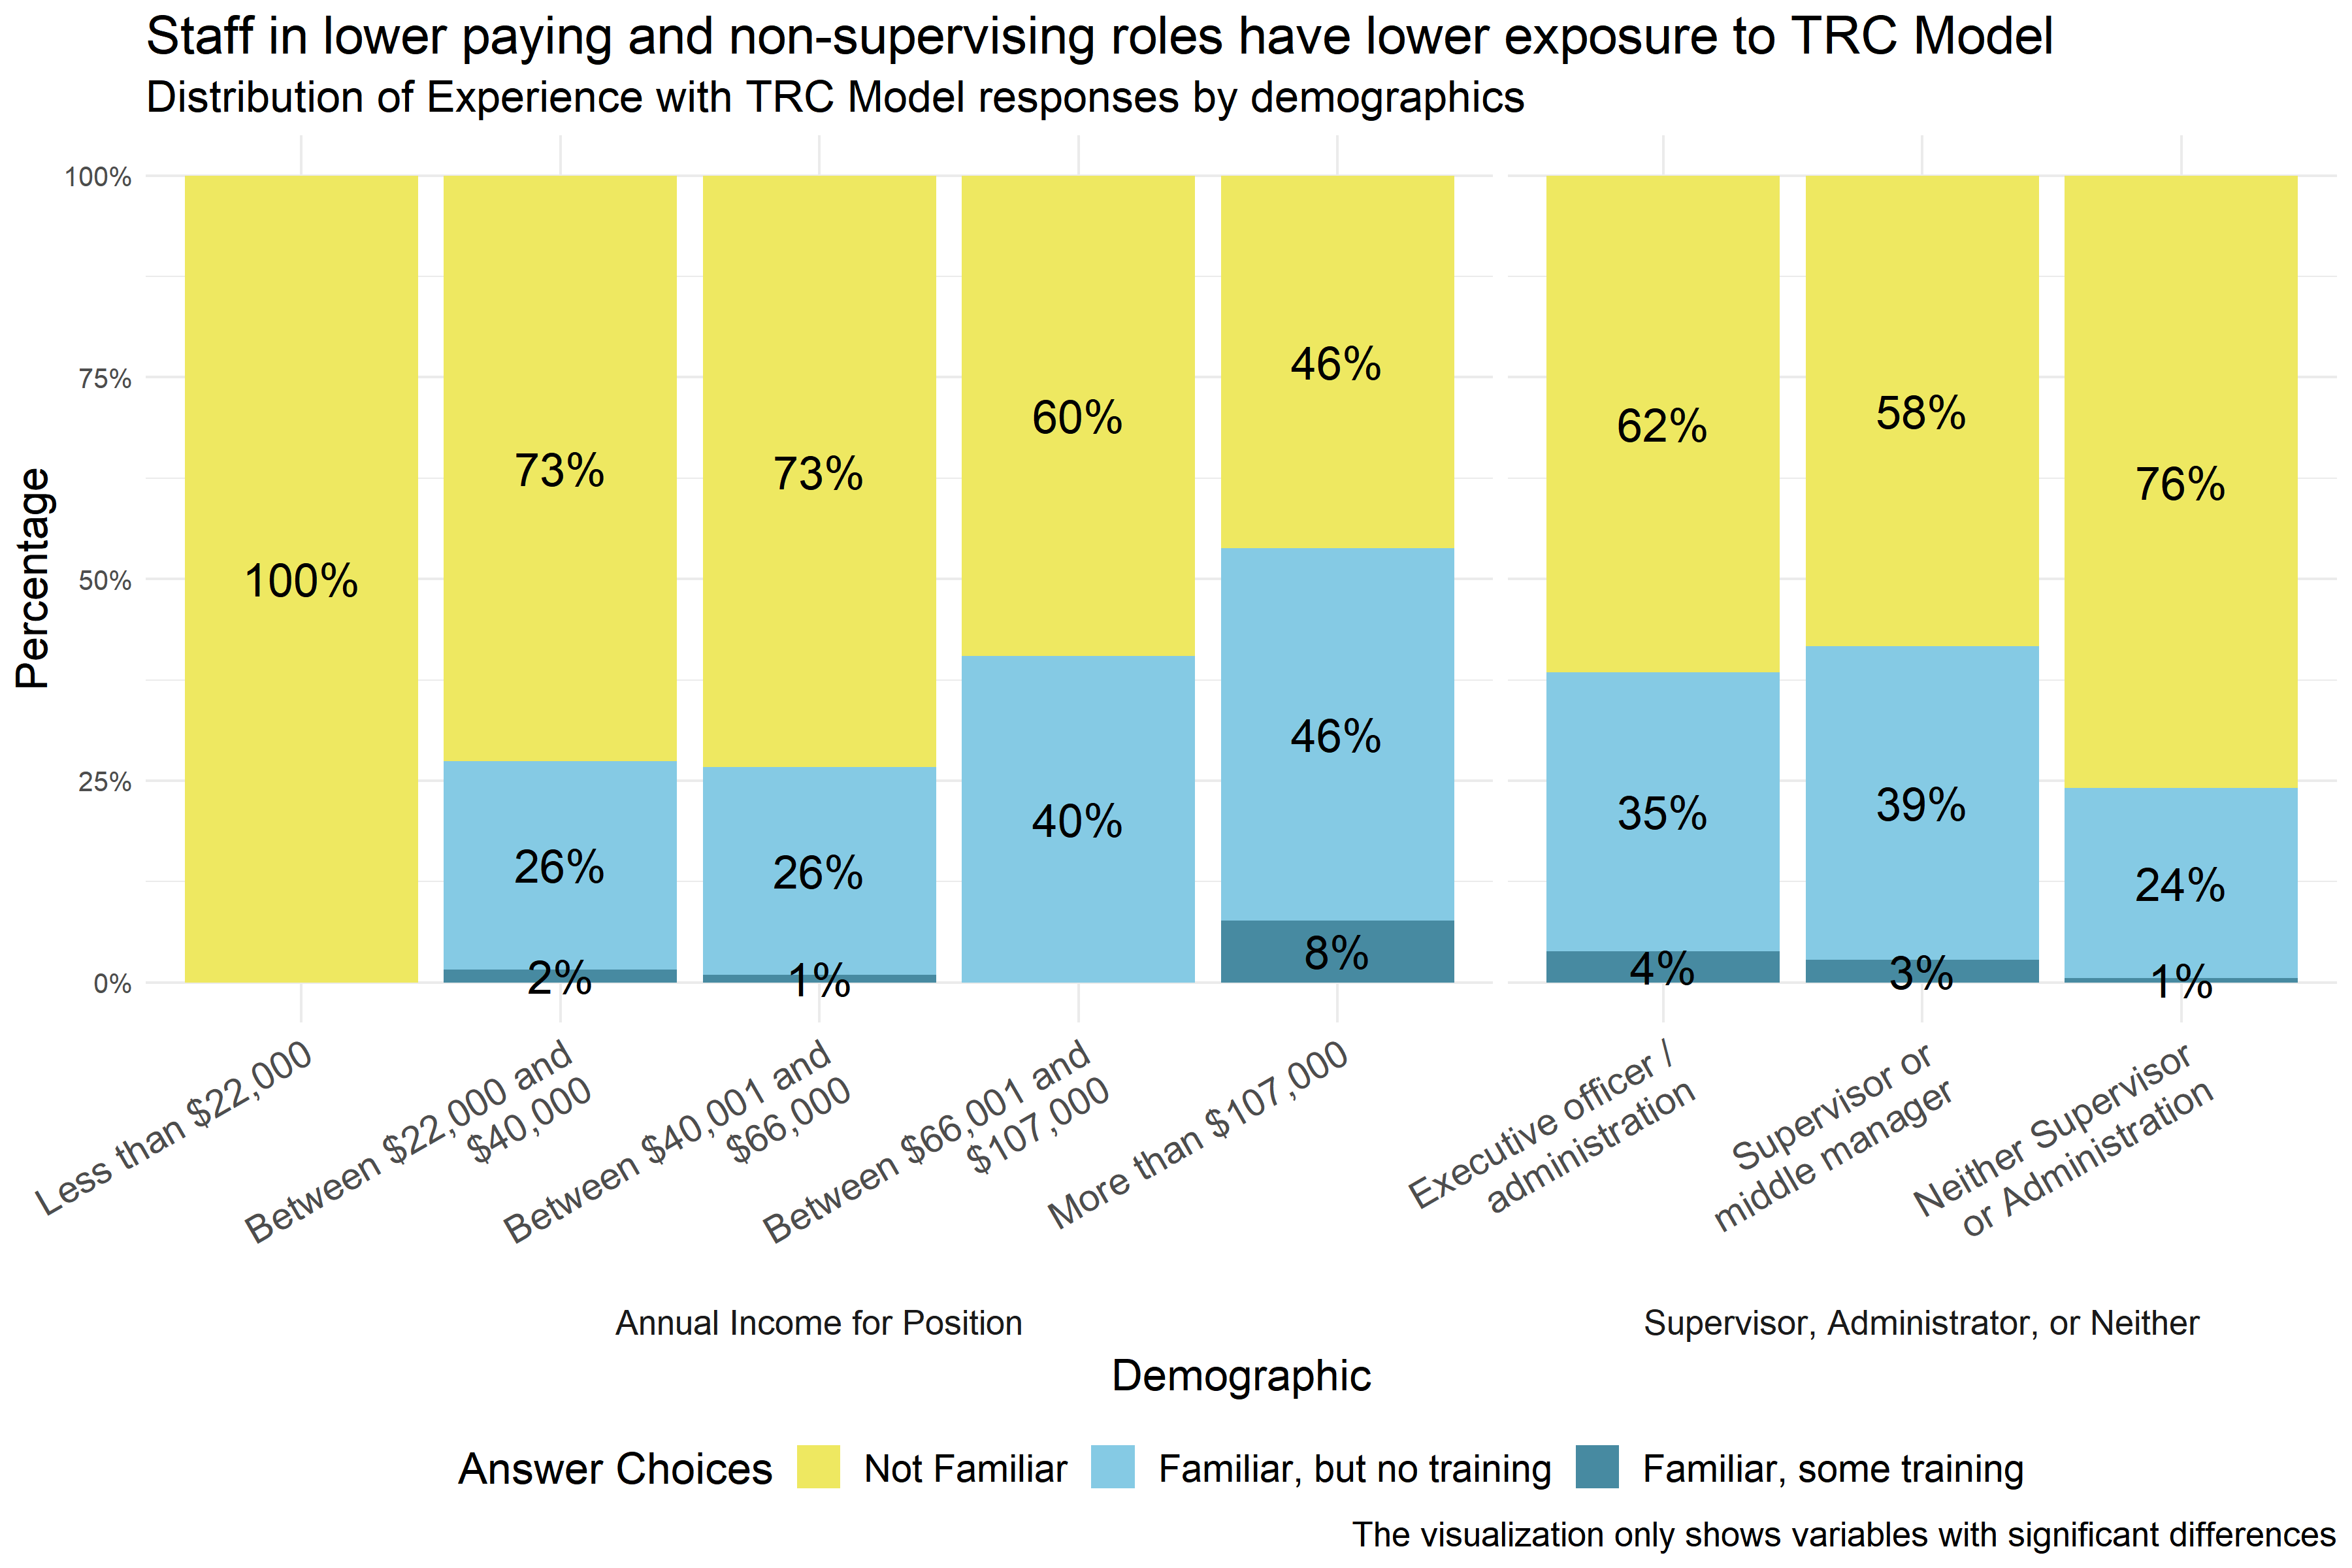
Figure 4.17: Level of experience with the TRC Model reported by demographic
Analysts found significant differences in respondents’ level of experience with the TRC Model across respondents in positions with different levels of annual income, different roles in the agency, and different agencies. Figure 4.17 shows that respondents with lower annual incomes and respondents who are not supervisors or administrators generally had less exposure to the TRC Model. Even among executive officers, administrators, supervisors, and middle managers more than half of all respondents indicated that they were not familiar with the TRC Model, and even at the highest levels of annual income, more than $107,000, almost half of respondents did not have exposure to the TRC Model. The small percentage of respondents who reported that they were in the process of attending TRC training modules were mostly in higher-income positions or positions of leadership. Analysts also found significant differences across specific agencies, but that data is not shown in Figure 4.17 to protect the privacy of the respondents and the agencies.
4.5.3.2 Conclusions
4.5.3.2.1 Important Considerations
Demographic breakdowns only compare scores by demographics considering one demographic at a time. In cases where these demographics may be interrelated (for example, executive officers and administrators also having higher incomes) it is not possible to know from this analysis what those differences would look like if those relationships were controlled for (for example, looking at agency role while controlling for income). It is possible that some of these differences in scores are actually the result of other demographic differences, even differences not measured in this analysis.
Additionally, this data is based on a survey that respondents volunteered to take across a variety of fields. There could be ways that the people who volunteered to take the survey are different from other people who work in child-serving agencies. And, because smaller differences between groups are easier to see with a higher number of survey responses, it is possible that there are other differences that exist across demographics that analysts would be able to measure with a larger group of respondents.
4.5.3.2.2 Implications
Implementation of a TRC Model should not assume wide-spread exposure to or knowledge of the TRC Model, especially among lower-earning staff members and employees who are not supervisors or administrators. If widespread familiarity with the TRC Model is the goal, training is needed across all positions and agencies.
4.5.4 Environmental Assessment Survey
This section includes survey results from the environmental assessment scale, which includes questions about the physical environment - questions about the physical work space - and the social environment - questions about relationships and how people feel and are treated - as well as the seven commitments of the Trauma Informed Care (TIC) model. The TRC model promotes organizational change and addresses the ways in which chronic stress, adversity, and trauma influence individual behavior. It also recognizes the ways in which whole organizations can be influenced by chronic stress, adversity, and trauma. The seven commitments are as follows: Non-Violence, Emotional Intelligence, Social Learning, Shared Governance, Open Communication, Social Responsibility, and Growth and Change.
4.5.4.1 Key Findings
- Scores on the Environmental Assessment scale were generally high, with the General Social Environment subscale generally having the highest scores.
- About a quarter of respondents generally gave responses ranging from neutral to negative on the commitment to open communication, shared governance, emotional intelligence, social learning, and social responsibility scale. Given the range of responses, it is possible that some individual agencies tend to have lower scores on these scales.
- When there were differences between groups, executive directors and administrators, child care providers, and part-time employees consistently scored higher on Environmental Assessment Scale subscales than full-time employees and staff in other organizational roles or fields.
- Scores on the Environmental Assessment scale were generally between neutral and moderately aligned with a trauma-informed model, with the General Social Environment subscale generally having the highest scores.
- When there were differences between groups, executive directors and administrators, child care providers, and part-time employees consistently scored higher on Environmental Assessment Scale subscales than full-time employees and respondents in other roles or fields.
4.5.4.2 Physical Environment
The Physical Environment Subscale of the Environmental Assessment Survey measures how employees responded to questions about their physical environment. Respondents answered on a five point scale with options ranging from “Strongly disagree” to “Strongly agree” to statements like, “There is enough community space for gathering with seating that can become a circle.” Individual responses to each of the questions in this scale can be found in Appendix B: Detailed Question Responses by Scale. Lower scores on this scale indicate a more negative physical environment, and higher scores indicate a more positive physical environment.
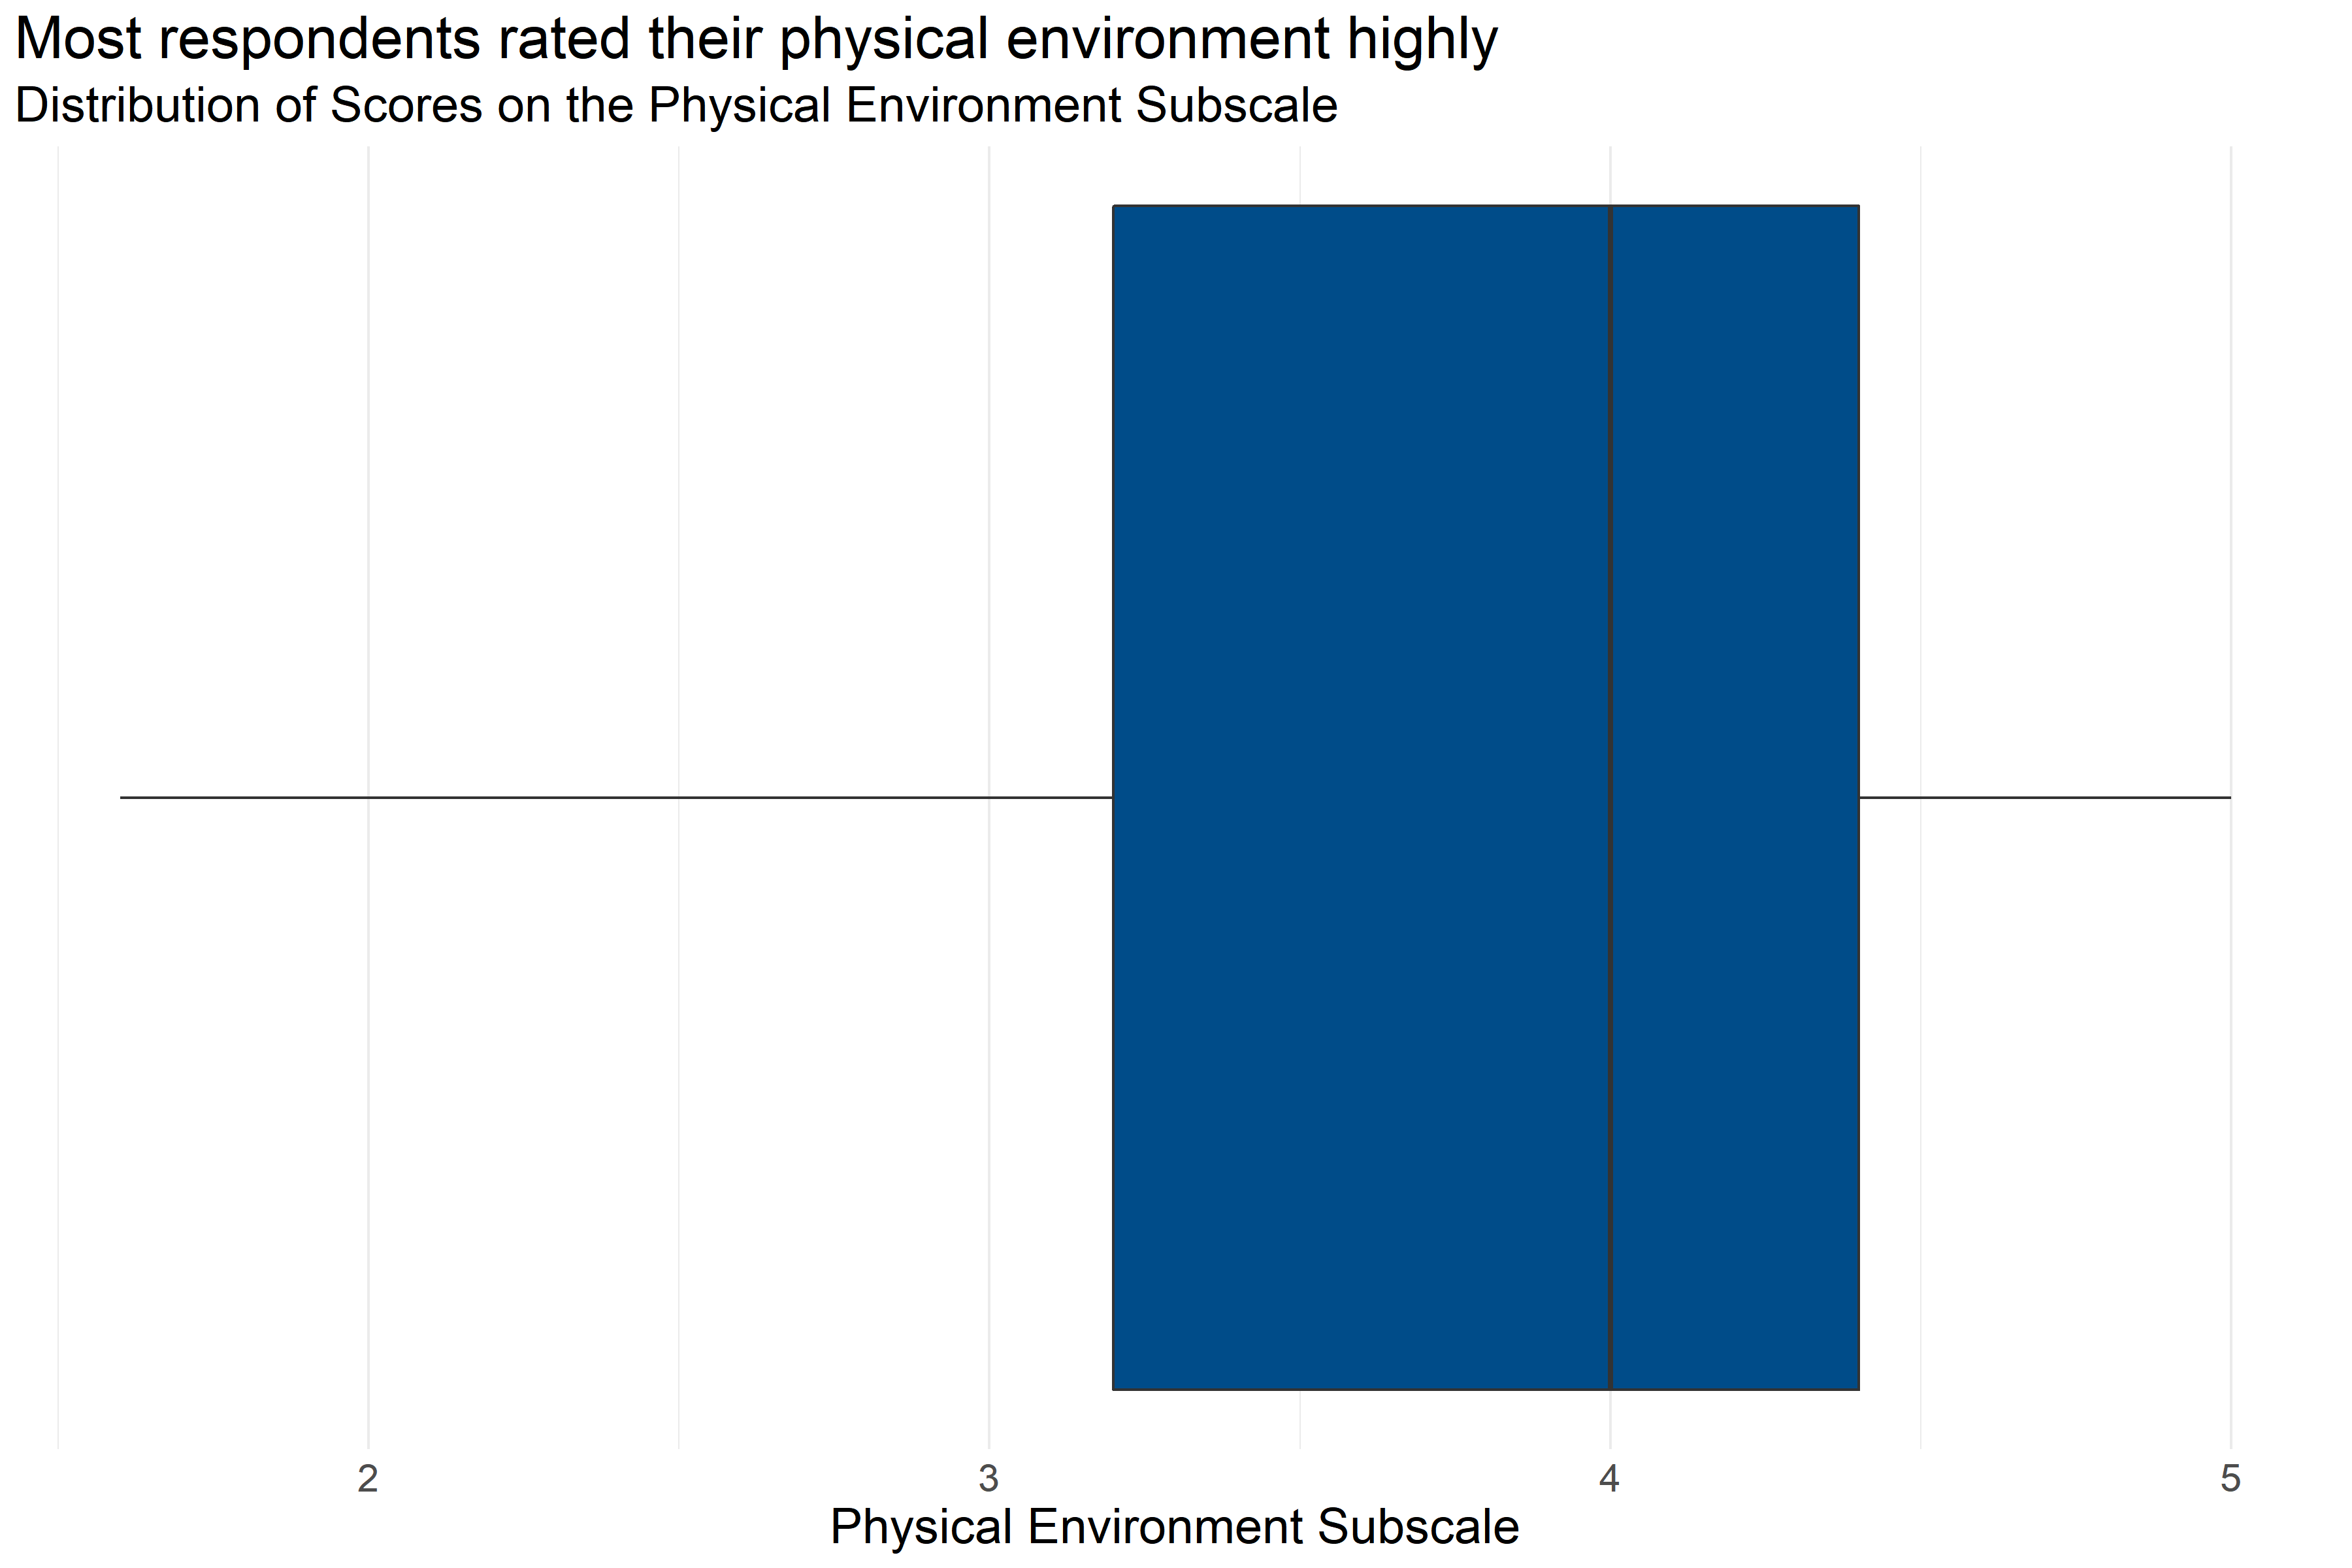
Figure 4.18: Boxplot of score distributions for the Physical Environment Subscale
| Number of Answers | Average Score | Lowest Score | First Quartile | Median | Third Quartile | Highest Score |
|---|---|---|---|---|---|---|
| 220 | 3.79 | 1.6 | 3.2 | 4 | 4.4 | 5 |
Figure 4.18 and Table 4.25 provide information about how respondents scored on the Physical Environment Subscale. They provide the following information:
- Response: 220 respondents answered all questions in the scale.
- Average: The average score was 1.6.
- Range: Scores ranged from 3.79 to 5.
- Median: About half of respondents scored below 4 and half scored above 4.
- Interquartile Range: If the range of responses were cut into quarters, the middle half of respondents (between the first and third quartiles) scored between 3.2 and 4.4.
This means that more than half of respondents generally answered that they agreed or strongly agreed with statements about their physical environment while on the job that were consistent with a Trauma Informed Model.
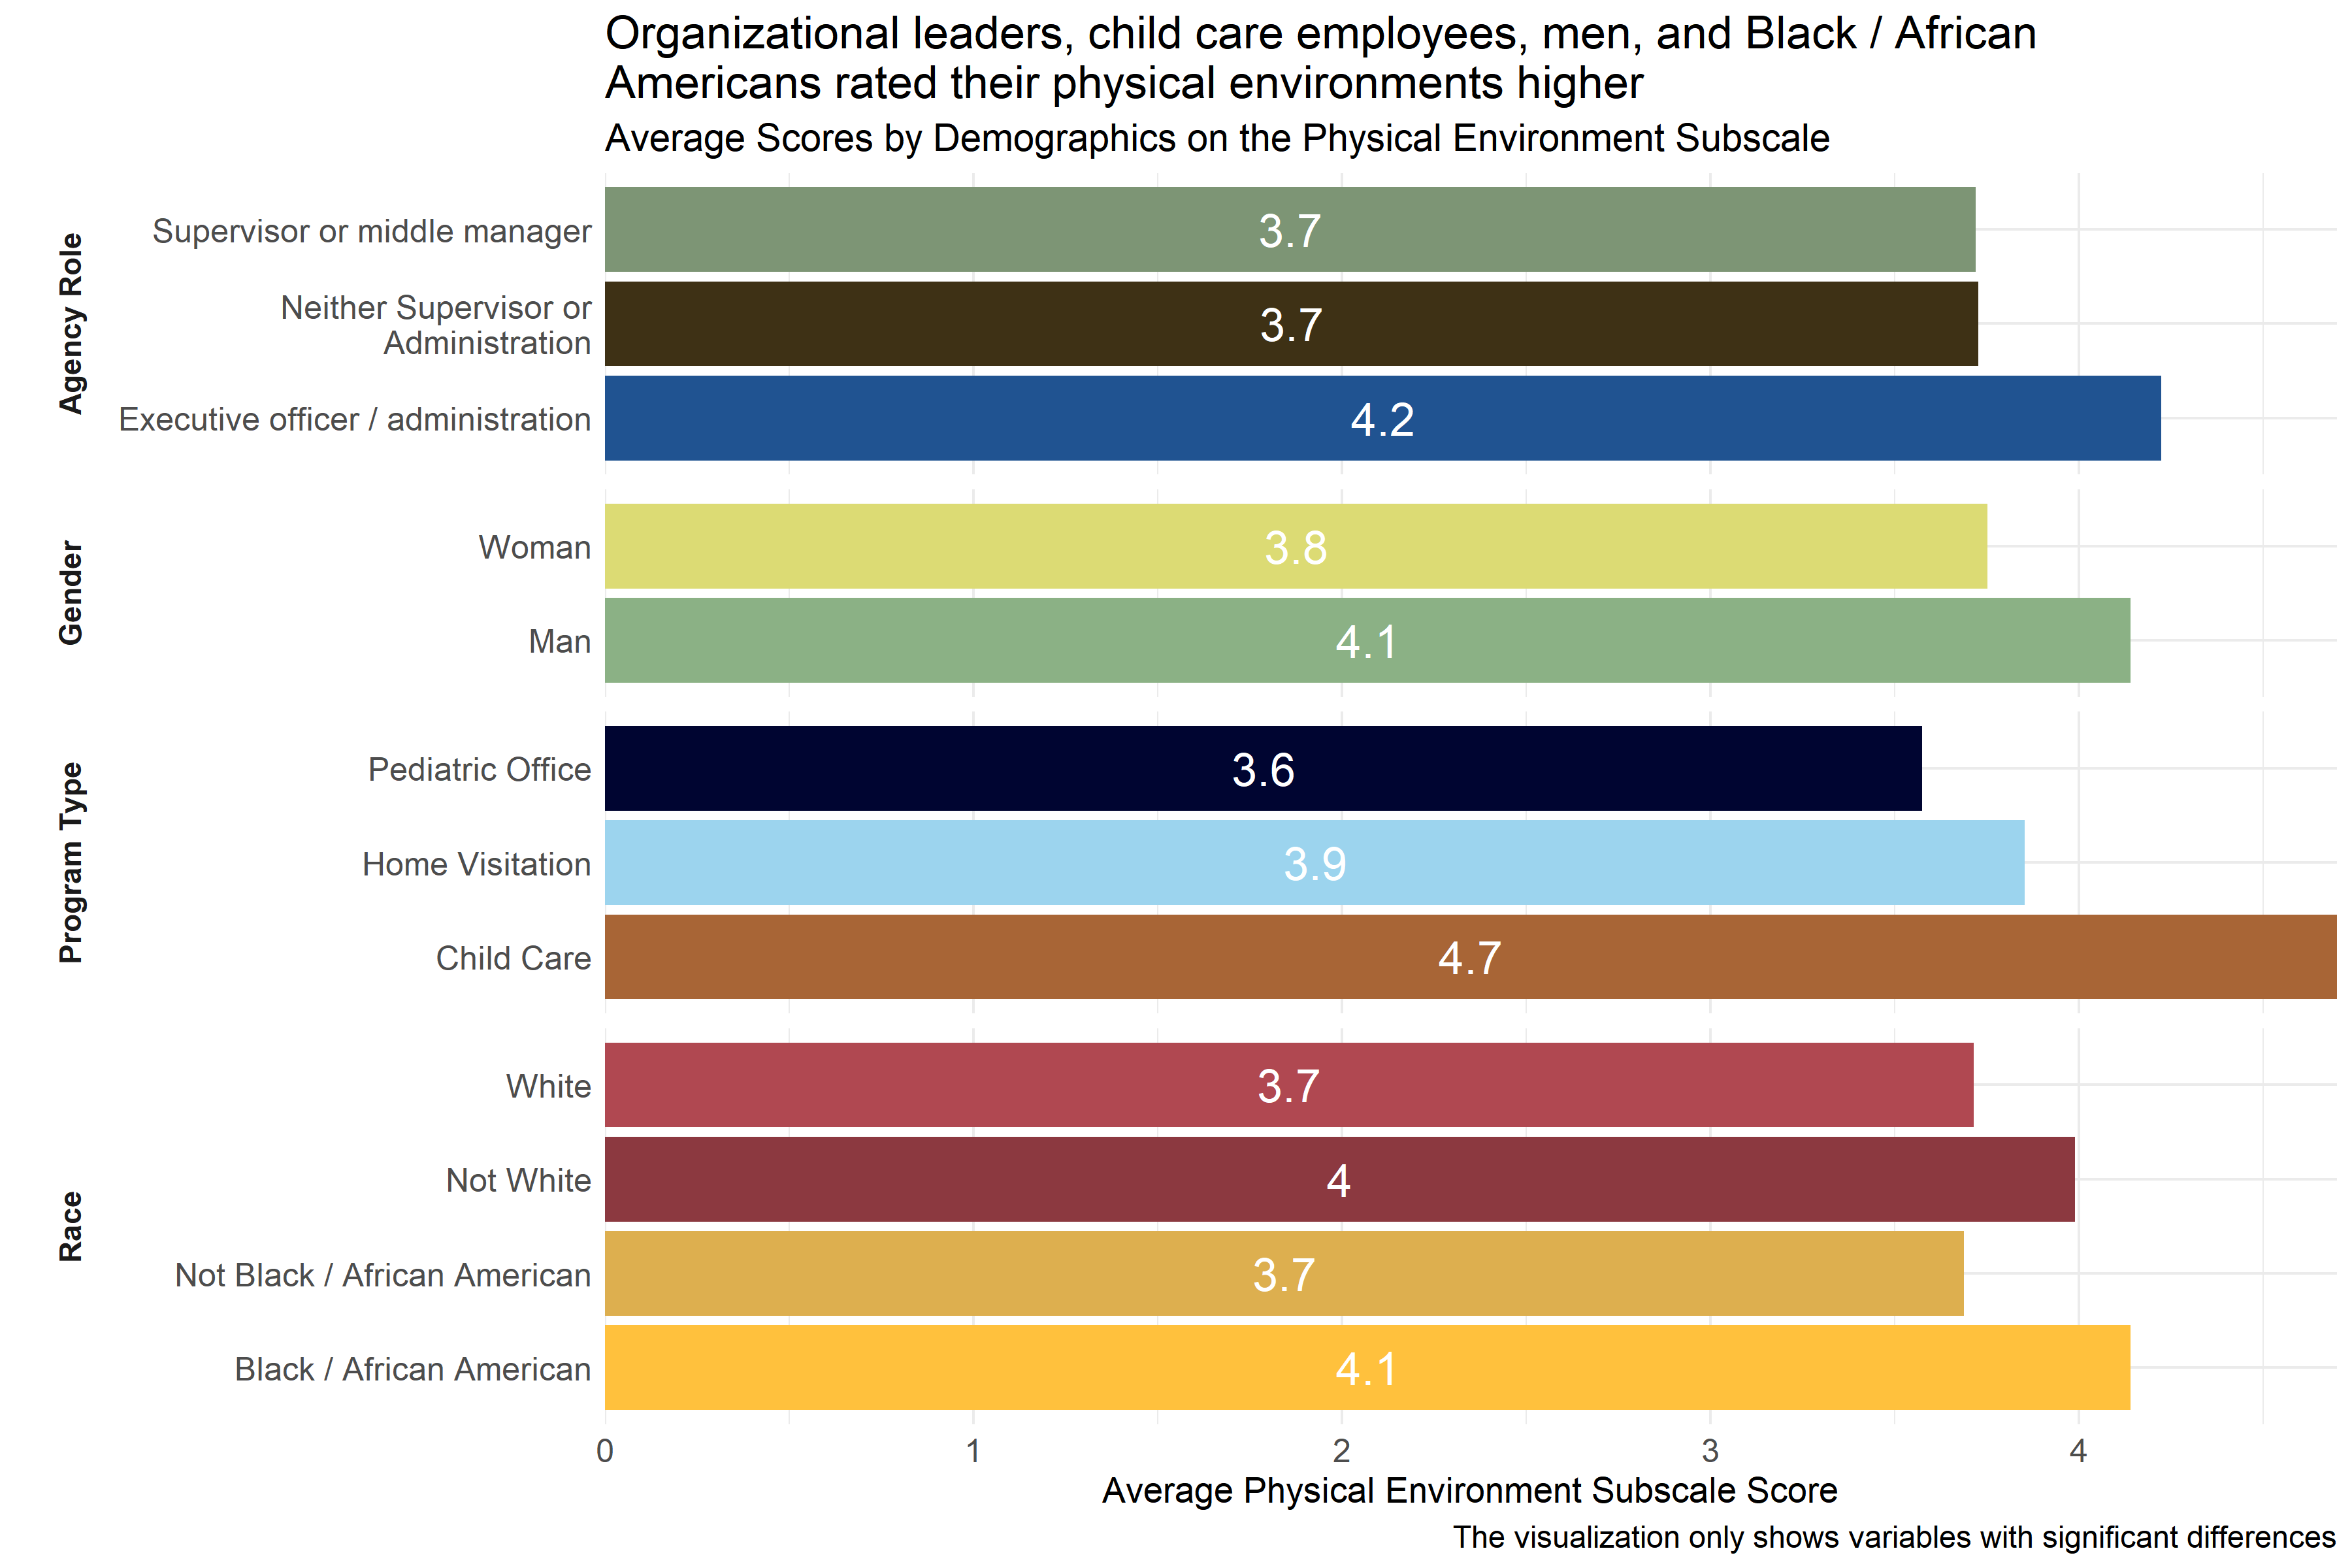
Figure 4.19: Average scores for Physical Environment Subscale across demographic groups
Analysts tested the averages scores on the Physical Environment Subscale across demographic groups to identify differences in how respondents scored their environment. As Figure 4.19 shows, there were some statistically significant differences in average score across respondent groups by race, program type, and role in agency. Respondents identifying as executive officers or members of the organization’s administration had higher average scores than those who did not identify as supervisors, middle managers, administrators, or executive officers. Similarly, respondents working in child care settings and men reported higher scores on average than those in other settings and women, respectively. In addition, Black / African American respondents and respondents who did not identify as White reported higher scores than other respondents.
4.5.4.3 General Social Environment
The General Social Environment Subscale of the Environmental Assessment Survey measures how employees responded to questions about their general social environment. Respondents answered on a five point scale with options ranging from “Strongly disagree” to “Strongly agree” to statements like, “Staff welcome visitors immediately upon entry, introduce themselves and ask how they can help.” Individual responses to each of the questions in this scale can be found in Appendix B: Detailed Question Responses by Scale. Lower scores on this scale indicate a more negative general social environment, and higher scores indicate a more positive general social environment.
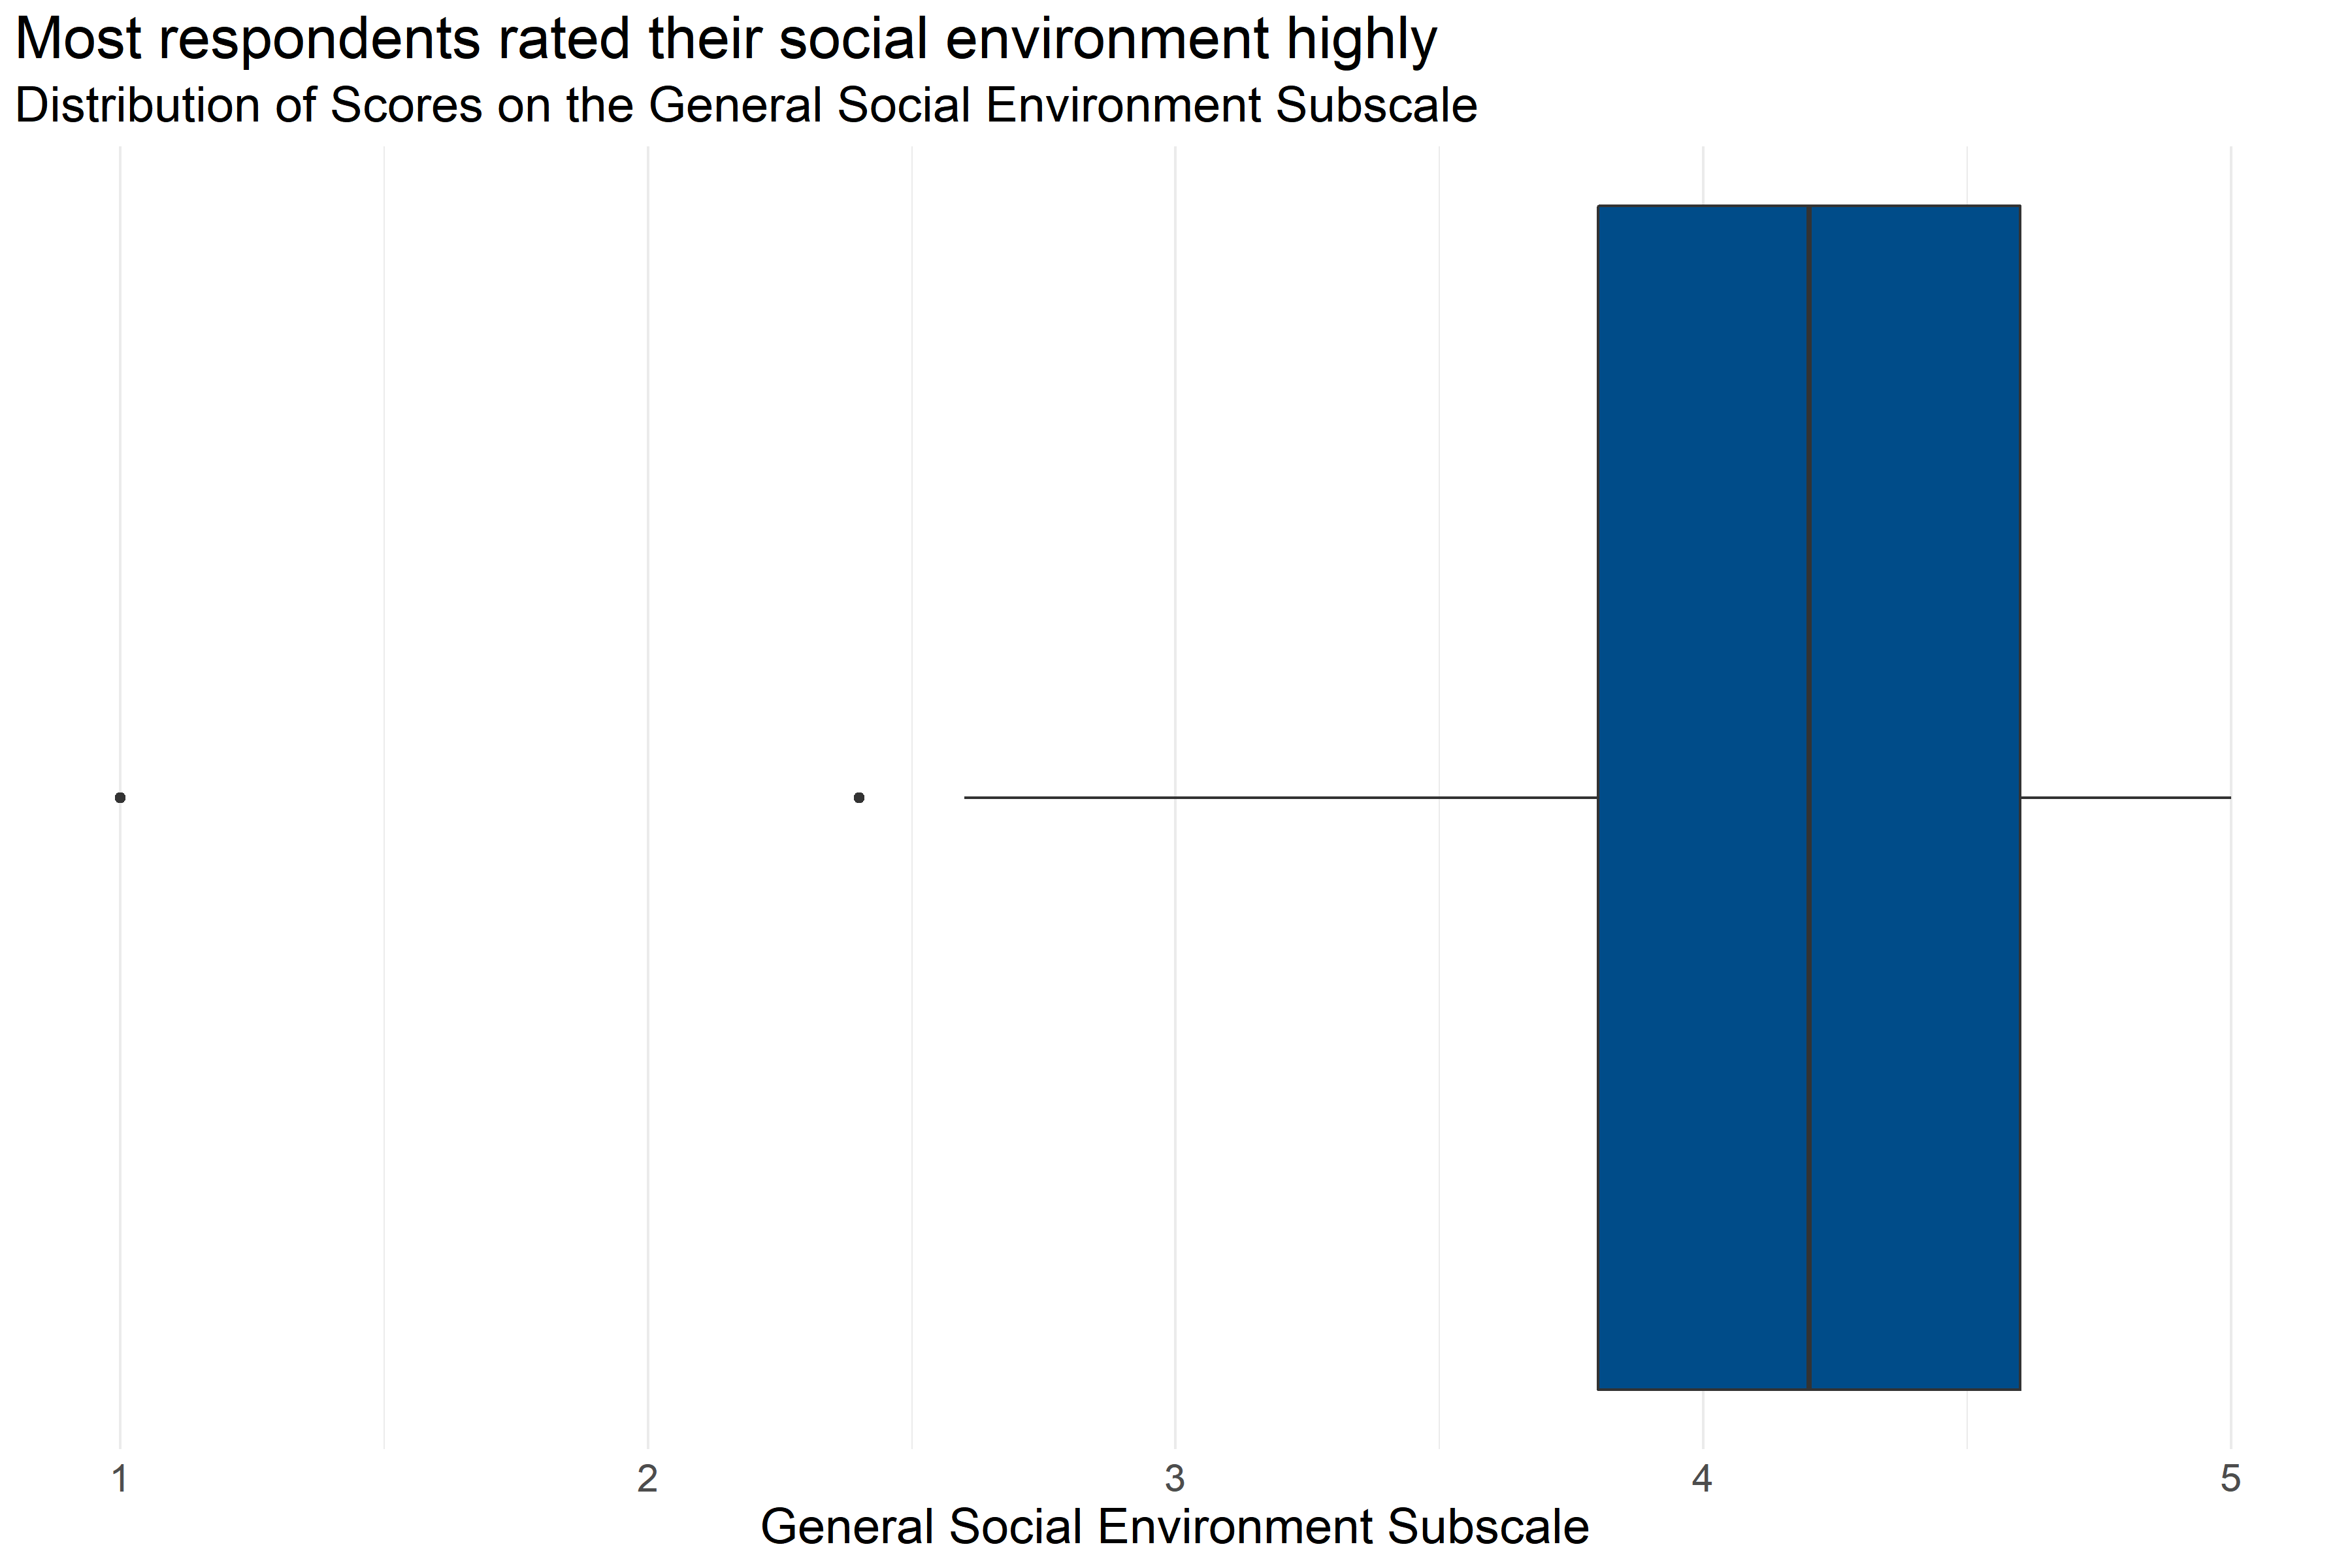
Figure 4.20: Boxplot of score distributions for the General Social Environment Subscale
| Number of Answers | Average Score | Lowest Score | First Quartile | Median | Third Quartile | Highest Score |
|---|---|---|---|---|---|---|
| 226 | 4.11 | 1 | 3.8 | 4.2 | 4.6 | 5 |
Figure 4.20 and Table 4.26 provide information about how respondents scored on the General Social Environment Subscale. They provide the following information:
- Response: 226 respondents answered all questions in the scale.
- Average: The average score was 1.
- Range: Scores ranged from 4.11 to 5.
- Median: About half of respondents scored below 4.2 and half scored above 4.2.
- Interquartile Range: If the range of responses were cut into quarters, the middle half of respondents (between the first and third quartiles) scored between 3.8 and 4.6.
This means that more than half of respondents generally answered that they agreed or strongly agreed with statements about their general social environment while on the job that were consistent with a Trauma Informed Model.
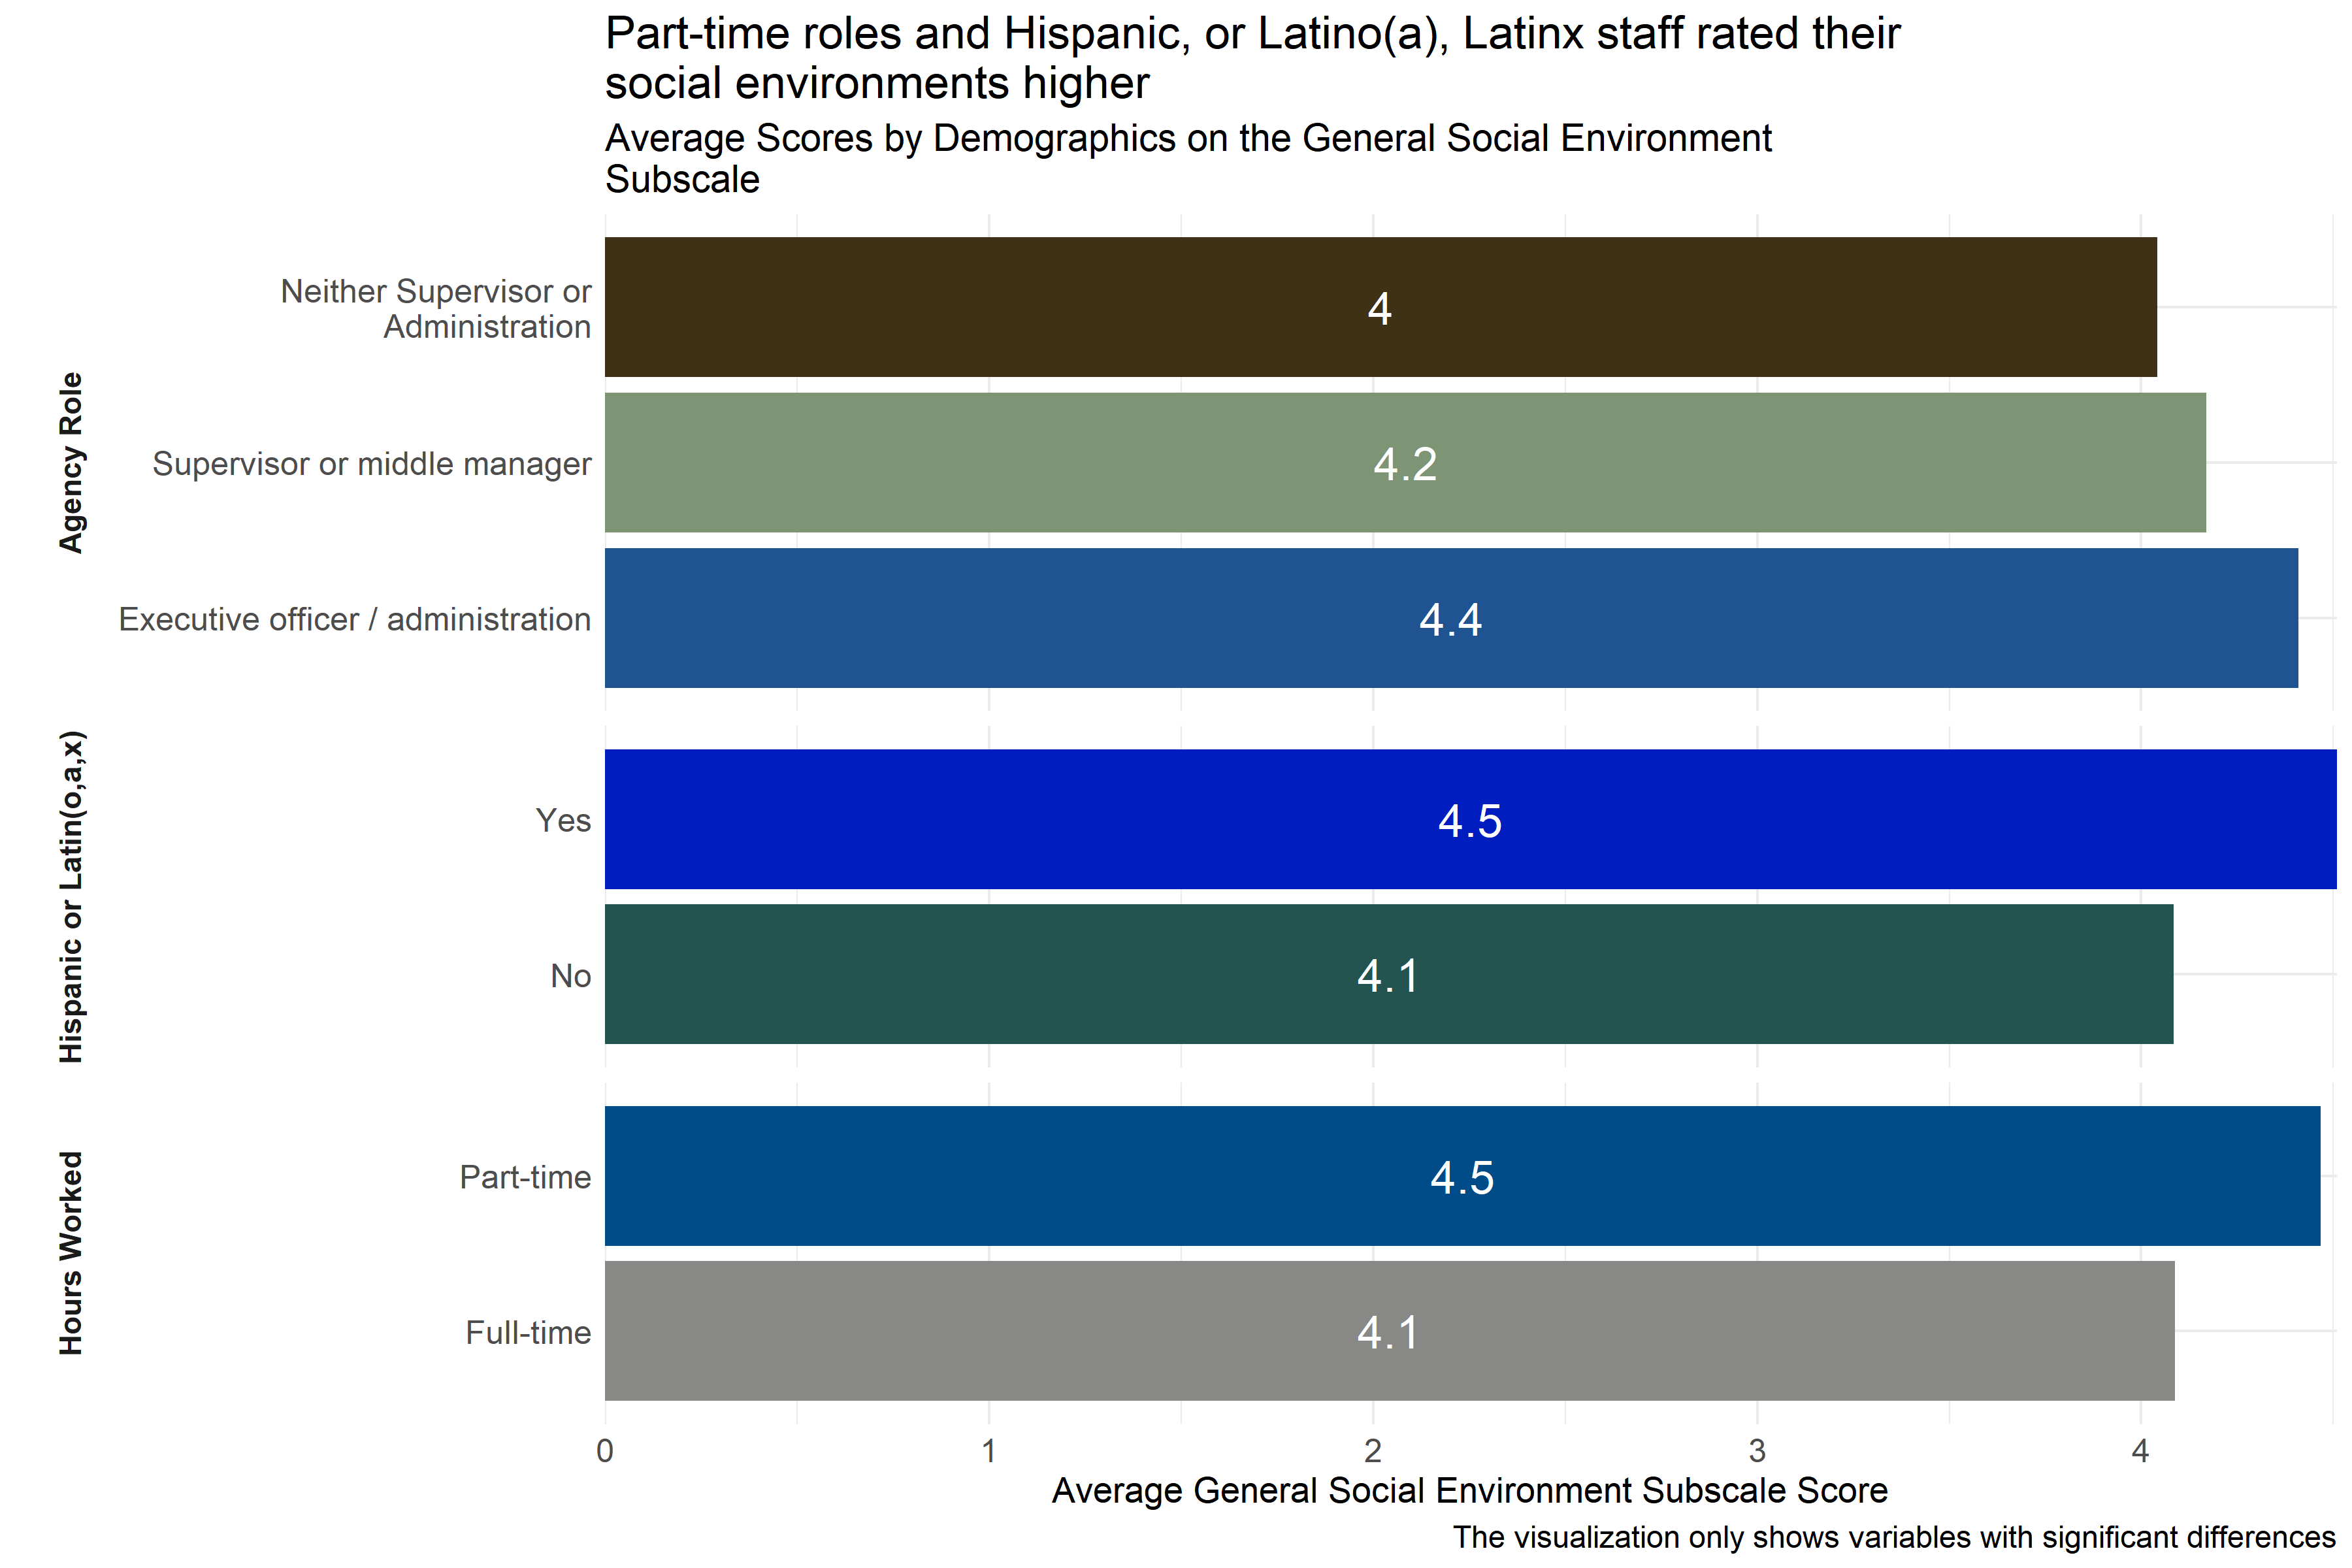
Figure 4.21: Average scores for General Social Environment Subscale across demographic groups
Analysts tested the average scores on the General Social Environment Subscale across demographic groups to identify differences in how respondents scored their environment. As Figure 4.21 shows, there were some statistically significant differences in average score across respondent groups by race and role in agency. Respondents identifying as part-time employees had higher average scores than full-time employees. And, those who identified themselves as executive officers or administrators had higher scores than those who did not identify themselves as supervisors or members of the administration. Additionally, Hispanic, or Latino(a), Latinx respondents reported higher scores than non-Hispanic, or non-Latino(a), Latinx respondents.
Analysts also observed some significant differences in average scores by organization, but they are not displayed in Figure 4.21 above to protect the privacy of those organizations.
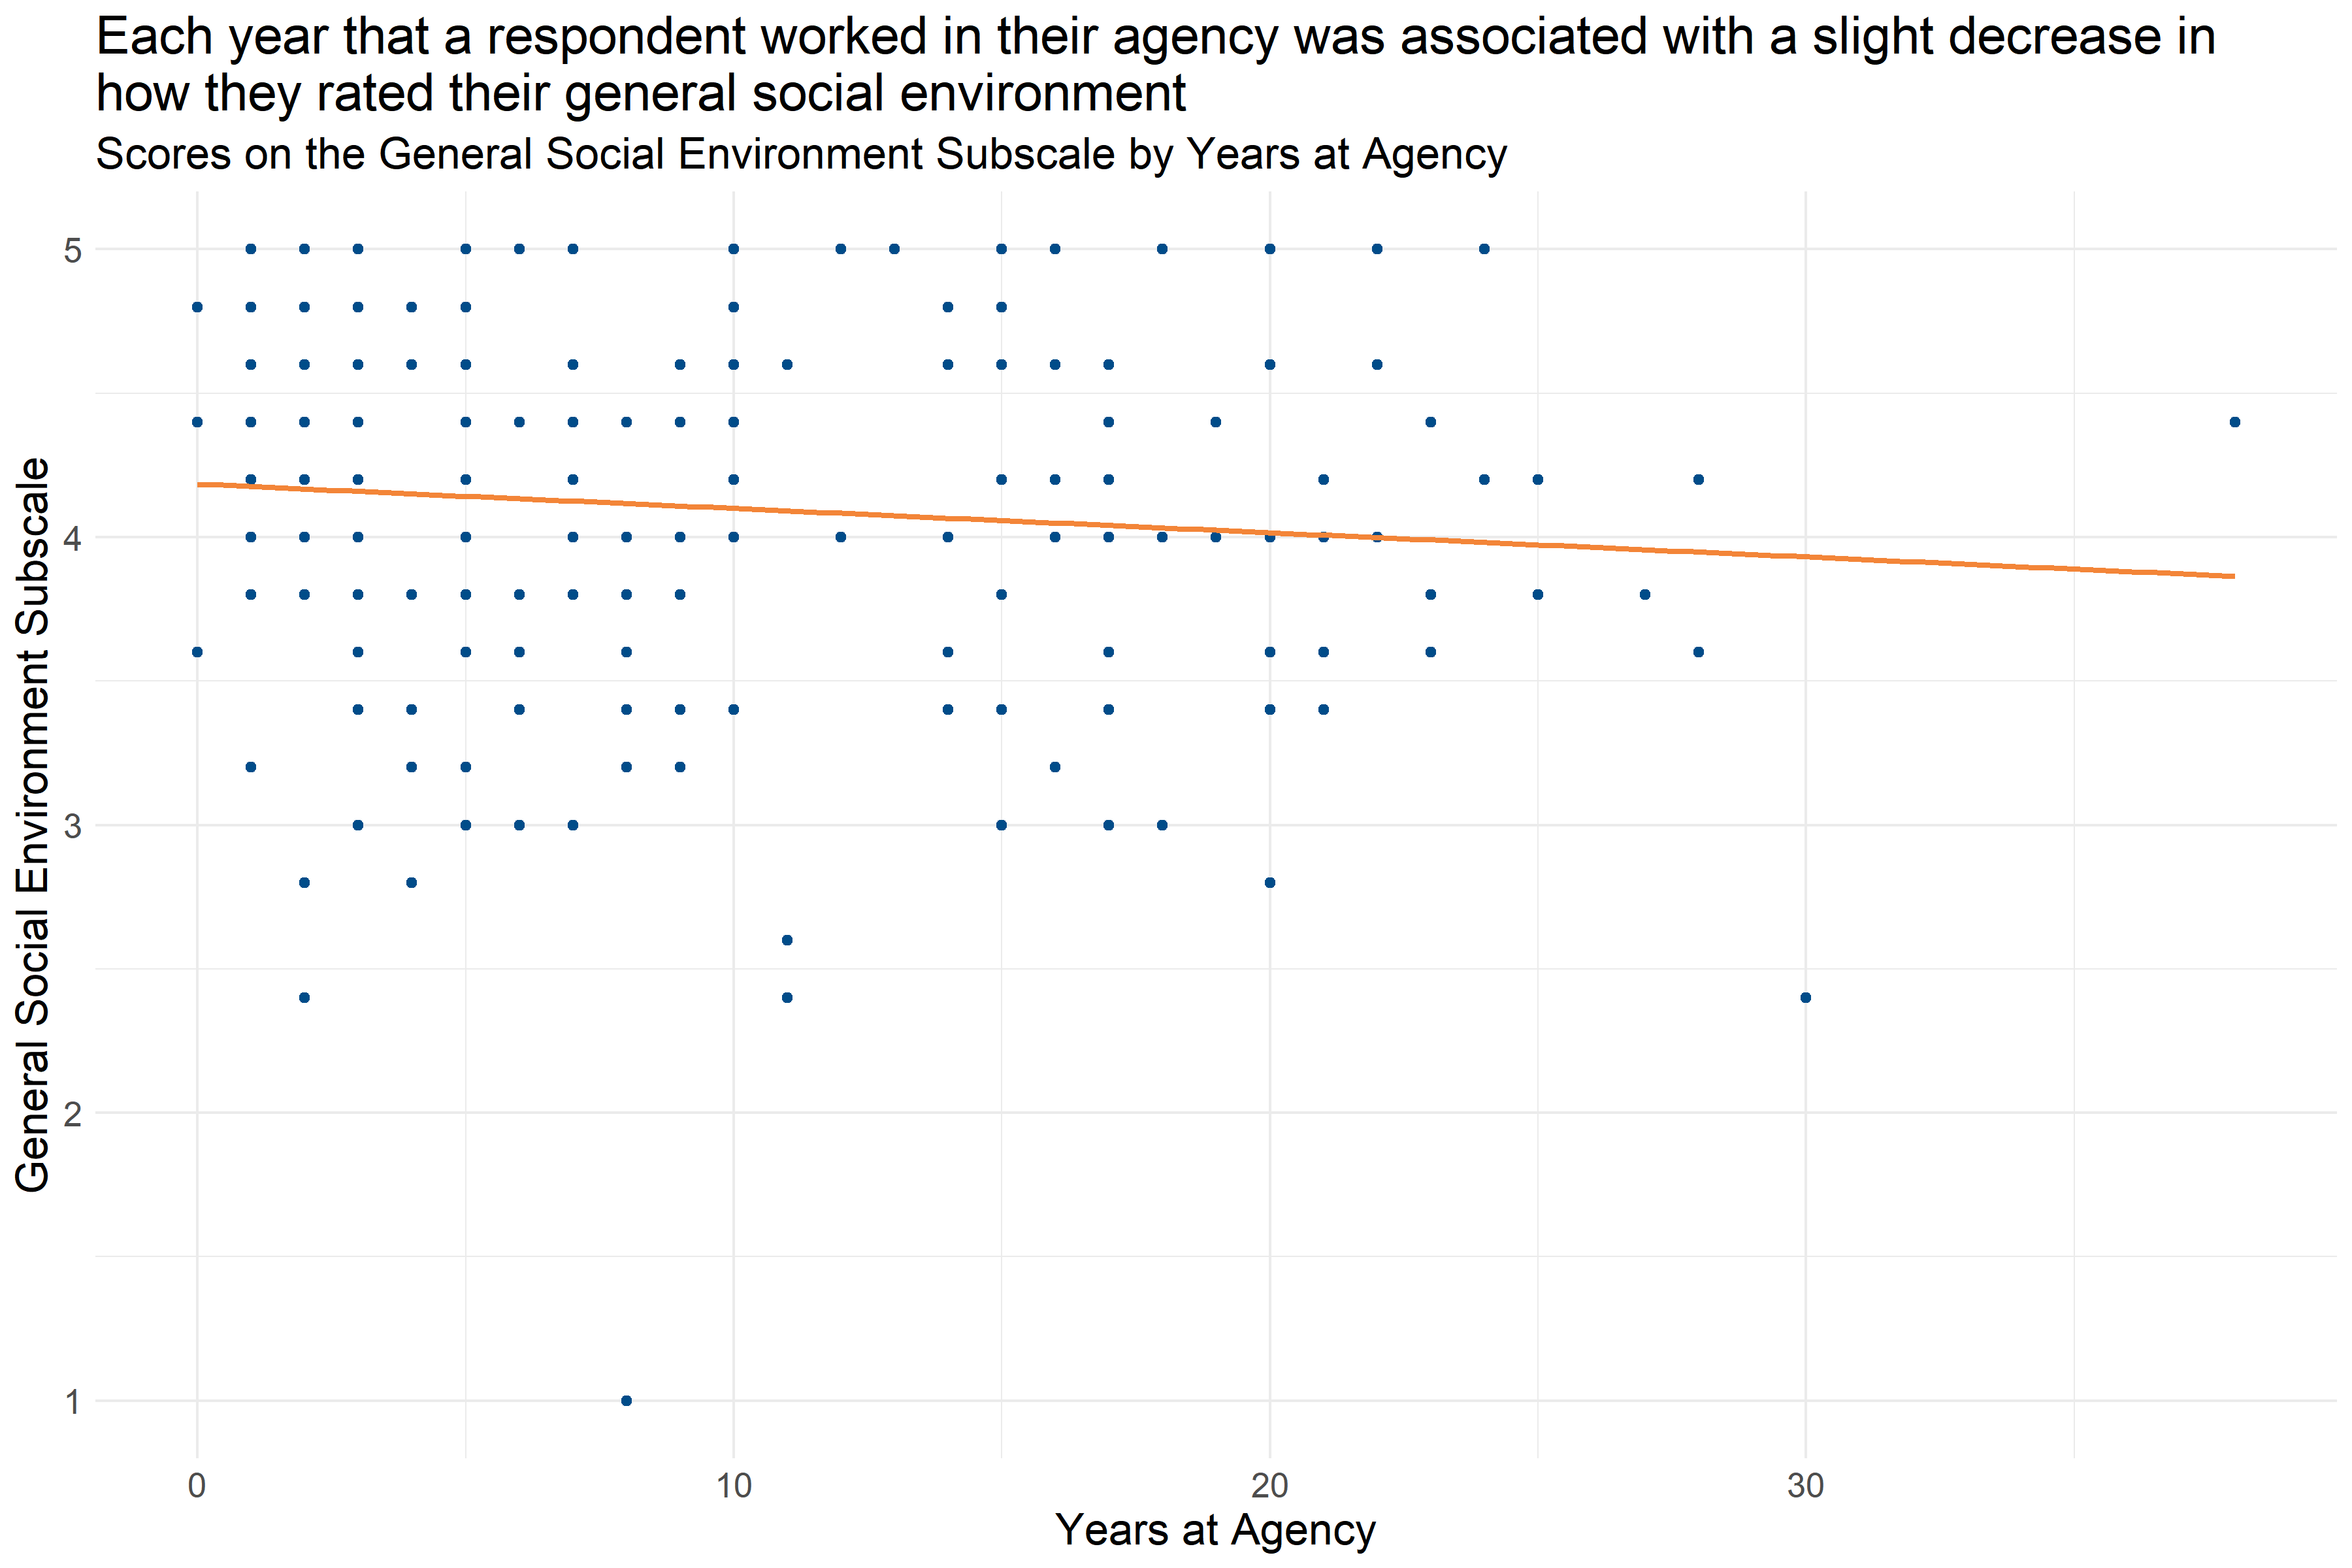
Figure 4.22: Scatter plot of Years at Agency and General Social Environment Subscale score
Figure 4.22 shows that each year that a respondent worked at their agency was associated with a slight decrease in their General Social Environment Subscale score (decrease of about 0.1 per year). This suggests that staff with more experience at their agency are slightly less likely to report a positive social environment.
4.5.4.4 Staff Social Environment
The Staff Social Environment Subscale of the Environmental Assessment Survey measures how employees responded to questions about their staff social environment. Respondents answered on a five point scale with options ranging from “Strongly disagree” to “Strongly agree” to statements like, “Staff freely ask questions of each other and exchange information.” Individual responses to each of the questions in this scale can be found in Appendix B: Detailed Question Responses by Scale. Lower scores on this scale indicate a more negative staff social environment, and higher scores indicate a more positive staff social environment.
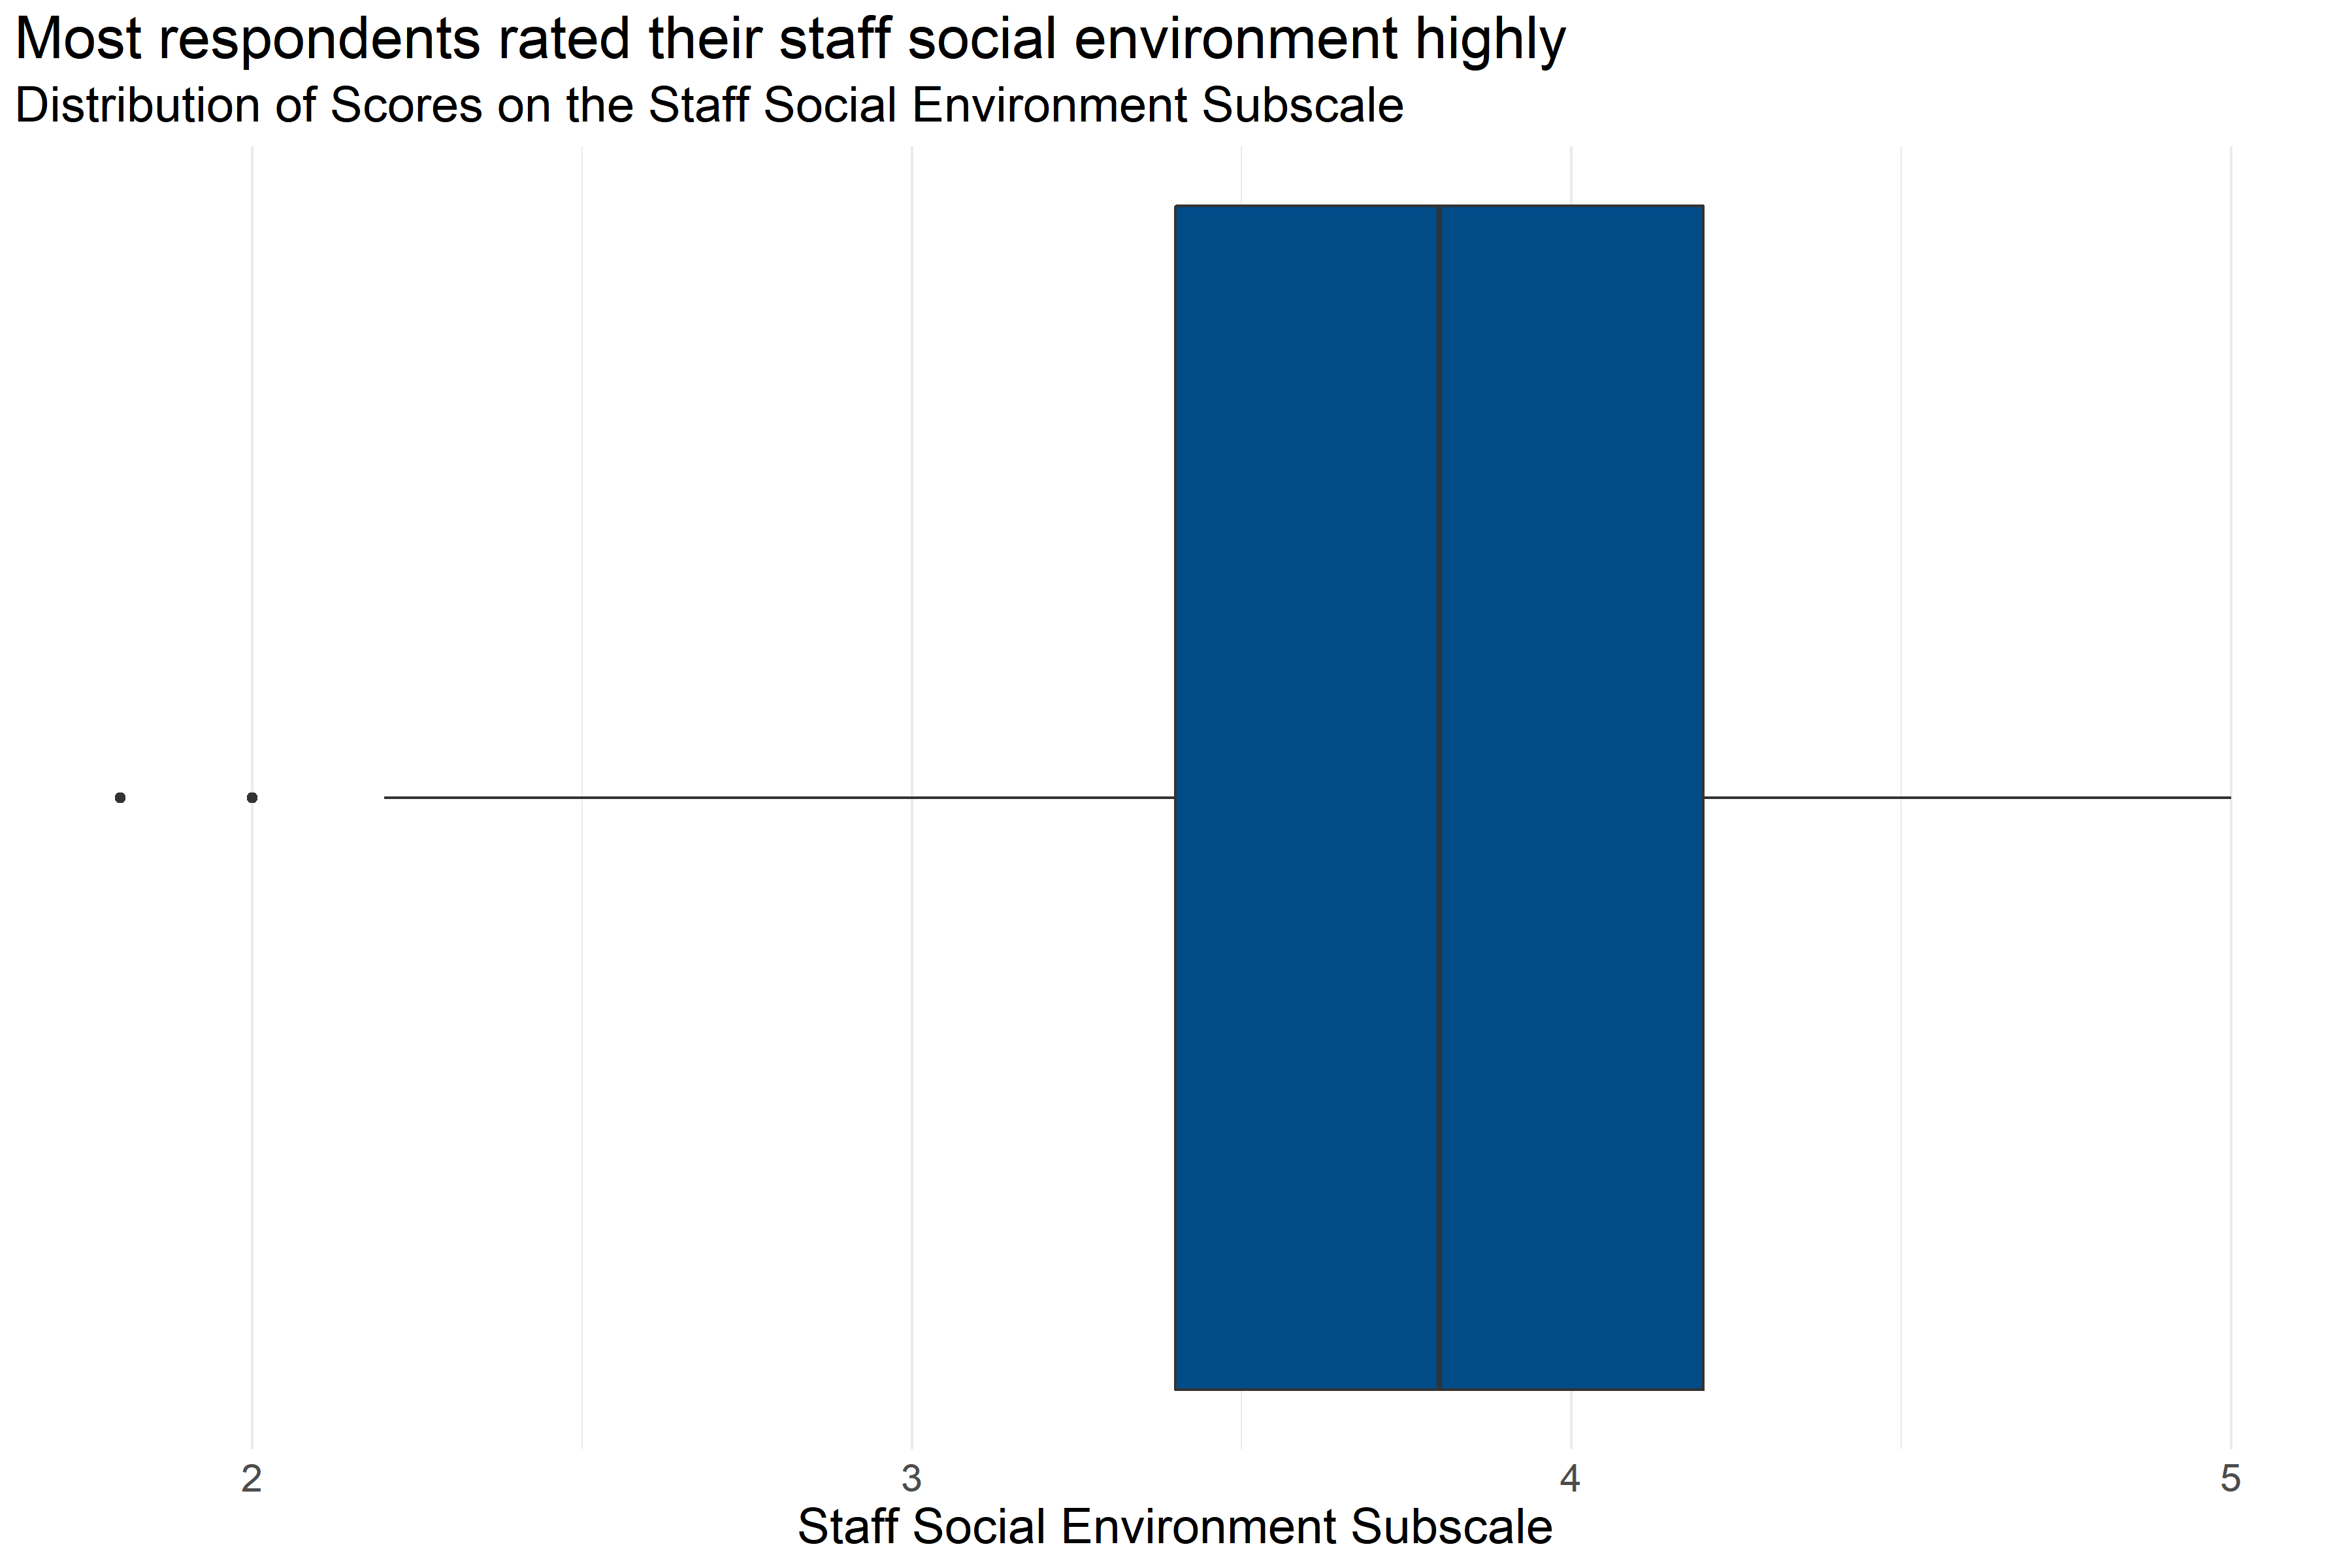
Figure 4.23: Boxplot of score distributions for the Staff Social Environment Subscale
| Number of Answers | Average Score | Lowest Score | First Quartile | Median | Third Quartile | Highest Score |
|---|---|---|---|---|---|---|
| 226 | 3.78 | 1.8 | 3.4 | 3.8 | 4.2 | 5 |
Figure 4.23 and Table 4.27 provide information about how respondents scored on the Staff Social Environment Subscale. They provide the following information:
- Response: 226 respondents answered all questions in the scale.
- Average: The average score was 1.8.
- Range: Scores ranged from 3.78 to 5.
- Median: About half of respondents scored below 3.8 and half scored above 3.8.
- Interquartile Range: If the range of responses were cut into quarters, the middle half of respondents (between the first and third quartiles) scored between 3.4 and 4.2.
This means that more than half of respondents generally answered that they agreed or strongly agreed with statements about their staff social environment while on the job that were consistent with a Trauma Informed Model.
Analysts tested the average scores on the Staff Social Environment Subscale across demographic groups to identify differences in how respondents answered questions about the staff social environment at their work. The only significant differences in how staff rated their social environments were found across specific agencies, and these scores were not displayed in a graph to protect the privacy of those organizations.
4.5.4.5 Commitment to Nonviolence
The Commitment to Nonviolence Subscale measures the extent to which the cultural and social environment at an agency aligns with the trauma-informed norm and value of commitment to nonviolence. Survey participants responded to statements like “Destructive or violent incidents are addressed nonviolently and openly reviewed as soon as possible.” and “The community has a clear set of boundaries.” on a scale of 1 “Strongly Disagree” to 5 “Strongly Agree.” Individual responses to each of the questions in this scale can be found in Appendix B: Detailed Question Responses by Scale. Low scores on this scale indicate that the organization’s environment is less aligned with the commitment to nonviolence.
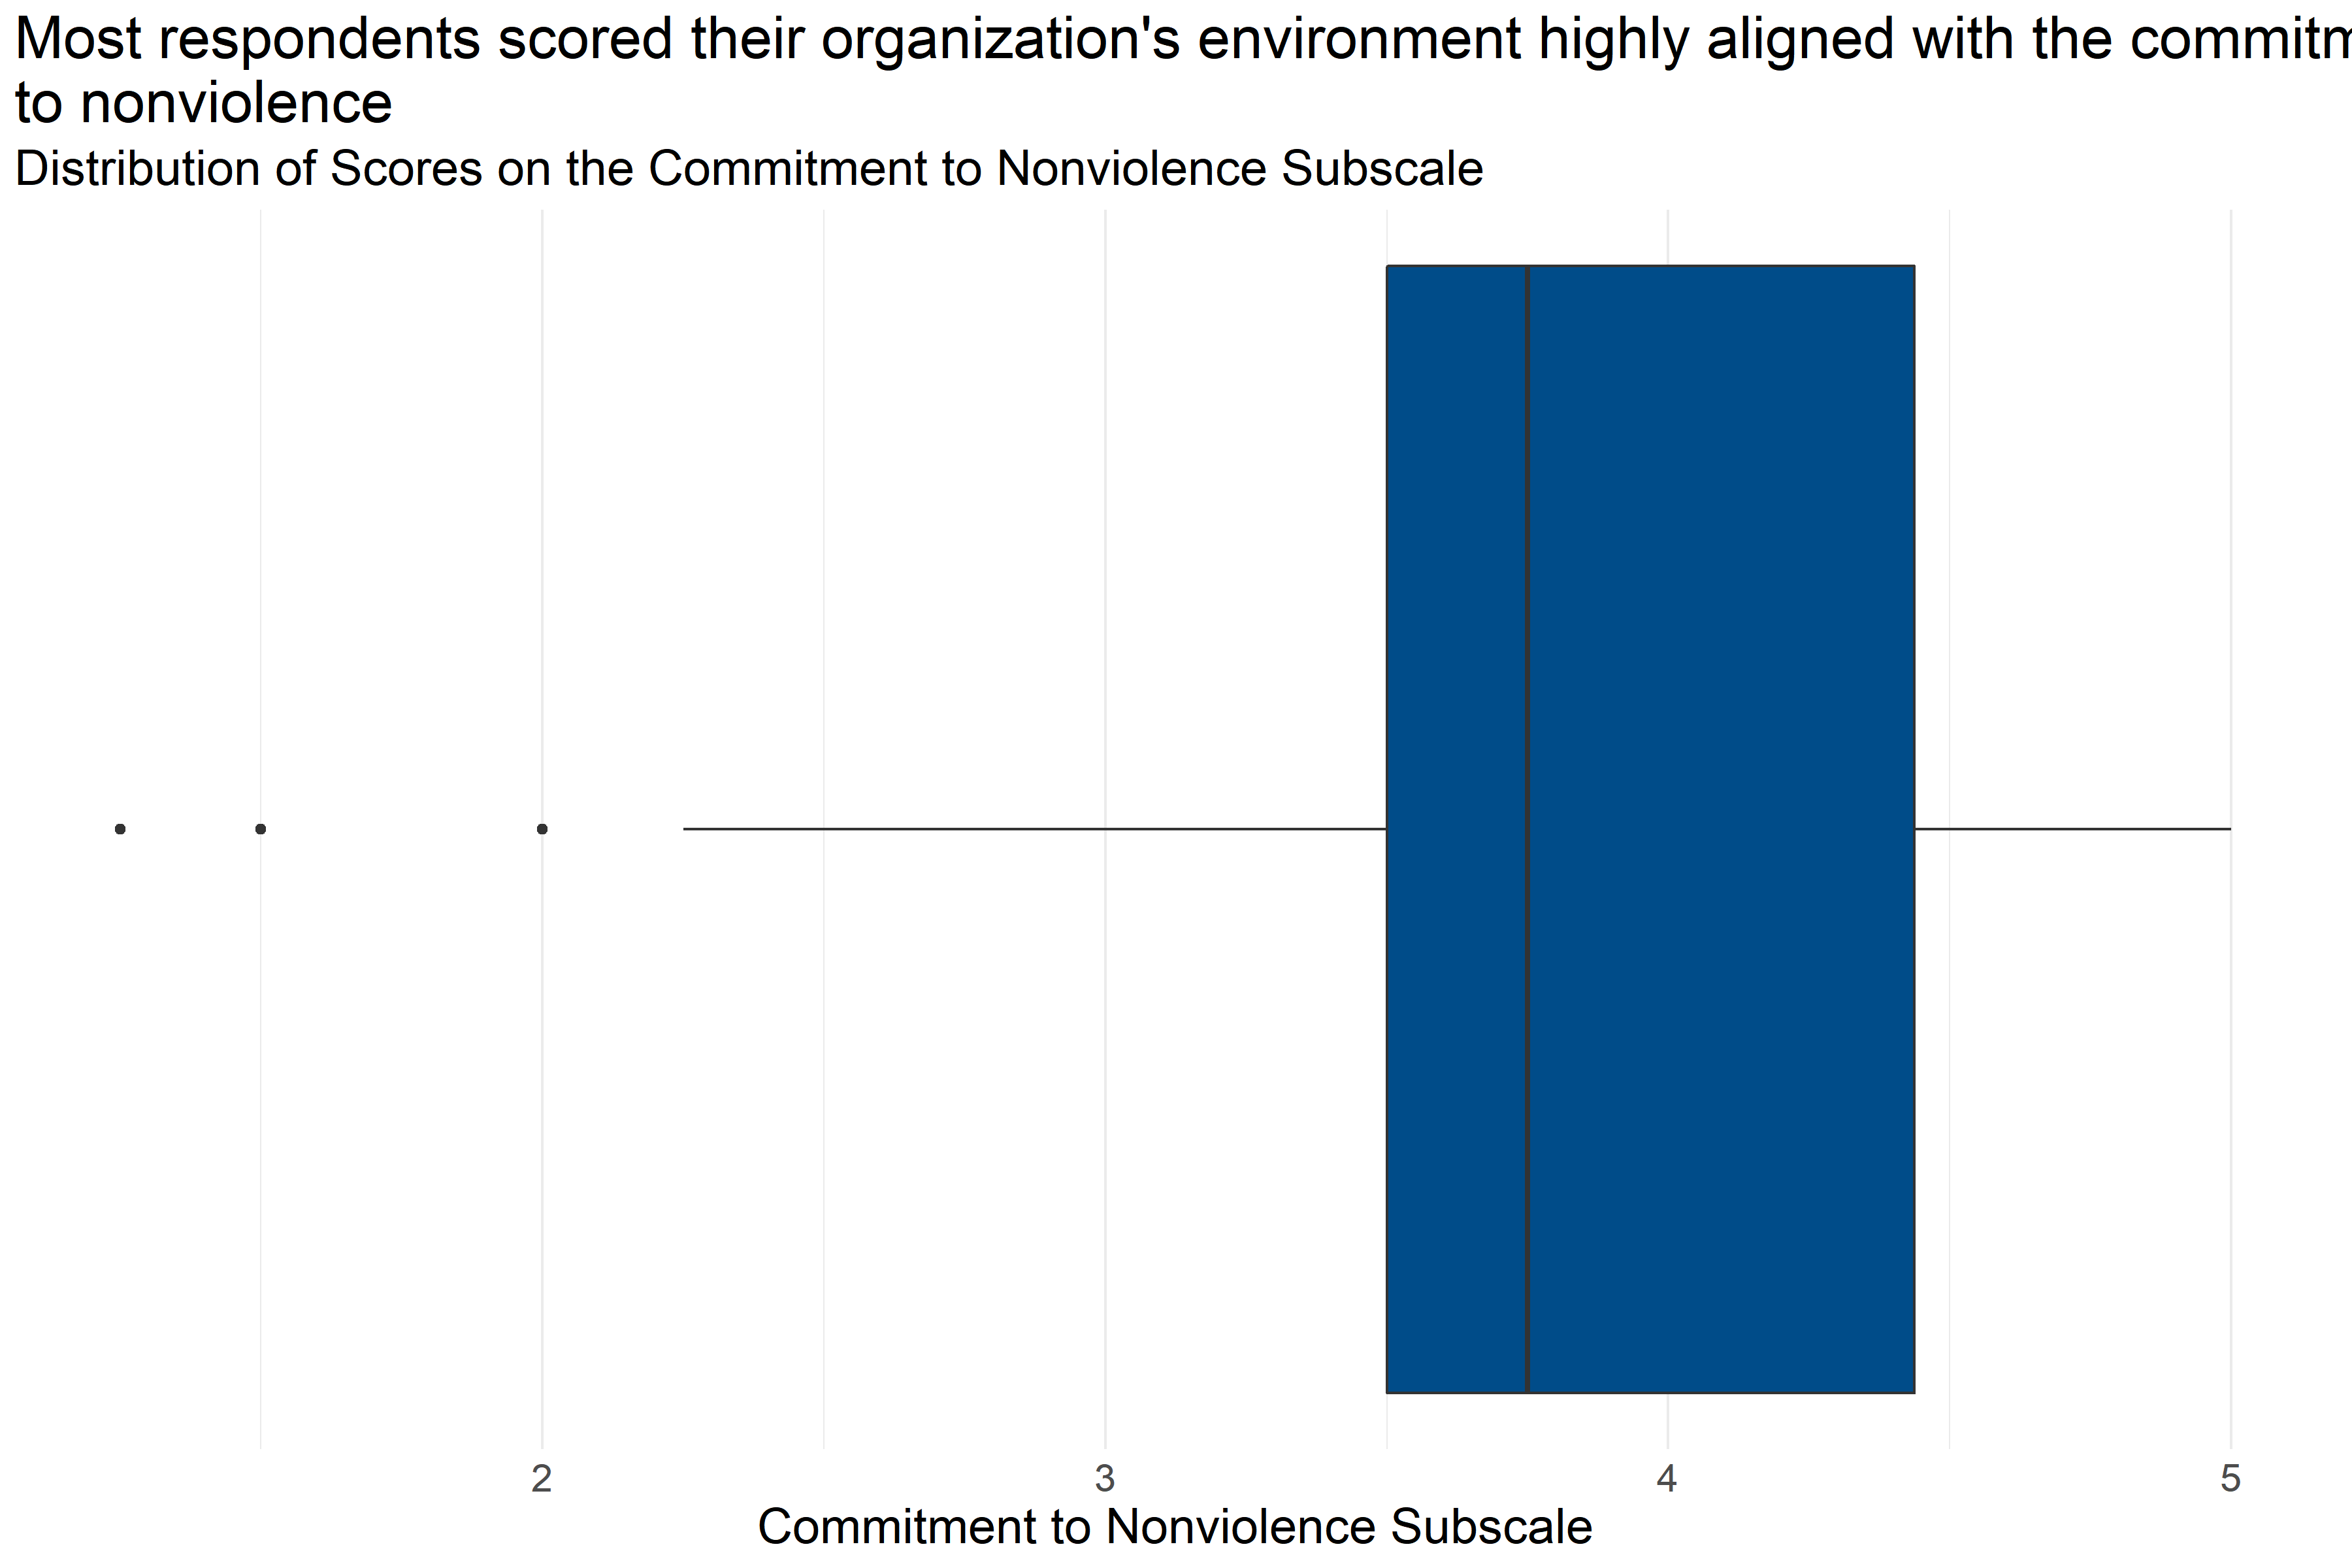
Figure 4.24: Boxplot of score distributions for Commitment to Nonviolence Subscale
| Number of Answers | Average Score | Lowest Score | First Quartile | Median | Third Quartile | Highest Score |
|---|---|---|---|---|---|---|
| 218 | 3.82 | 1.25 | 3.5 | 3.75 | 4.44 | 5 |
Figure 4.24 and Table 4.28 provide information about how respondents scored on the Commitment to Nonviolence Subscale. They provide the following information:
- Response: 218 respondents answered all questions in the scale.
- Average: The average score was 1.25.
- Range: Scores ranged from 3.82 to 5.
- Median: About half of respondents scored below 3.75 and half scored above 3.75.
- Interquartile Range: If the range of responses were cut into quarters, the middle half of respondents (between the first and third quartiles) scored between 3.5 and 4.44.
This means that more than half of respondents generally answered that they agreed or strongly agreed with statements about the alignment of their organization’s commitment to nonviolence that were consistent with a Trauma Informed Model.
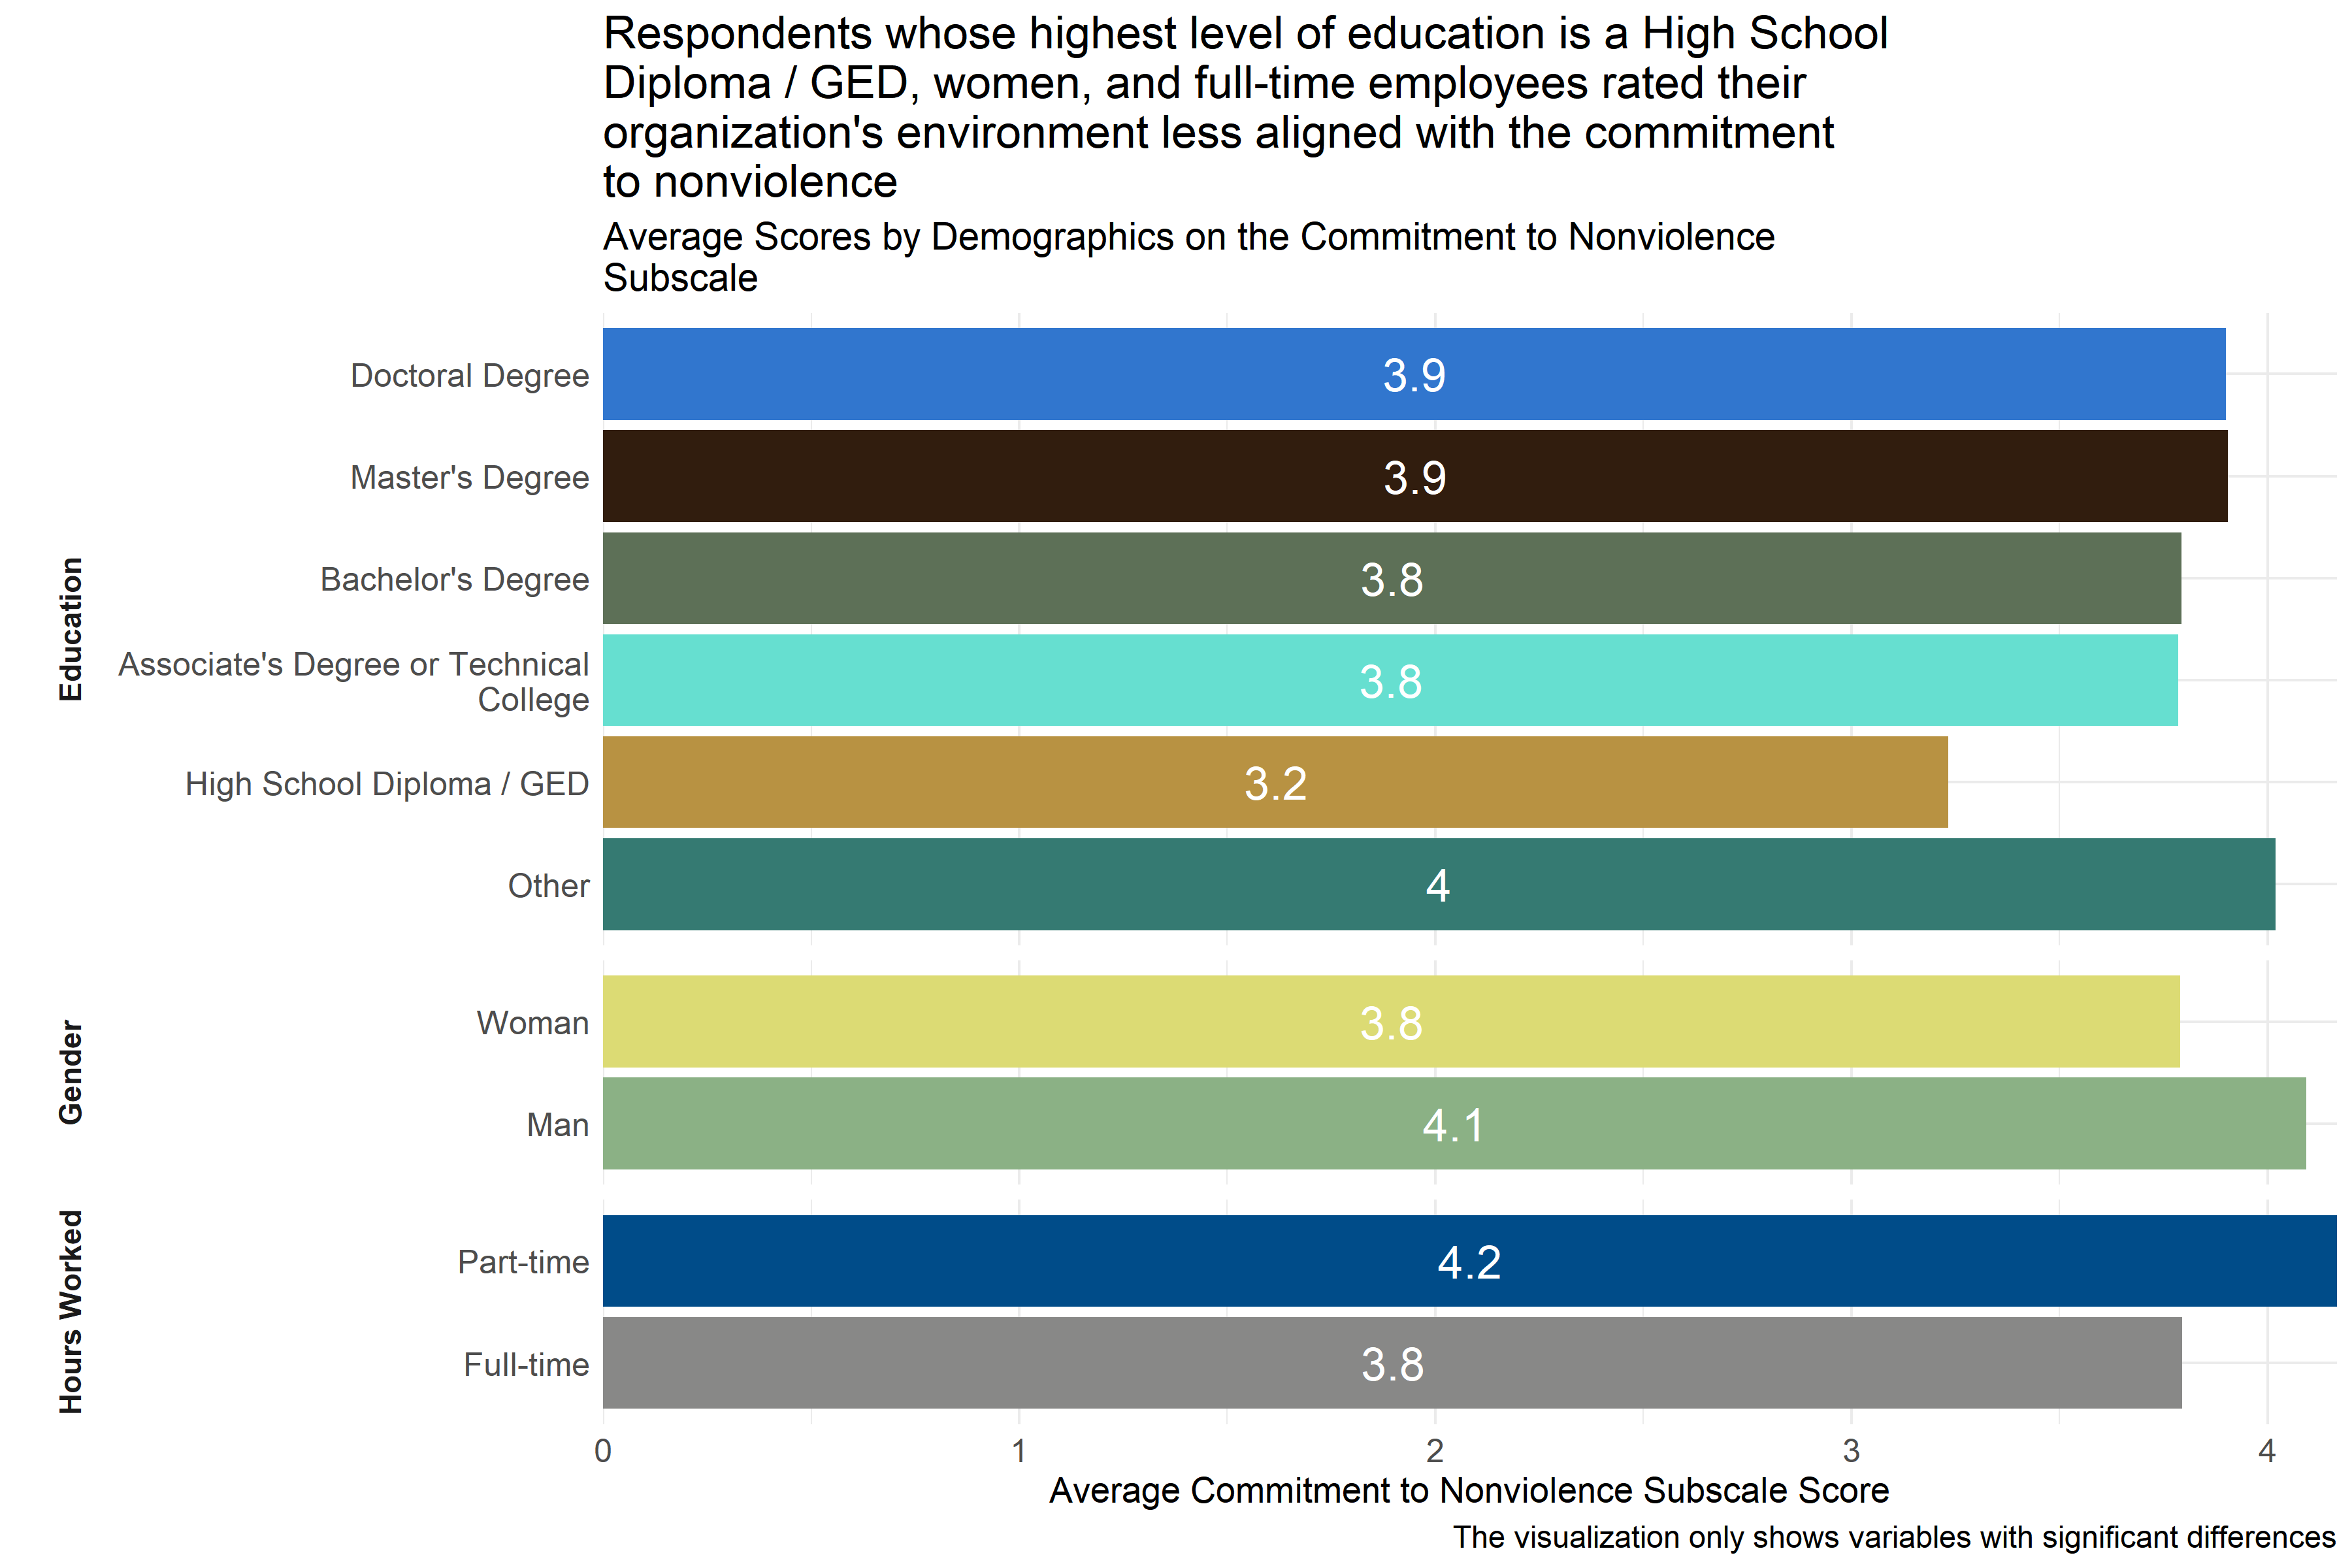
Figure 4.25: Average scores for Commitment to Nonviolence Subscale across demographic groups
Analysts tested the average scores on the Commitment to Nonviolence Subscale across demographic groups to identify differences in how respondents answered questions about how they perceived indications of their agencies’ commitment to nonviolence in a way that was consistent with the Trauma Informed Care model. As Figure 4.25 shows, respondents whose highest level of education is a High School Diploma / GED reported lower scores on average than those who have achieved higher levels of education, as did women and full-time employees. Analysts also saw significant differences in responses across specific agencies, but those scores are not included in Figure 4.25 above to protect the privacy of those agencies.
This suggests that respondents whose highest level of education is a High School Diploma / GED, who are women, and who work full-time are experiencing less alignment between their organizations’ commitment to nonviolence and the commitment to nonviolence that is consistent with a trauma informed care model.
4.5.4.6 Commitment to Emotional Intelligence
The Commitment to Emotional Intelligence Subscale measures the extent to which the cultural and social environment at an agency aligns with the trauma-informed norm and value of commitment to emotional intelligence. Survey participants responded to statements like “When staff members discuss a client, there is always an emphasis on thoughtful exploration of complicated issues.” and “My supervisor talks with me about work-related stress and helps me manage that stress in appropriate ways.” on a scale of 1 “Strongly Disagree” to 5 “Strongly Agree.” Individual responses to each of the questions in this scale can be found in Appendix B: Detailed Question Responses by Scale. Low scores on this scale indicate that the organization’s environment is less aligned with the Commitment to Emotional Intelligence.
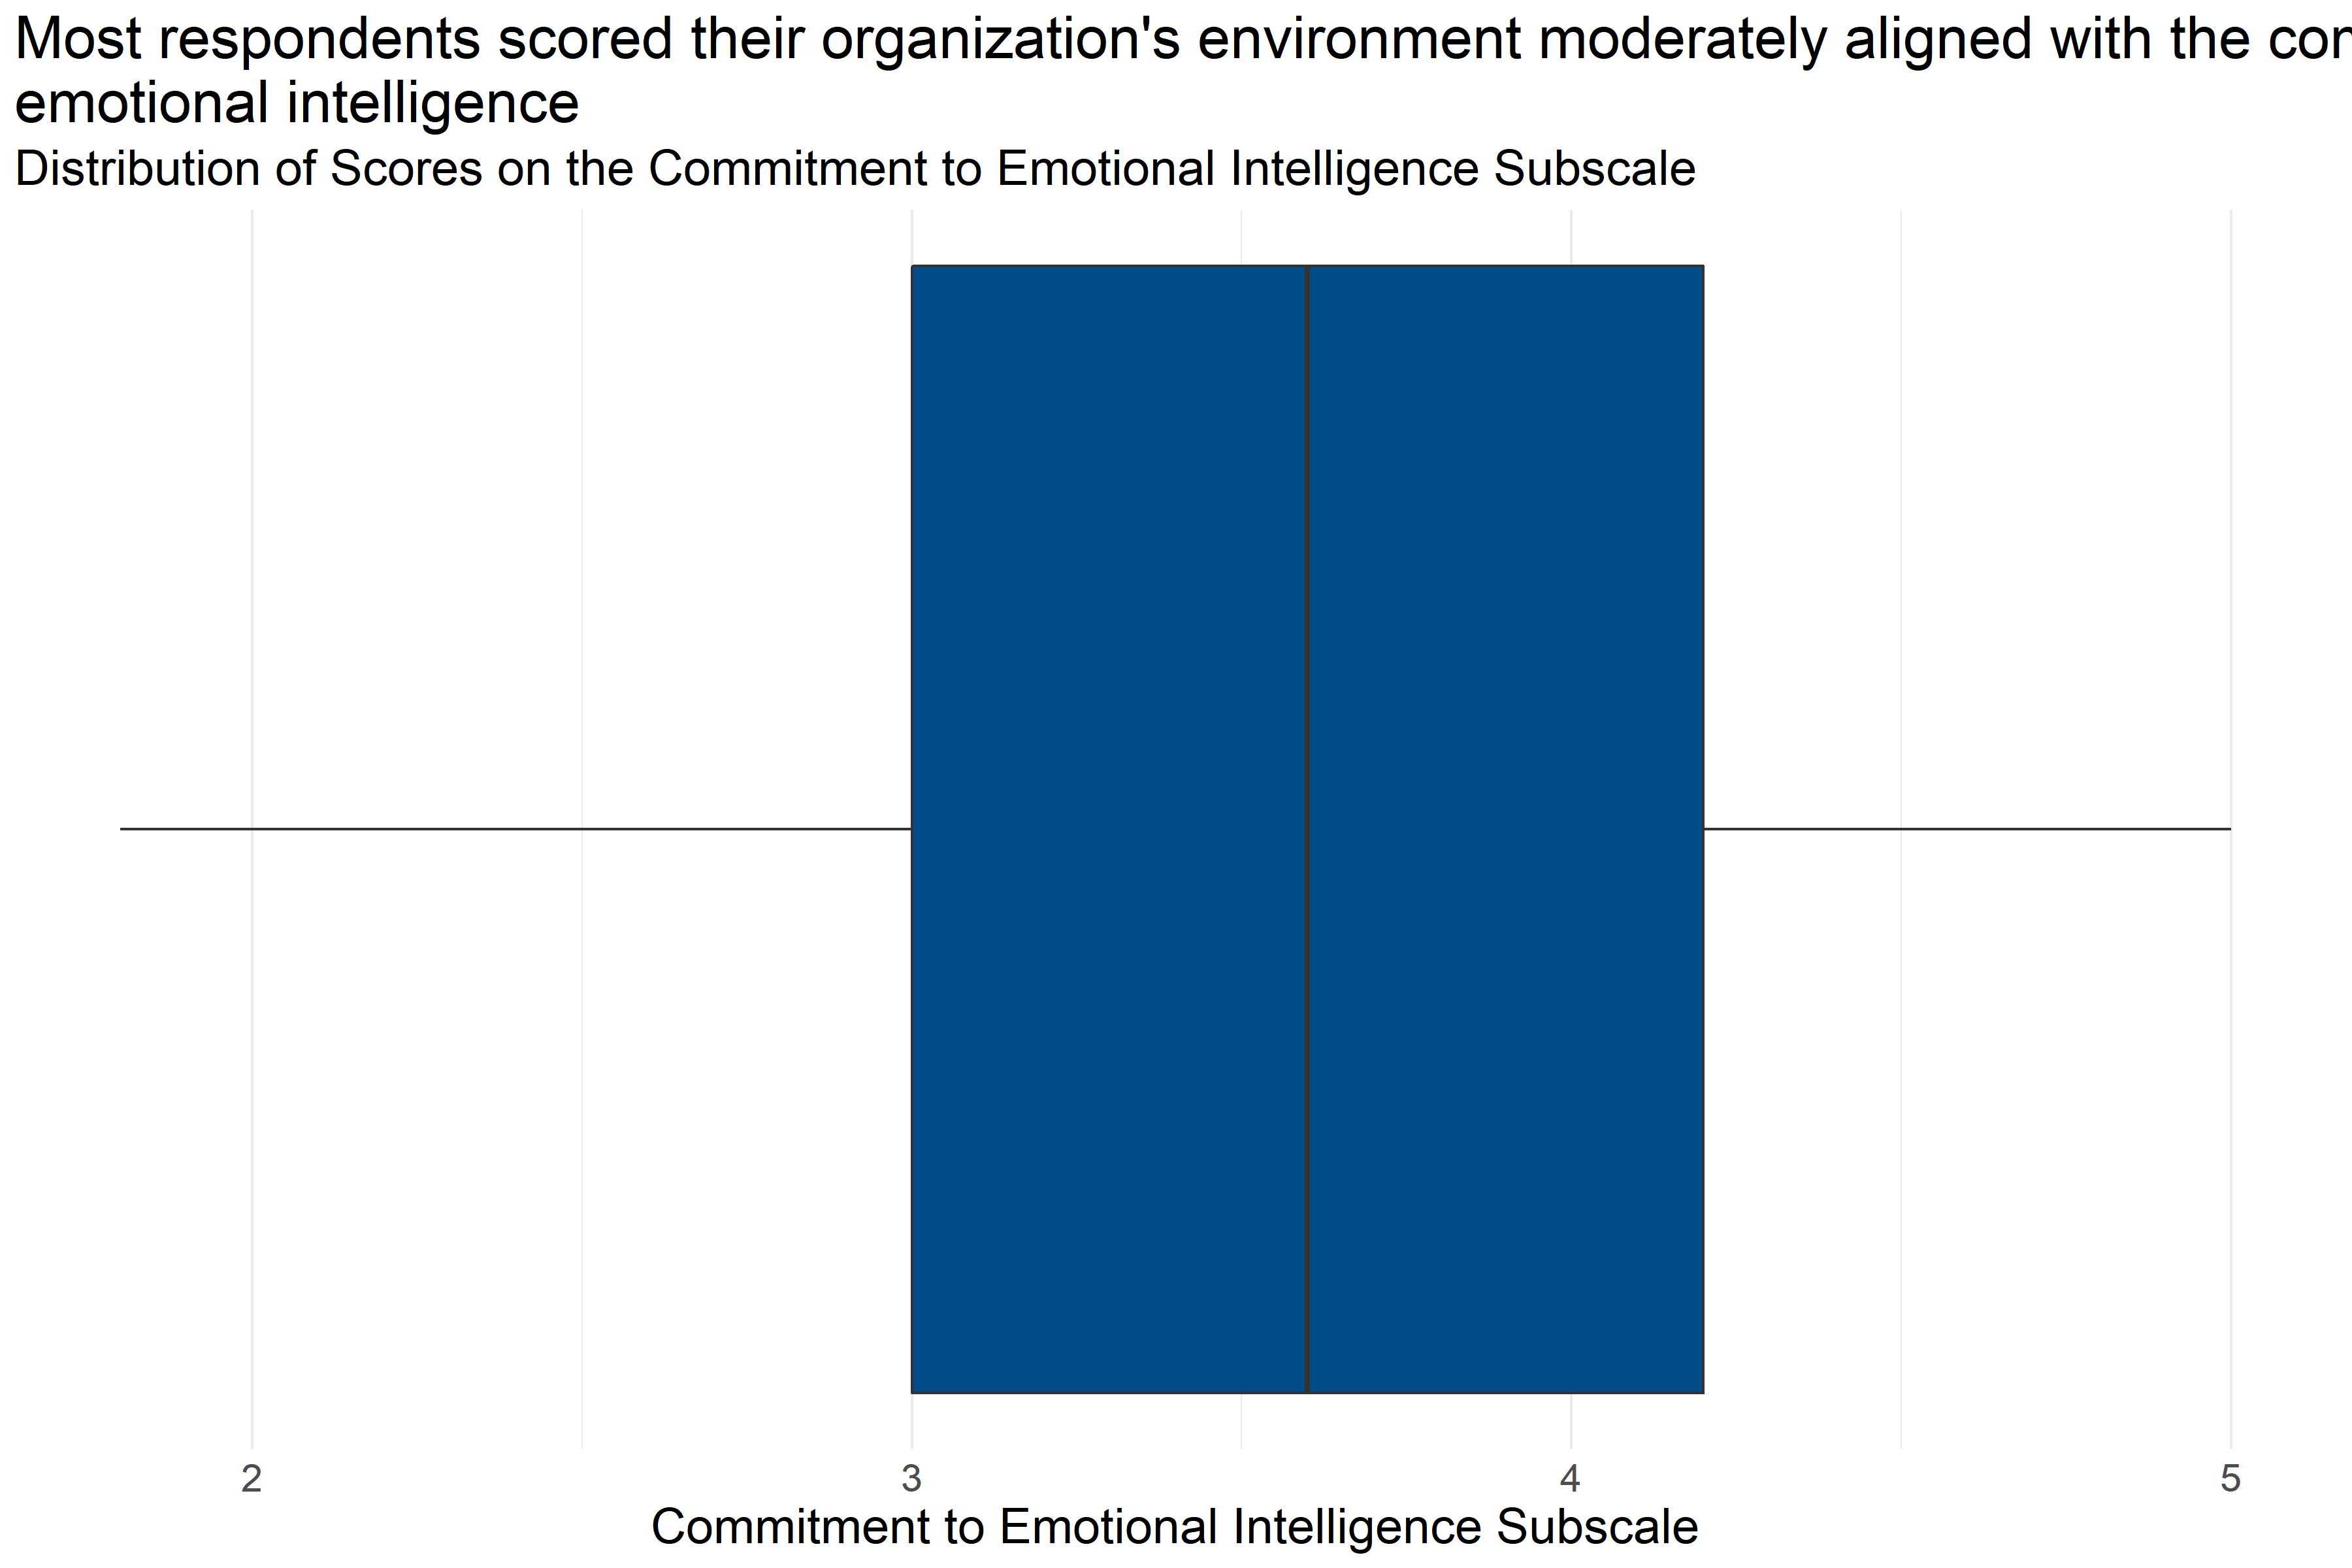
Figure 4.26: Boxplot of score distributions for Commitment to Emotional Intelligence Subscale
| Number of Answers | Average Score | Lowest Score | First Quartile | Median | Third Quartile | Highest Score |
|---|---|---|---|---|---|---|
| 226 | 3.64 | 1.8 | 3 | 3.6 | 4.2 | 5 |
Figure 4.26 and Table 4.29 provide information about how respondents scored on the Commitment to Emotional Intelligence Subscale. They provide the following information:
- Response: 226 respondents answered all questions in the scale.
- Average: The average score was 1.8.
- Range: Scores ranged from 3.64 to 5.
- Median: About half of respondents scored below 3.6 and half scored above 3.6.
- Interquartile Range: If the range of responses were cut into quarters, the middle half of respondents (between the first and third quartiles) scored between 3 and 4.2.
This means that more than half of respondents generally answered that they neither agreed nor disagreed or agreed with statements about the alignment of their organization’s commitment to emotional intelligence that were consistent with a Trauma Informed Model.
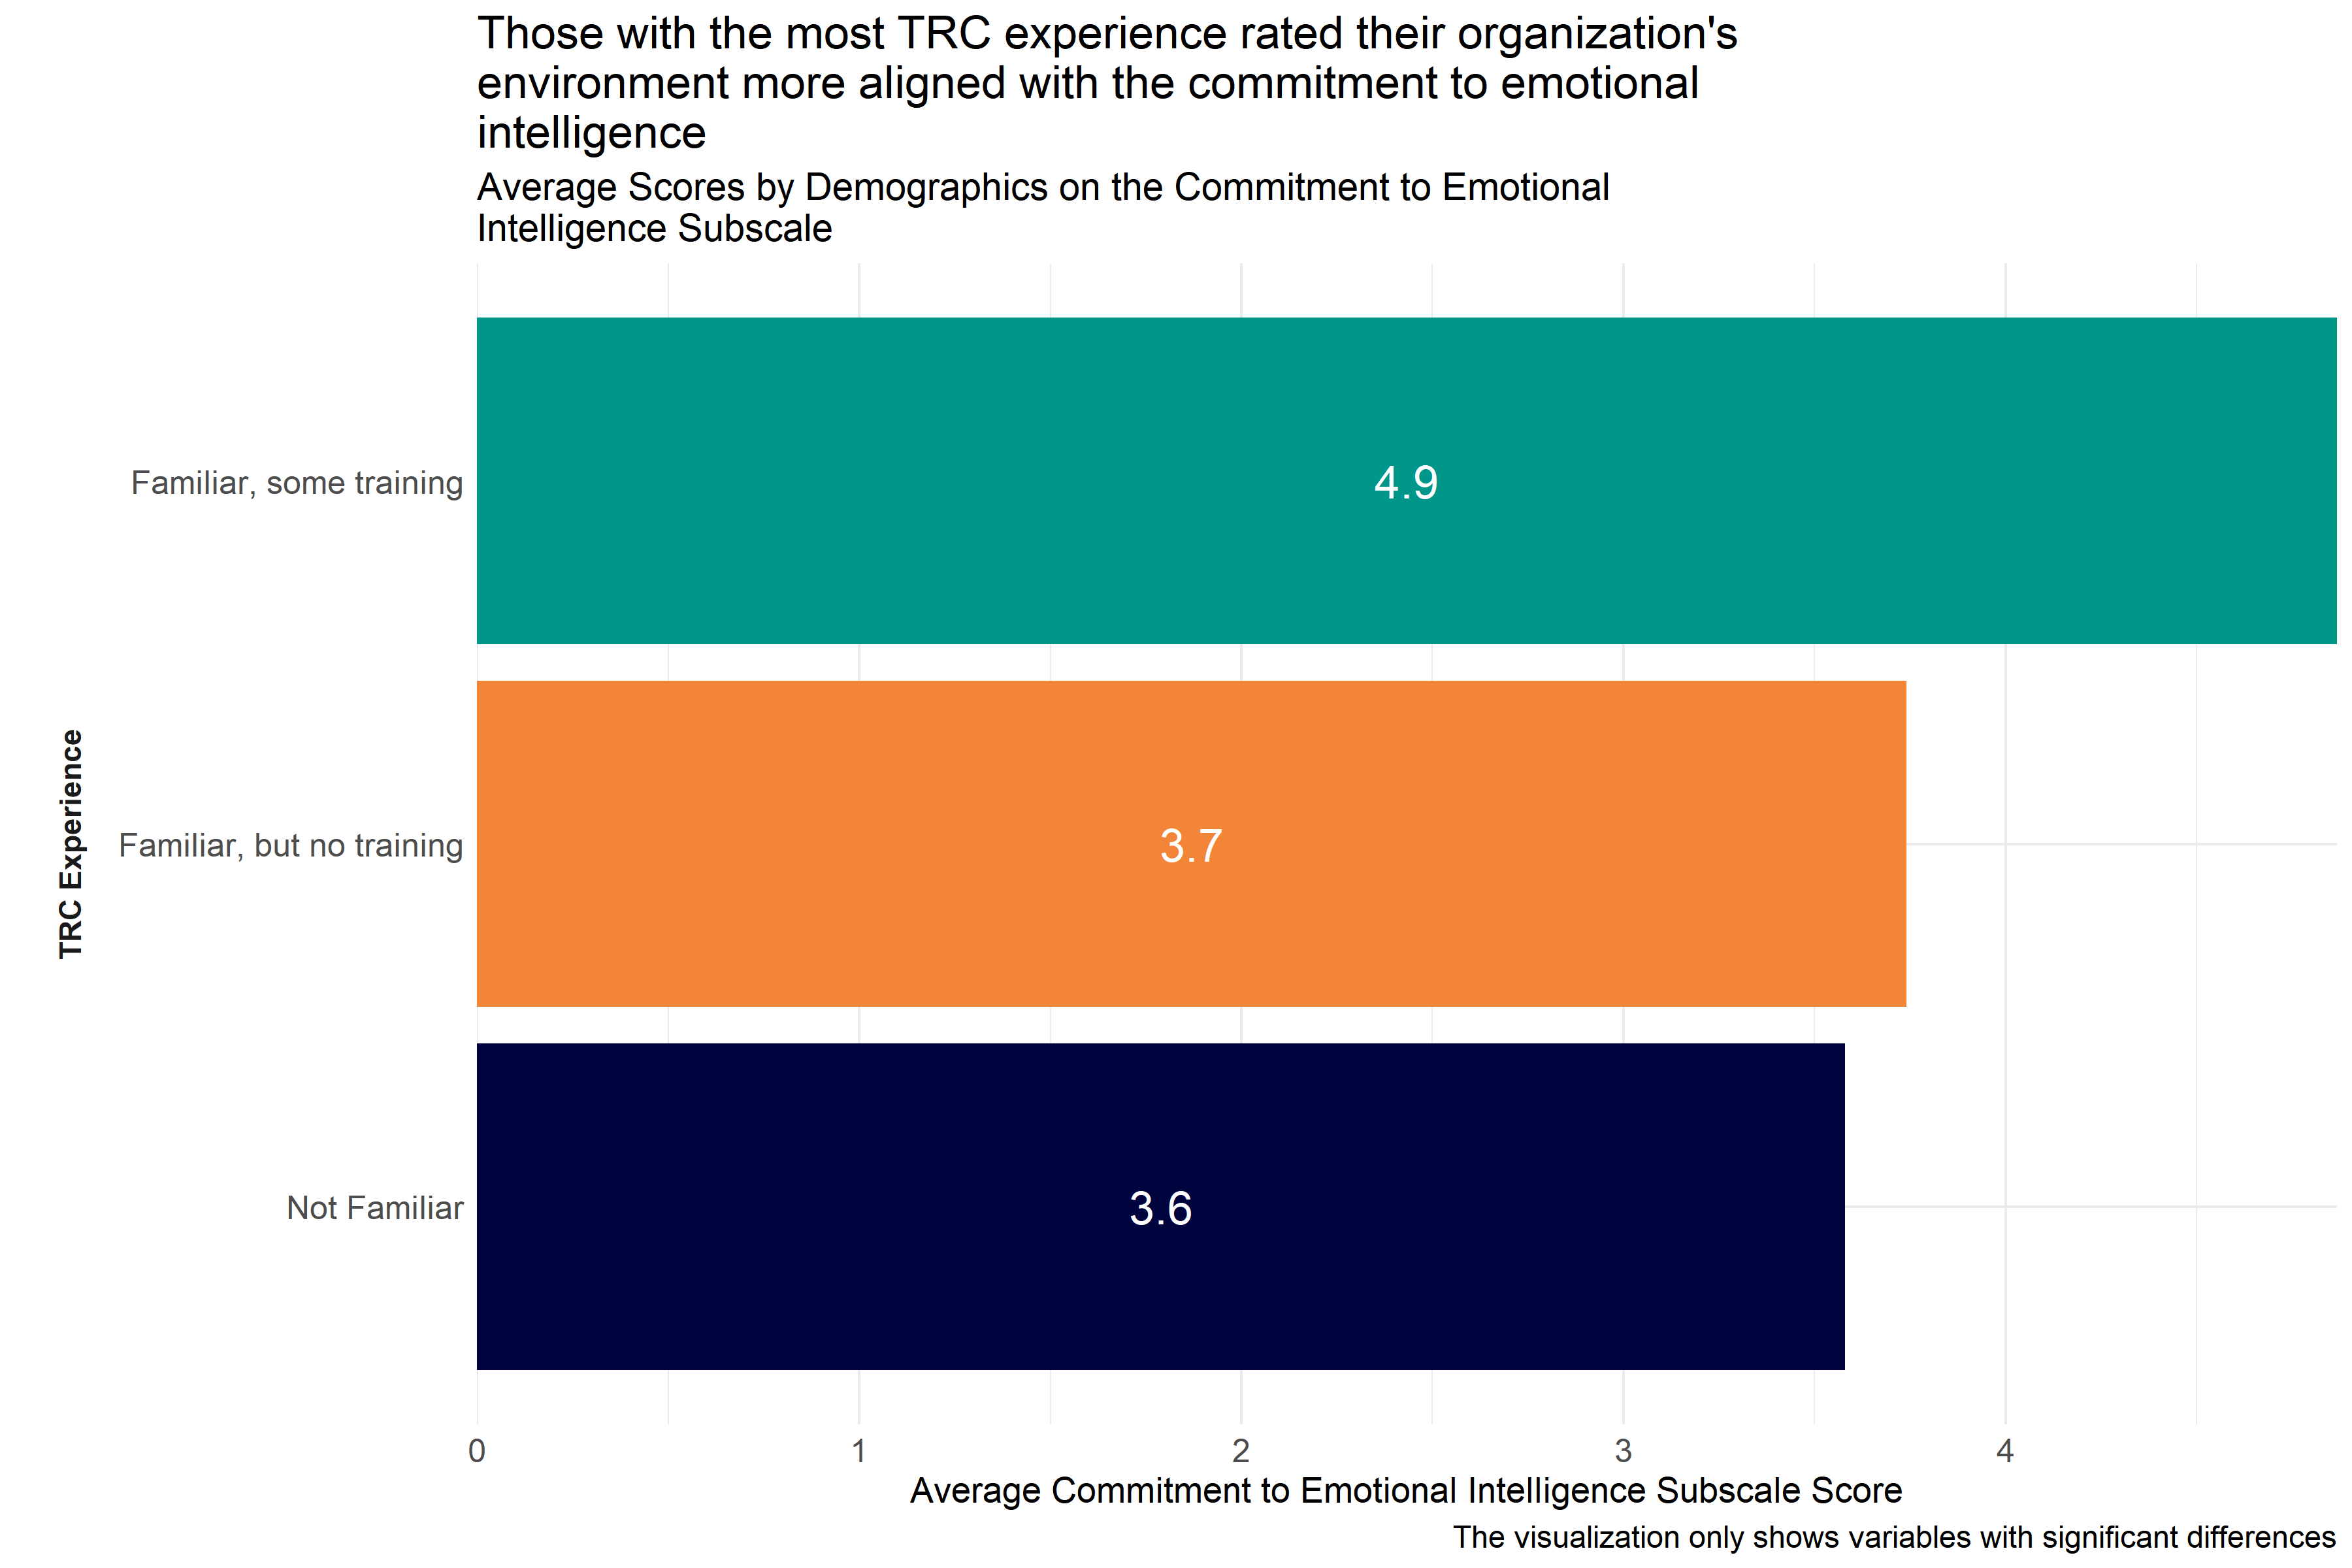
Figure 4.27: Average scores for Commitment to Emotional Intelligence Subscale across demographic groups
Analysts tested the average scores on the Commitment to Emotional Intelligence Subscale across demographic groups to identify differences in how respondents answered questions about how they perceived indications of their agencies’ commitment to emotional intelligence in a way that was consistent with the Trauma Informed Care model. As Figure 4.27 shows, those who identified themselves as “I am in the process of participating in the TRC staff training modules I have attended and completed the 3-day TRC leadership training” scored higher than respondents who had less experience with TRC. This suggests that those with more TRC experience are witnessing more alignment within their respective organizations towards a commitment to emotional intelligence.
Analysts also observed significant differences in responses across specific agencies, but did not include that information in Figure 4.27 to protect the privacy of those agencies.
4.5.4.7 Commitment to Social Learning
The Commitment to Social Learning Subscale of the Environmental Assessment Survey measures the extent to which the cultural and social environment at an agency aligns with the trauma-informed norm and value of commitment to social learning. Survey participants responded to statements like “There is an expectation that leaders, staff and clients will learn from everyday experience and from each other.” and “All major decisions are made using a team approach.” on a scale of 1 “Strongly Disagree” to 5 “Strongly Agree.” Individual responses to each of the questions in this scale can be found in Appendix B: Detailed Question Responses by Scale. Low scores on this scale indicate that the organization’s environment is less aligned with the commitment to social learning.
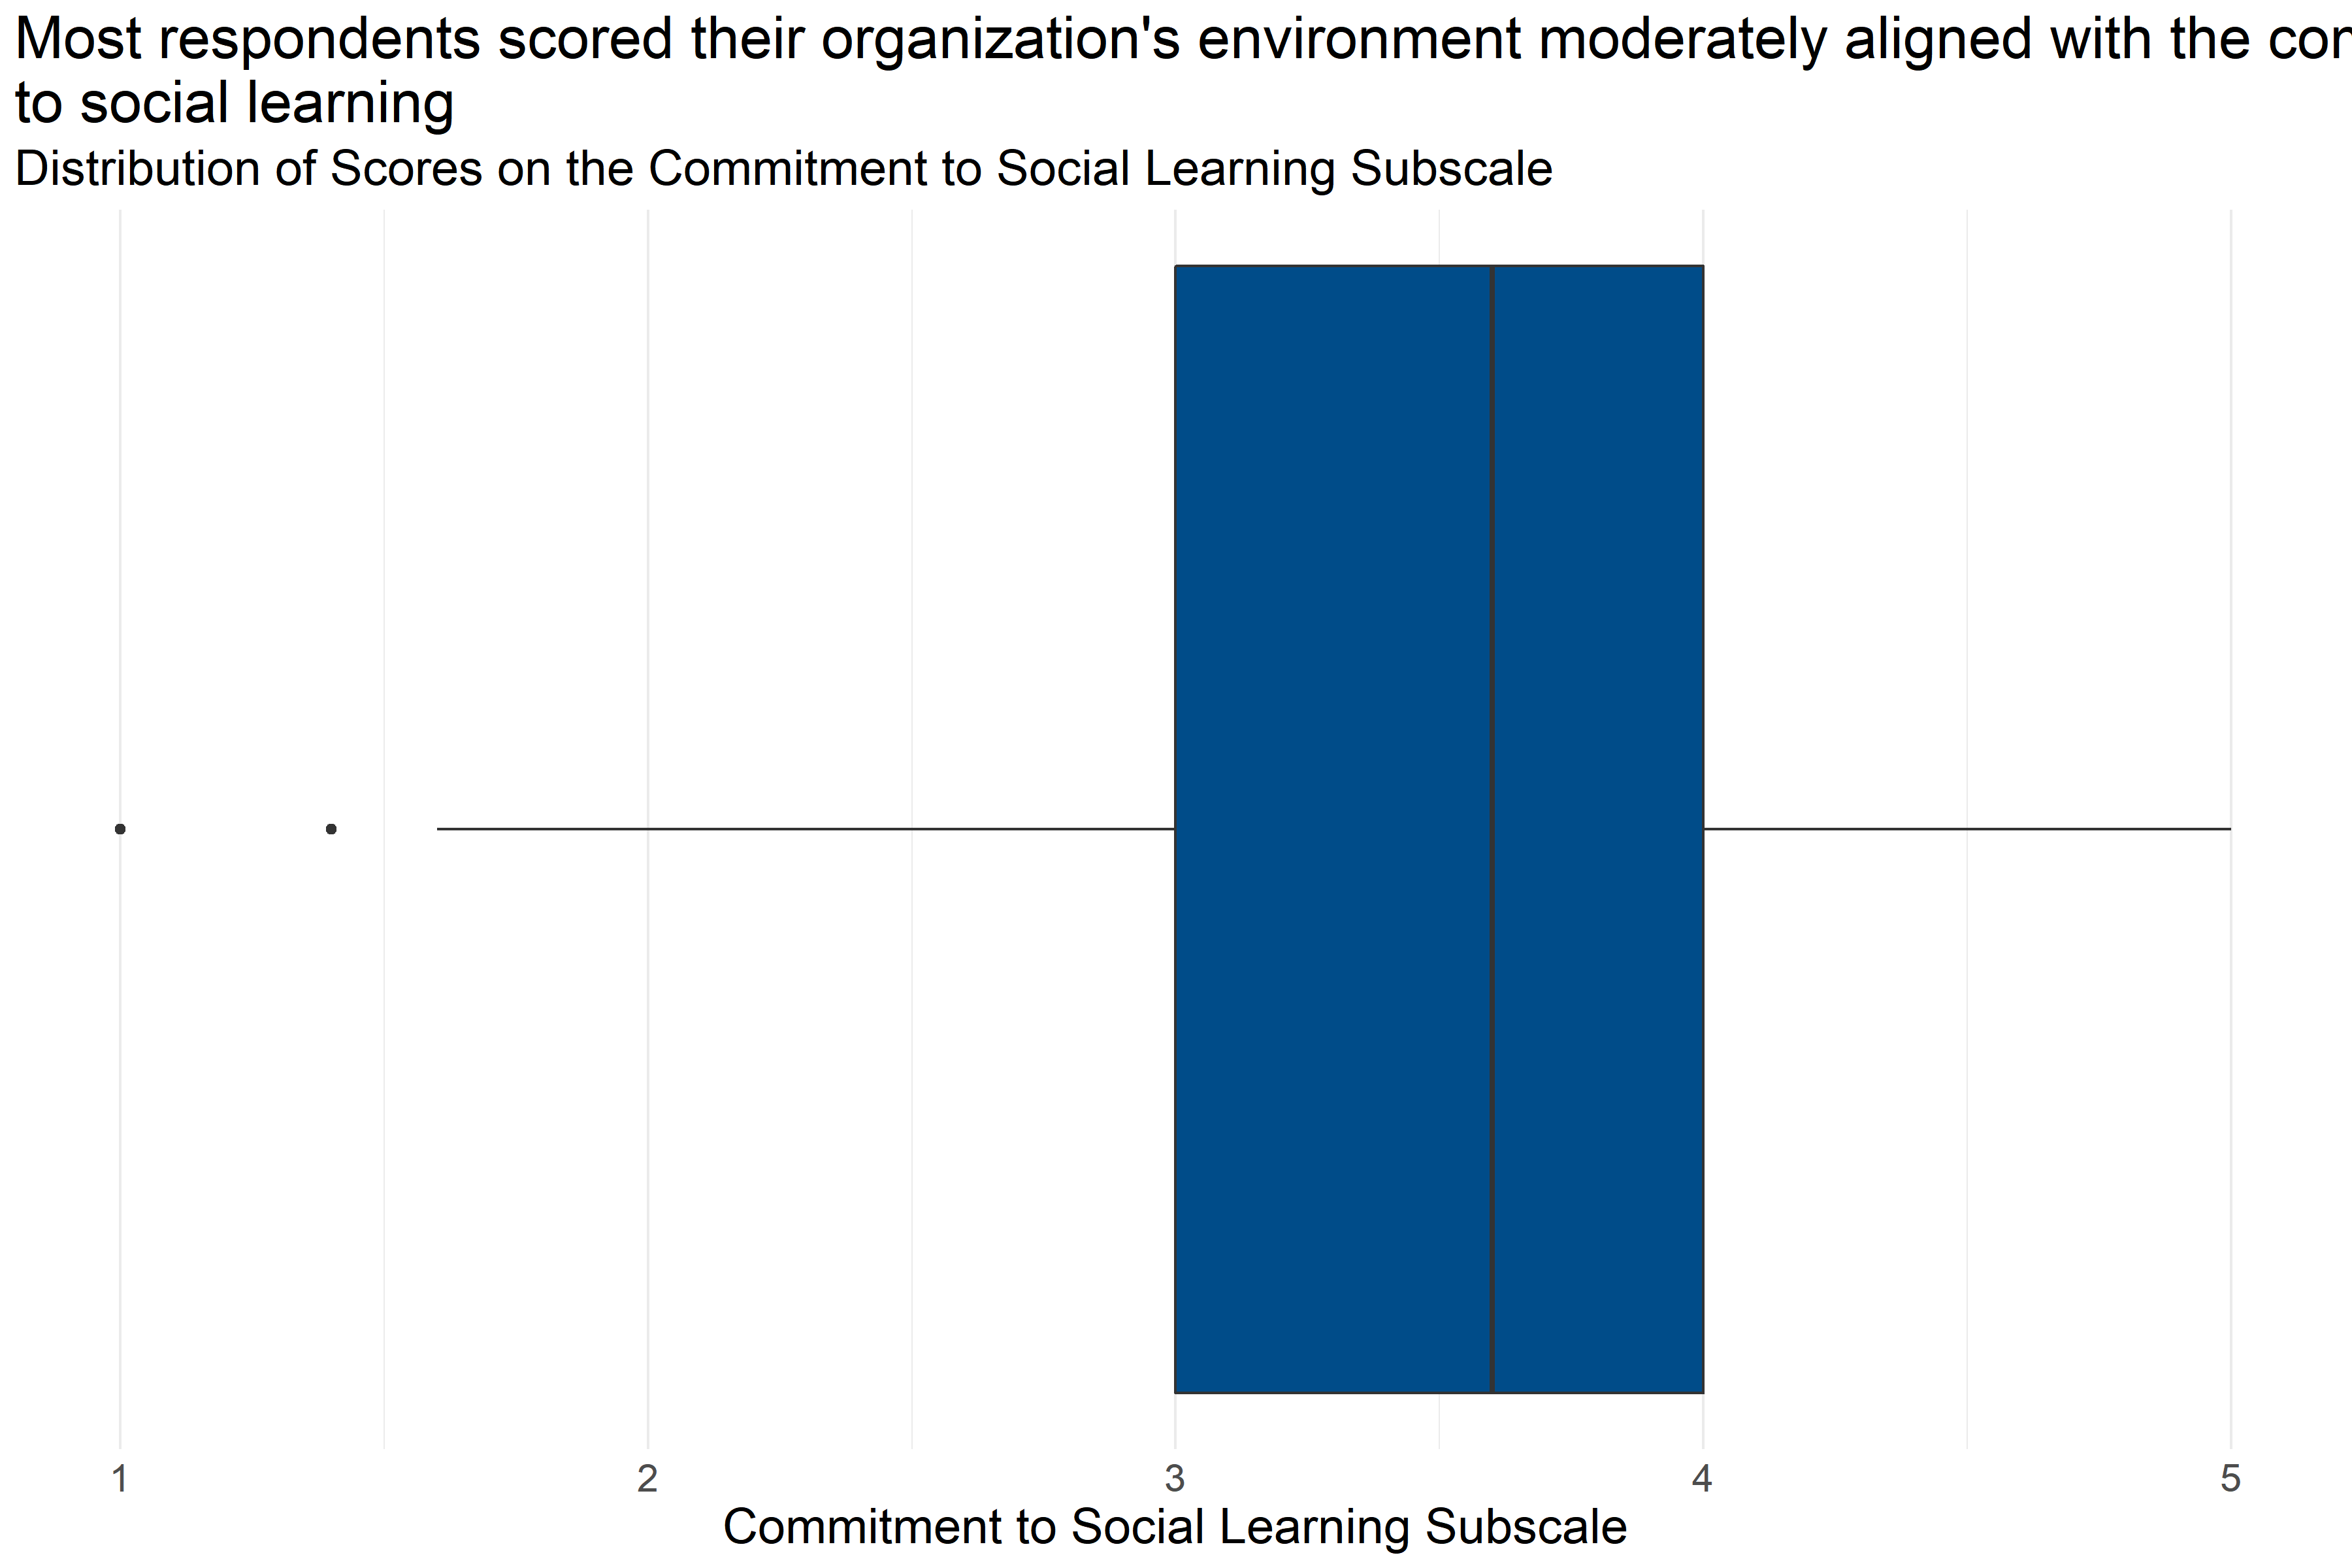
Figure 4.28: Boxplot of score distributions for Commitment to Social Learning Subscale
| Number of Answers | Average Score | Lowest Score | First Quartile | Median | Third Quartile | Highest Score |
|---|---|---|---|---|---|---|
| 216 | 3.54 | 1 | 3 | 3.6 | 4 | 5 |
Figure 4.28 and Table 4.30 provide information about how respondents scored on the Commitment to Social Learning Subscale. They provide the following information:
- Response: 216 respondents answered all questions in the scale.
- Average: The average score was 1.
- Range: Scores ranged from 3.54 to 5.
- Median: About half of respondents scored below 3.6 and half scored above 3.6.
- Interquartile Range: If the range of responses were cut into quarters, the middle half of respondents (between the first and third quartiles) scored between 3 and 4.
This means that more than half of respondents generally answered that they neither agreed nor disagreed or agreed with statements about the alignment of their organization’s commitment to social learning that were consistent with a Trauma Informed Model.
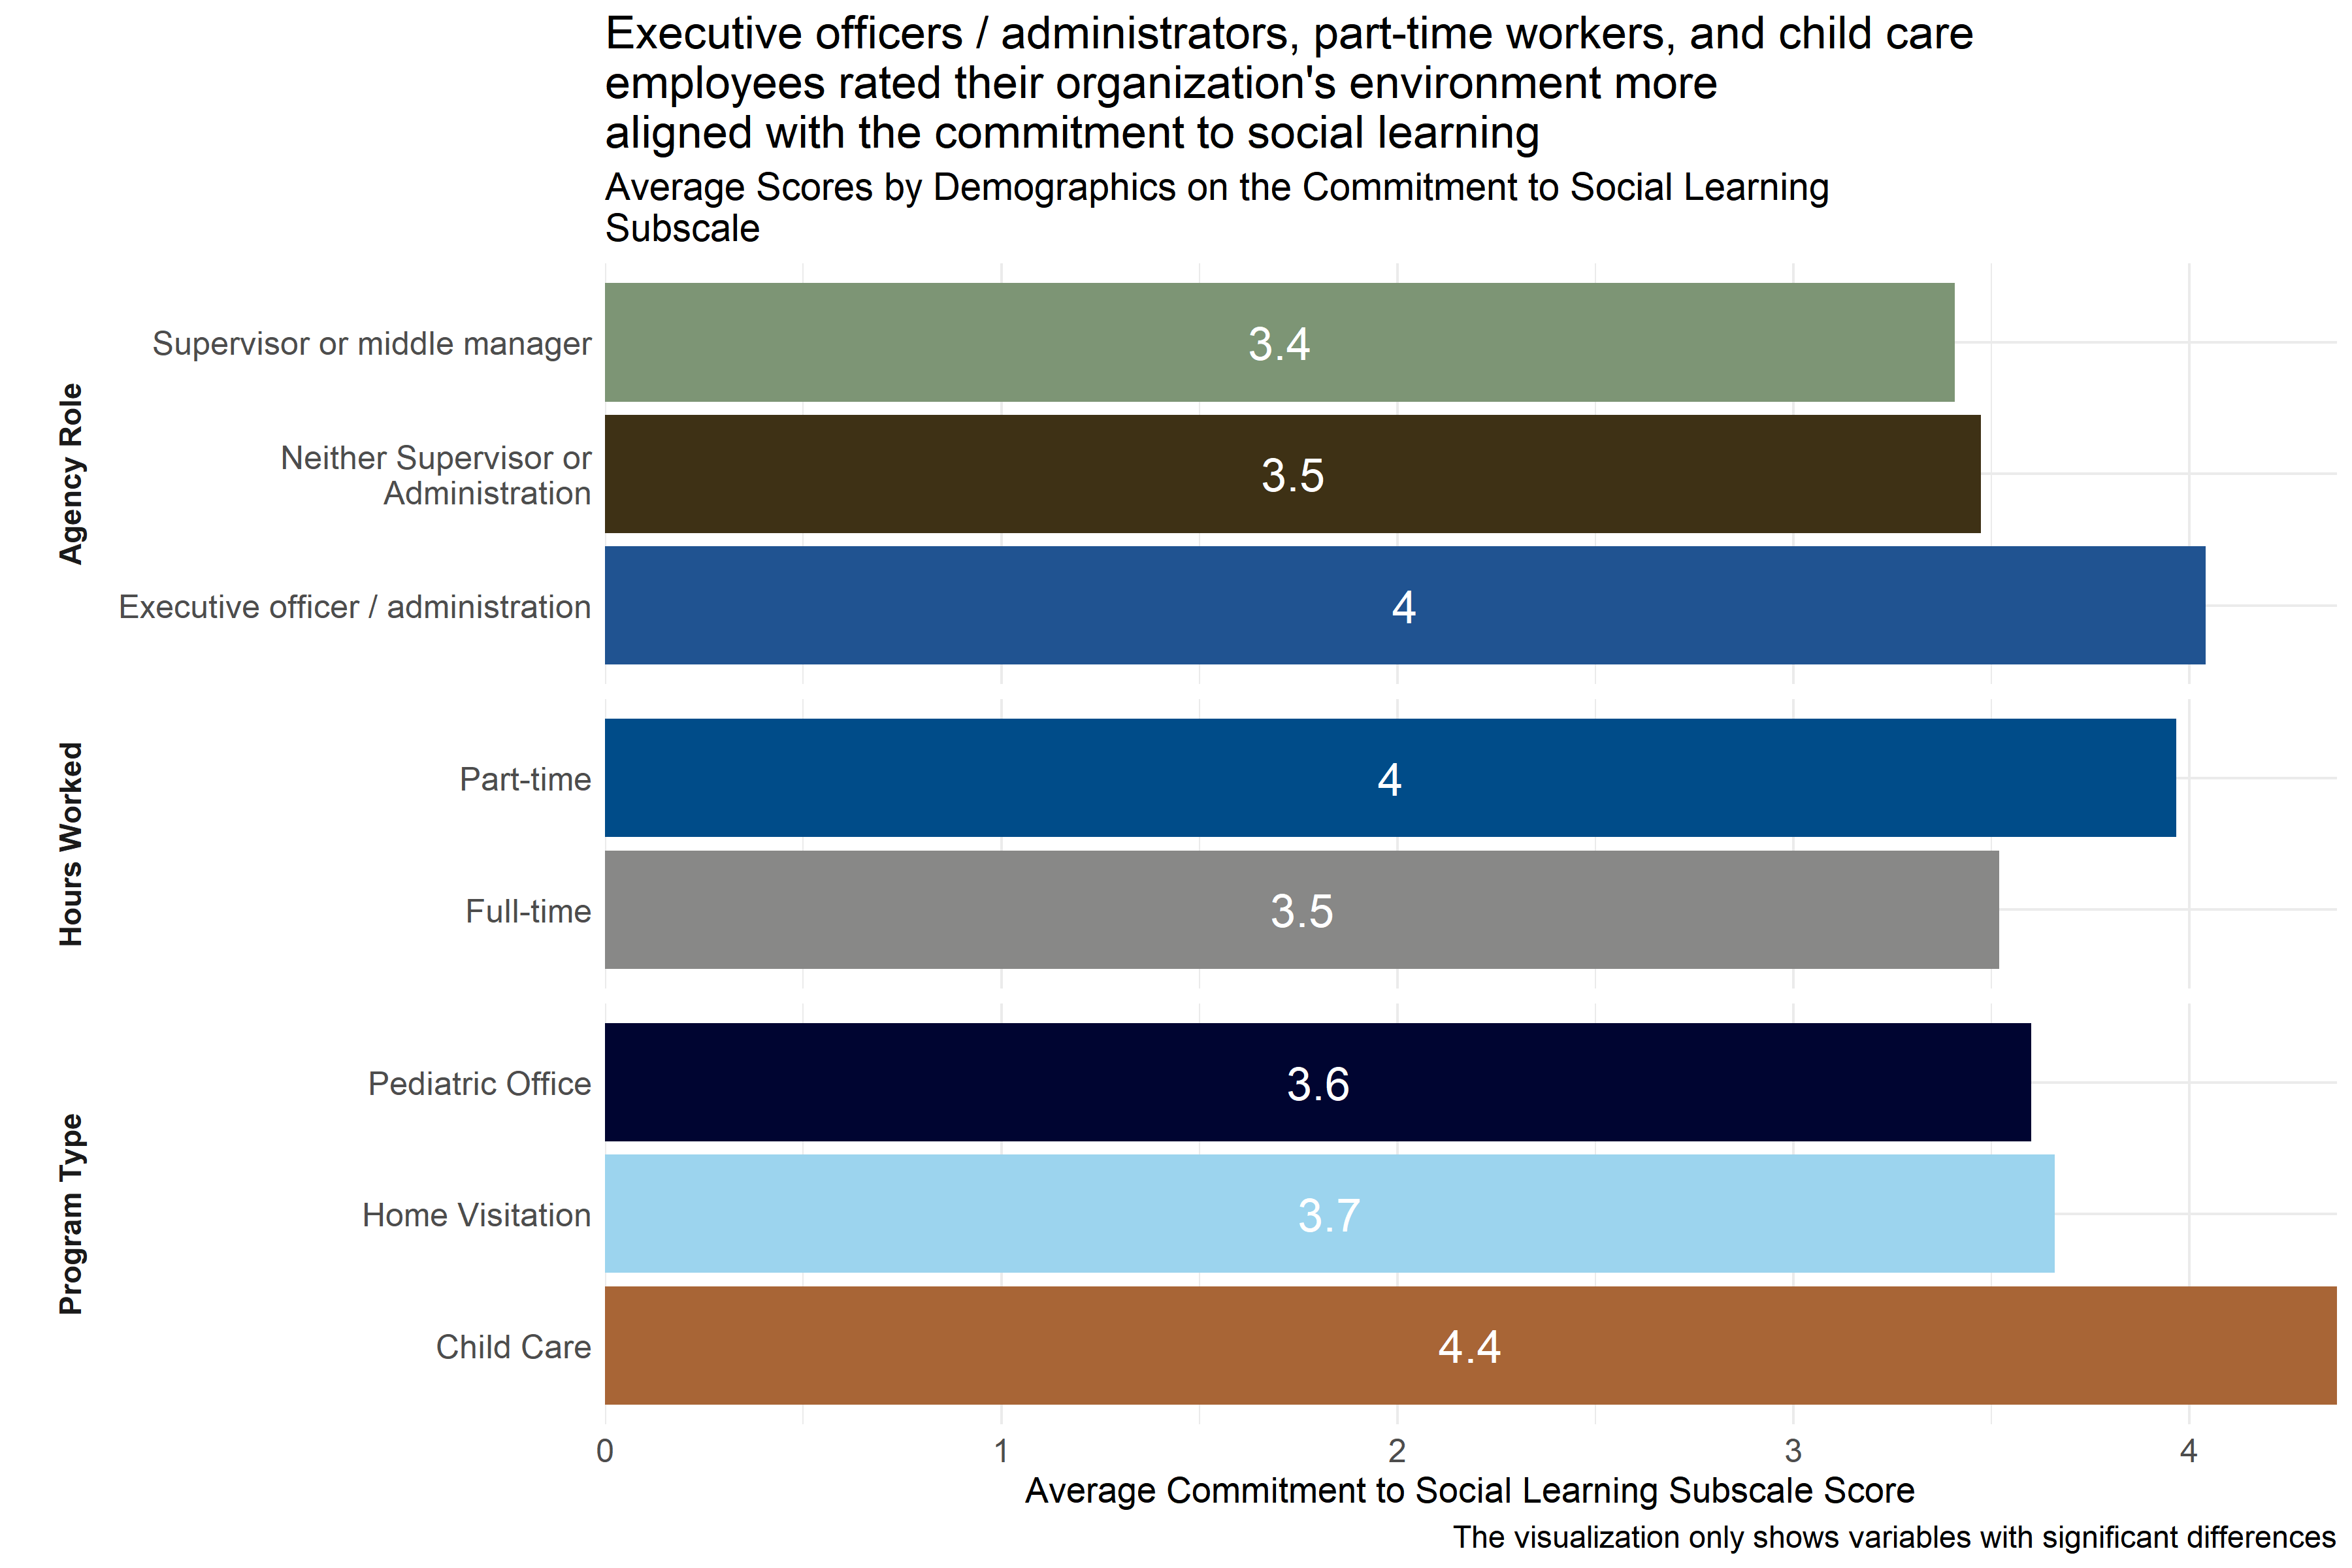
Figure 4.29: Average scores for Commitment to Social Learning Subscale across demographic groups
Analysts tested the average scores on the Commitment to Social Learning Subscale across demographic groups to identify differences in how respondents answered questions about how they perceived indications of their agencies’ commitment to social learning in a way that was consistent with the Trauma Informed Care model. As Figure 4.29 shows, there were differences in responses from respondents in different agency roles, hours worked per week, and program types. Executive officers / administrators scored higher than respondents in other agency roles. In addition, part-time workers scored higher than full-time workers, and employees of child care facilities scored higher than those at home visitation agencies. This suggests that executive officers / administrators, part-time workers, and child care employees are experiencing more alignment within their respective organizations towards a commitment to social learning.
Analysts also observed significant differences in responses across specific agencies, but did not include that information in Figure 4.29 to protect the privacy of those agencies.
4.5.4.8 Commitment to Shared Governance
The Commitment to Shared Governance Subscale of the Environmental Assessment Survey measures the extent to which the cultural and social environment at an agency aligns with the trauma-informed norm and value of commitment to shared governance. Survey participants responded to statements like “I feel I can openly question or disagree with decisions made by administrators, managers, or other staff if needed.” and “Policies, procedures, and practices are reviewed regularly by staff at all levels.” on a scale of 1 “Strongly Disagree” to 5 “Strongly Agree.” Individual responses to each of the questions in this scale can be found in Appendix B: Detailed Question Responses by Scale. Low scores on this scale indicate that the organization’s environment is less aligned with the commitment to shared governance.

Figure 4.30: Boxplot of score distributions for Commitment to Shared Governance Subscale
| Number of Answers | Average Score | Lowest Score | First Quartile | Median | Third Quartile | Highest Score |
|---|---|---|---|---|---|---|
| 209 | 3.33 | 1 | 2.8 | 3.4 | 4 | 5 |
Figure 4.30 and Table 4.31 provide information about how respondents scored on the Commitment to Shared Governance Subscale. They provide the following information:
- Response: 209 respondents answered all questions in the scale.
- Average: The average score was 1.
- Range: Scores ranged from 3.33 to 5.
- Median: About half of respondents scored below 3.4 and half scored above 3.4.
- Interquartile Range: If the range of responses were cut into quarters, the middle half of respondents (between the first and third quartiles) scored between 2.8 and 4.
This means that more than half of respondents generally answered that they neither agreed nor disagreed or agreed with statements about the alignment of their organization’s commitment to shared governance that were consistent with a Trauma Informed Model.
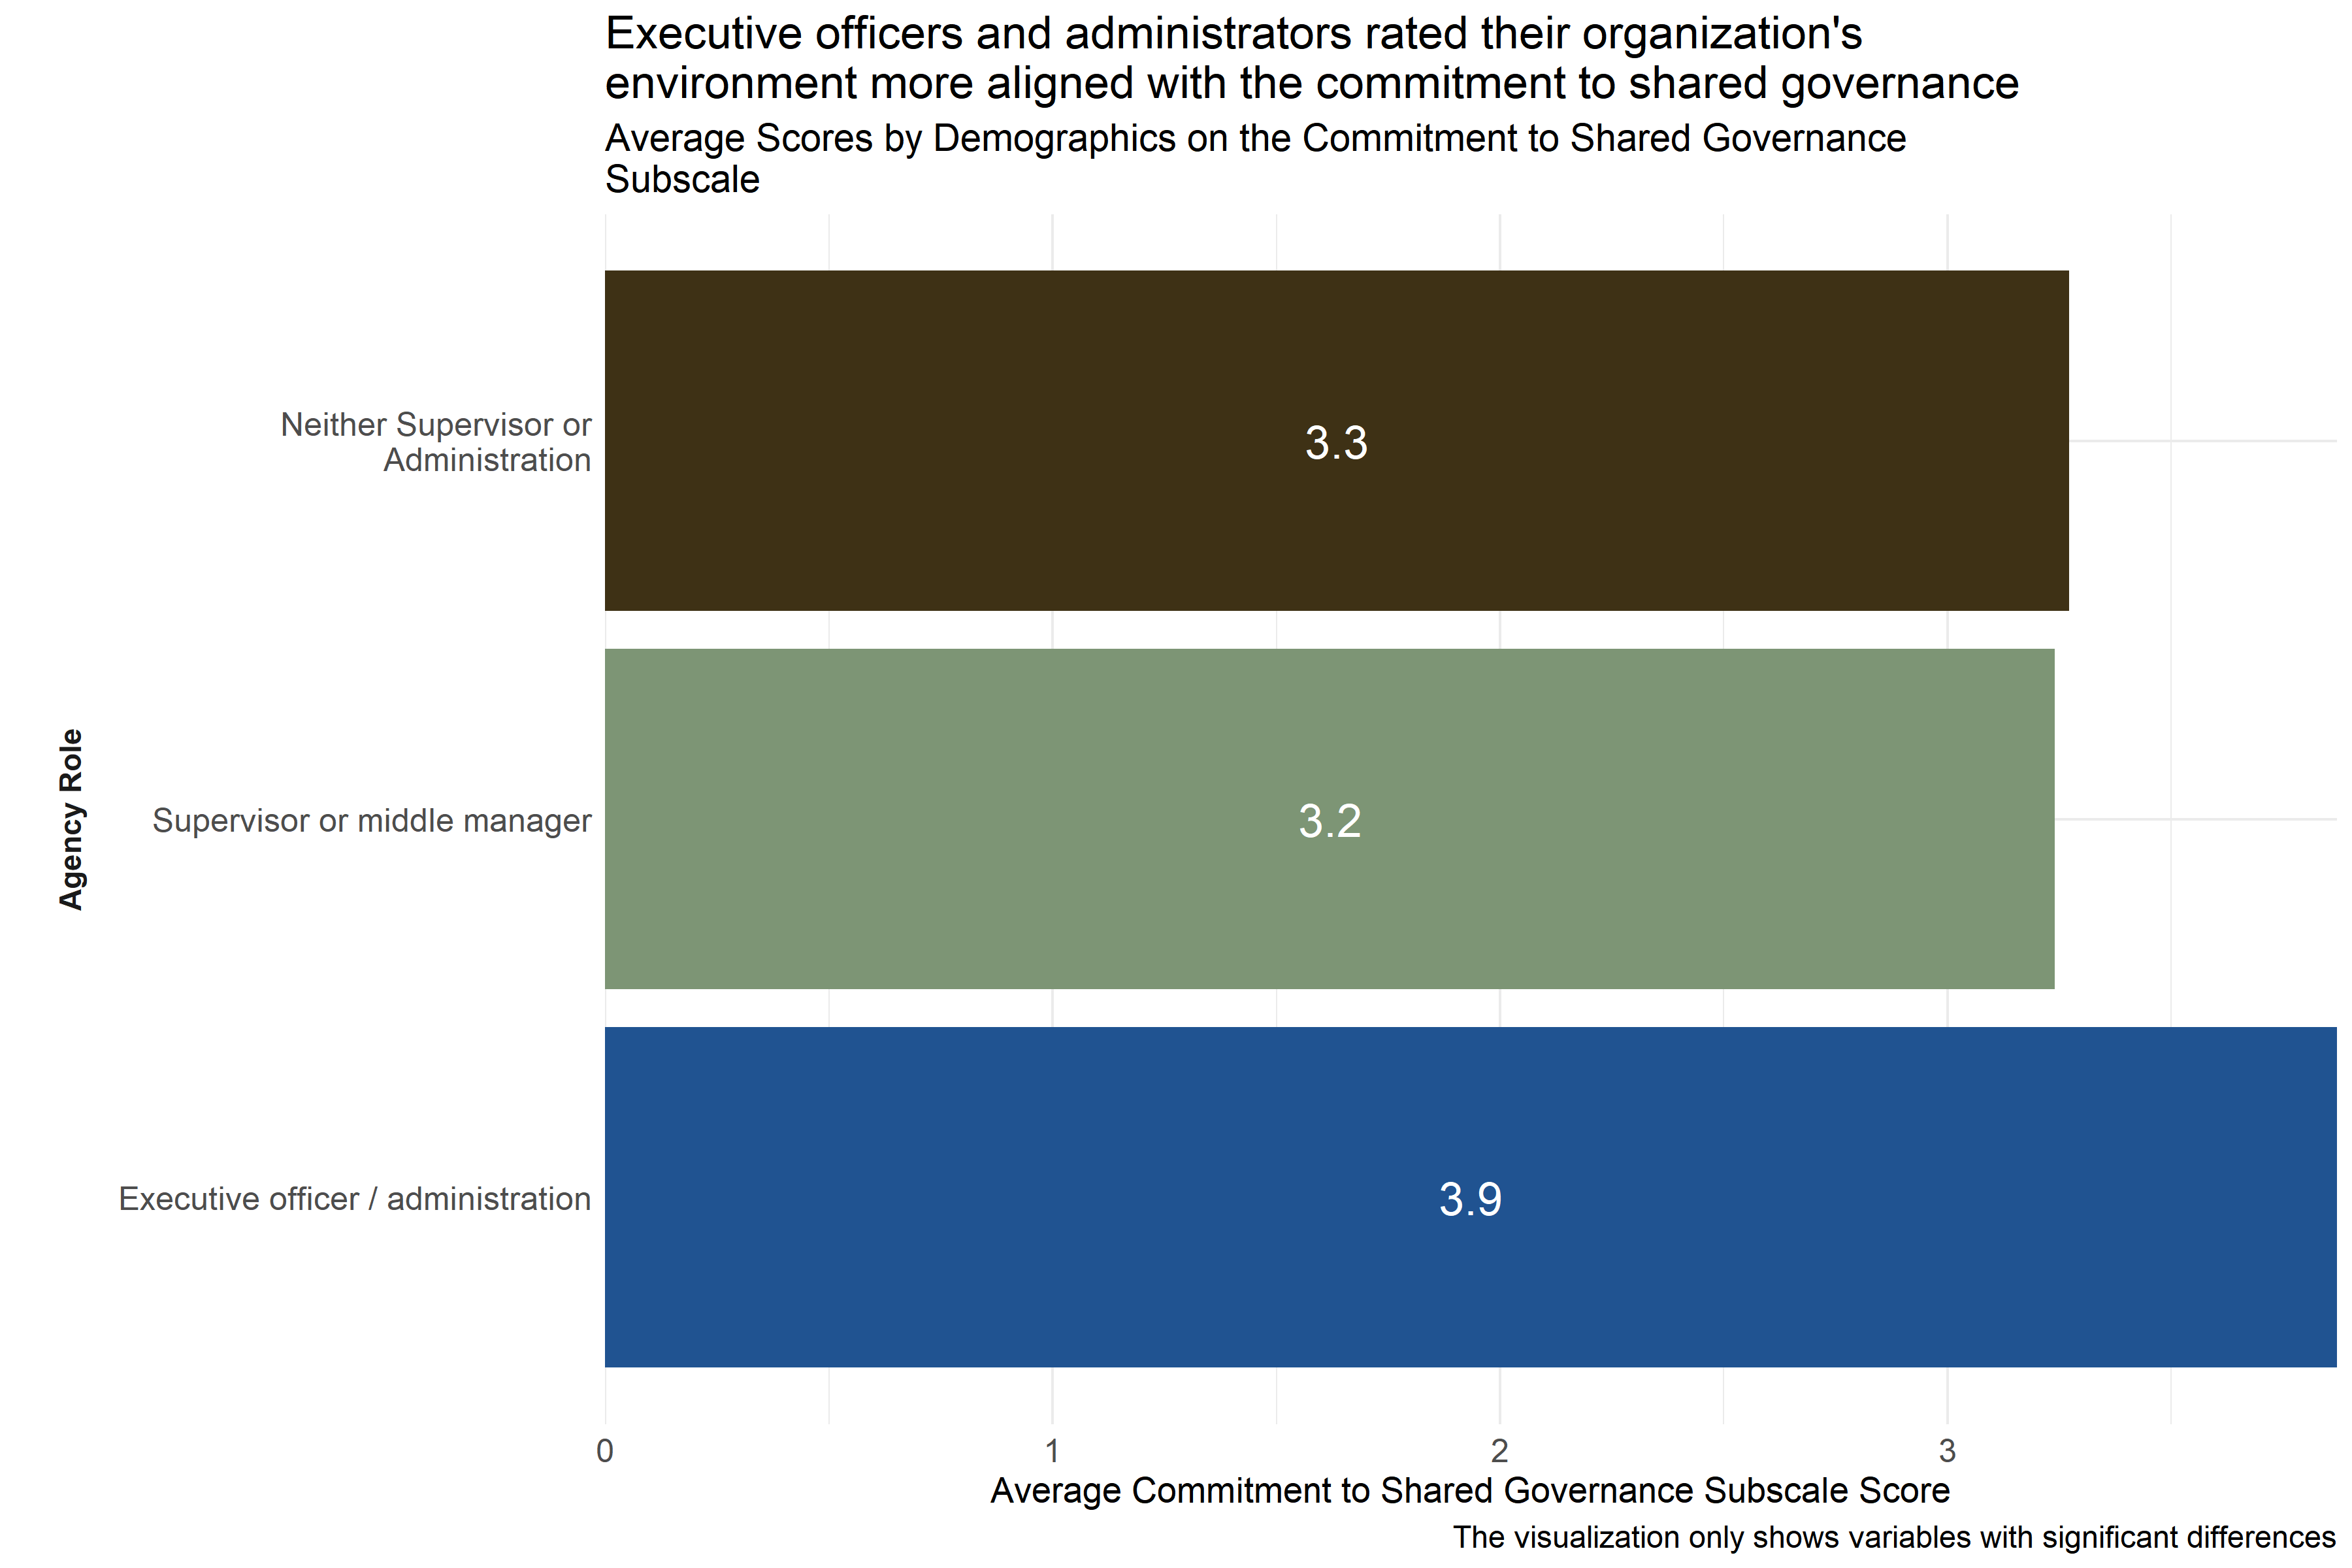
Figure 4.31: Average scores for Commitment to Shared Governance Subscale across demographic groups
Analysts tested the average scores on the Commitment to Shared Governance Subscale across demographic groups to identify differences in how respondents answered questions about how they perceived indications of their agencies’ commitment to shared governance in a way that was consistent with the Trauma Informed Care model. As Figure 4.31 shows, executive officers / administrators scored higher than respondents in other agency roles. This suggests that executive officers / administrators are experiencing more alignment within their respective organizations towards a commitment to shared governance.
Analysts also observed significant differences in responses across specific agencies, but did not include that information in Figure 4.31 to protect the privacy of those agencies.
4.5.4.9 Commitment to Open Communication
The Commitment to Open Communication Subscale of the Environmental Assessment Survey measures the extent to which the cultural and social environment at an agency aligns with the trauma-informed norm and value of commitment to open communication. Survey participants responded to statements like “The schedule of program activities and events are available and accessible to clients and staff.” and “All staff are aware of decisions made around policies and procedures.” on a scale of 1 “Strongly Disagree” to 5 “Strongly Agree.” Individual responses to each of the questions in this scale can be found in Appendix B: Detailed Question Responses by Scale. Low scores on this scale indicate that the organization’s environment is less aligned with the commitment to open communication.
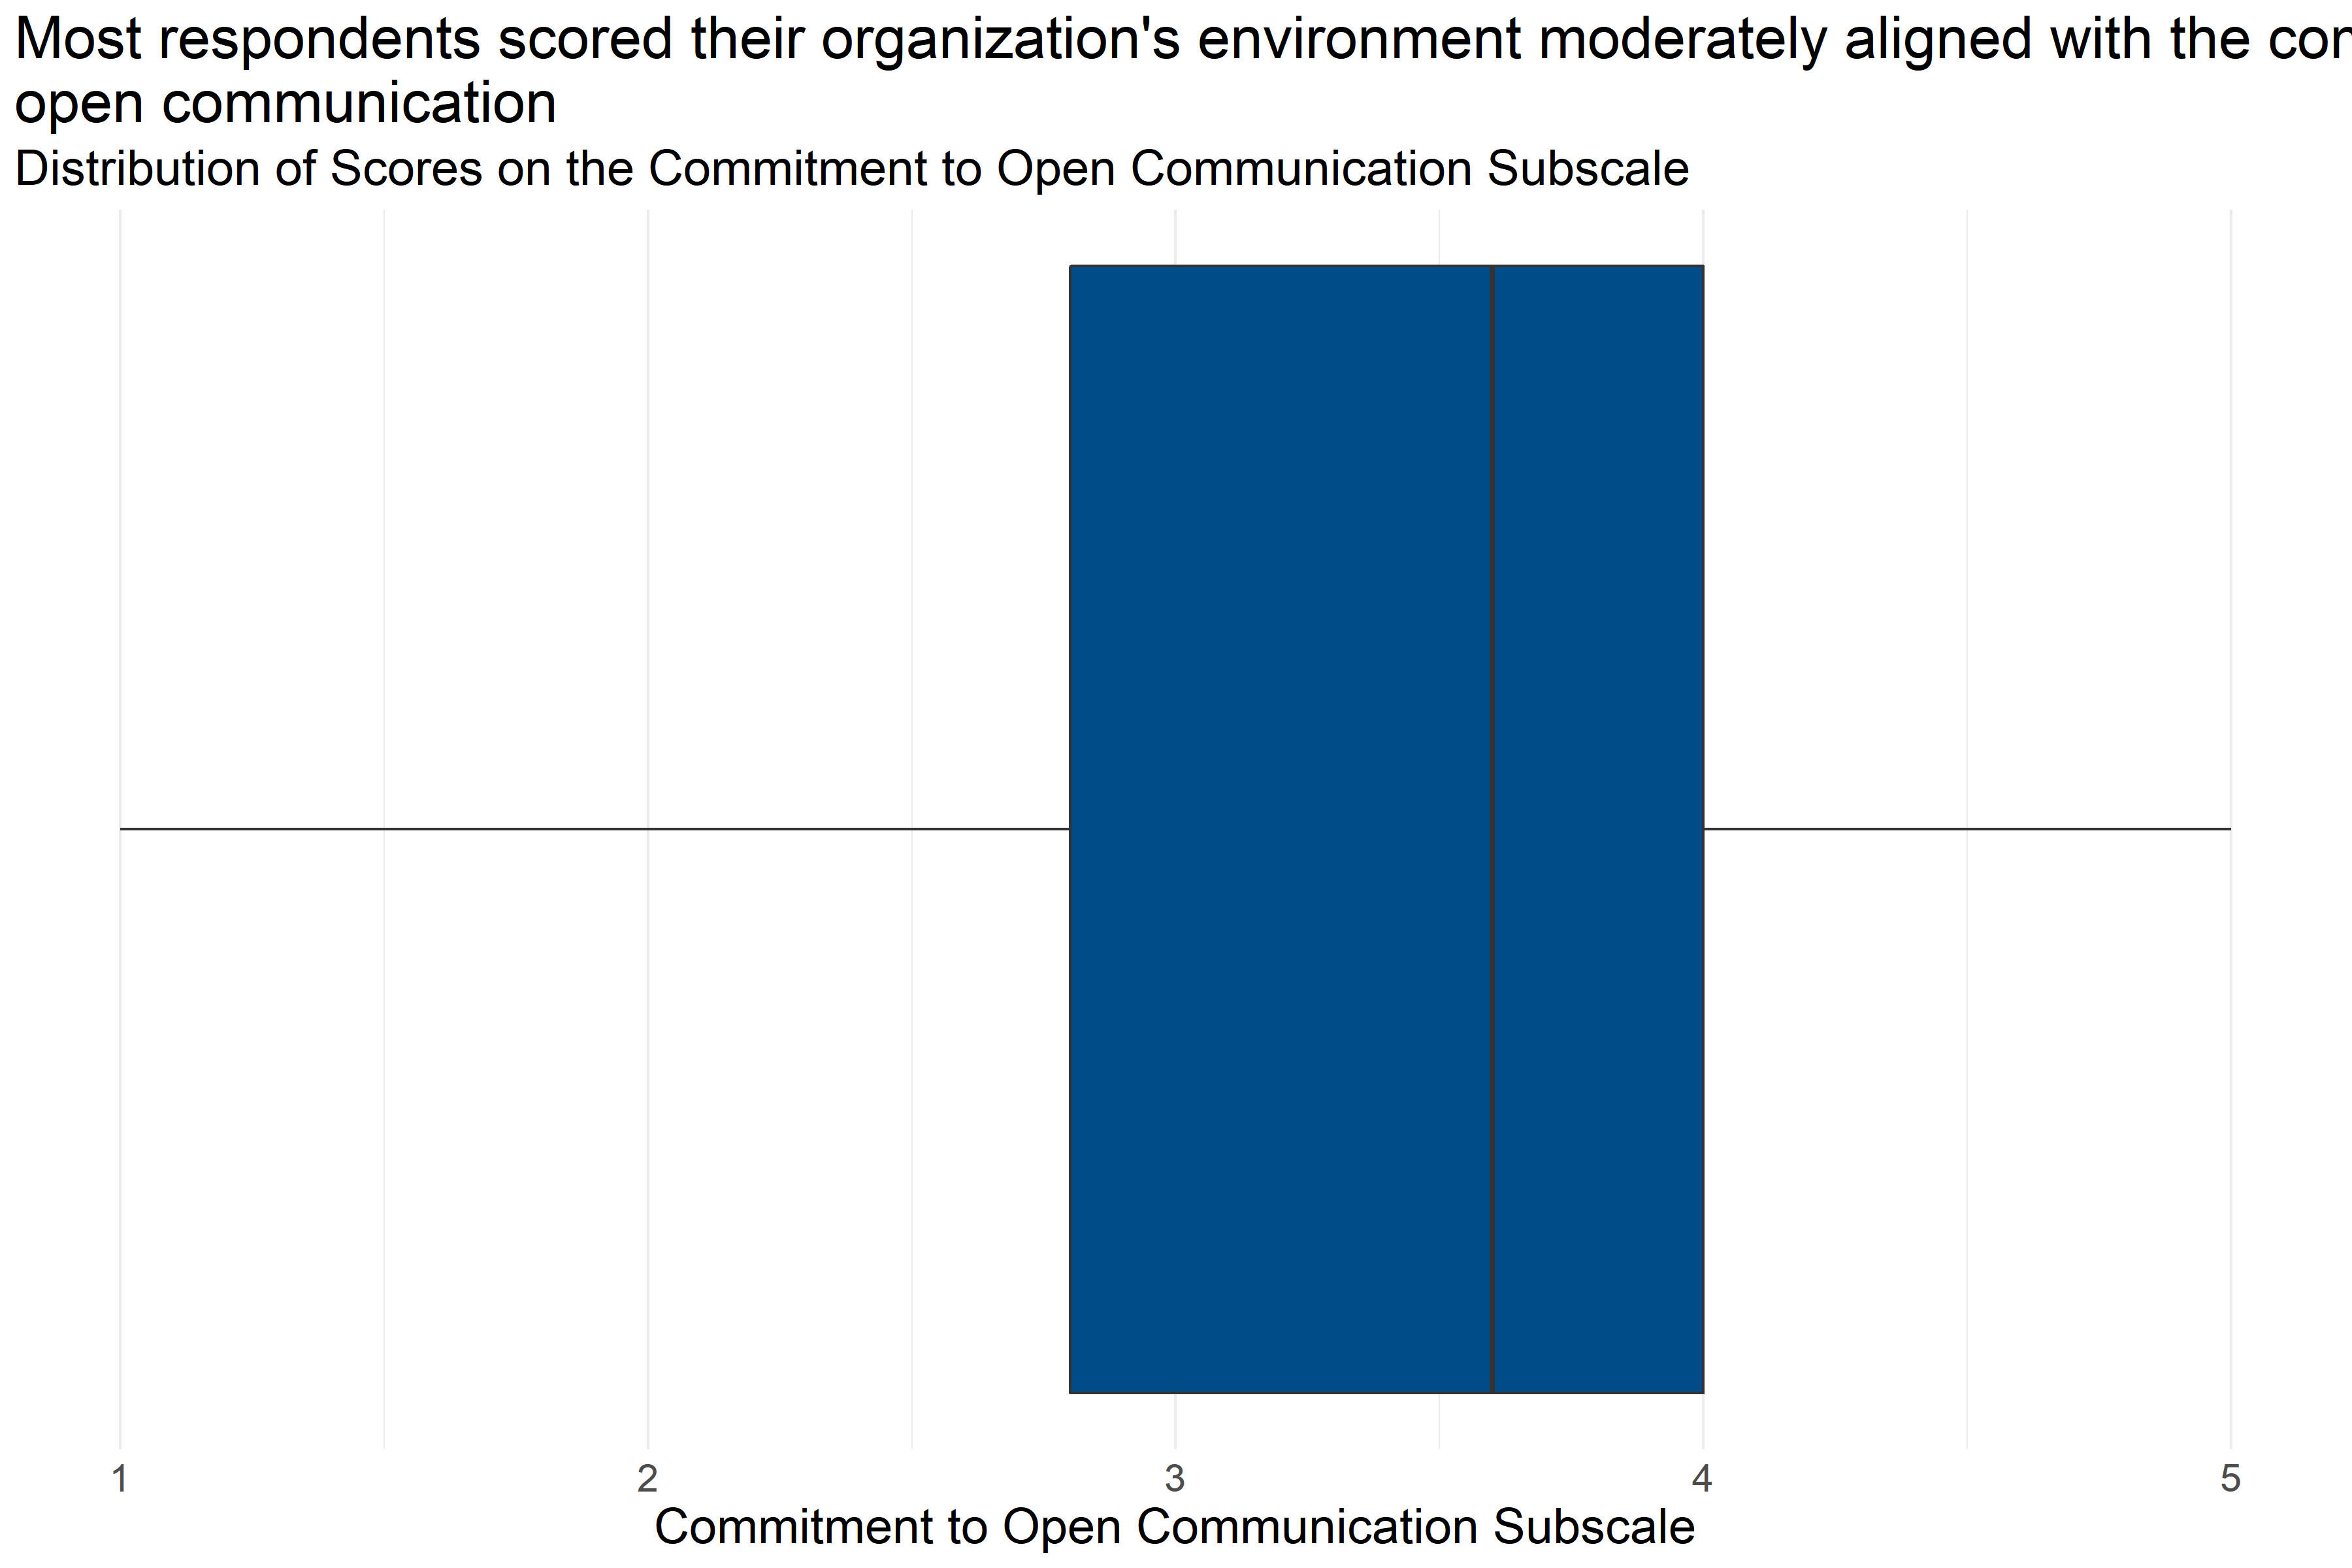
Figure 4.32: Boxplot of score distributions for Commitment to Open Communication Subscale
| Number of Answers | Average Score | Lowest Score | First Quartile | Median | Third Quartile | Highest Score |
|---|---|---|---|---|---|---|
| 219 | 3.51 | 1 | 2.8 | 3.6 | 4 | 5 |
Figure 4.32 and Table 4.32 provide information about how respondents scored on the Commitment to Open Communication Subscale. They provide the following information:
- Response: 219 respondents answered all questions in the scale.
- Average: The average score was 1.
- Range: Scores ranged from 3.51 to 5.
- Median: About half of respondents scored below 3.6 and half scored above 3.6.
- Interquartile Range: If the range of responses were cut into quarters, the middle half of respondents (between the first and third quartiles) scored between 2.8 and 4.
This means that more than half of respondents generally answered that they neither agreed nor disagreed or agreed with statements about the alignment of their organization’s commitment to open communication that were consistent with a Trauma Informed Model.
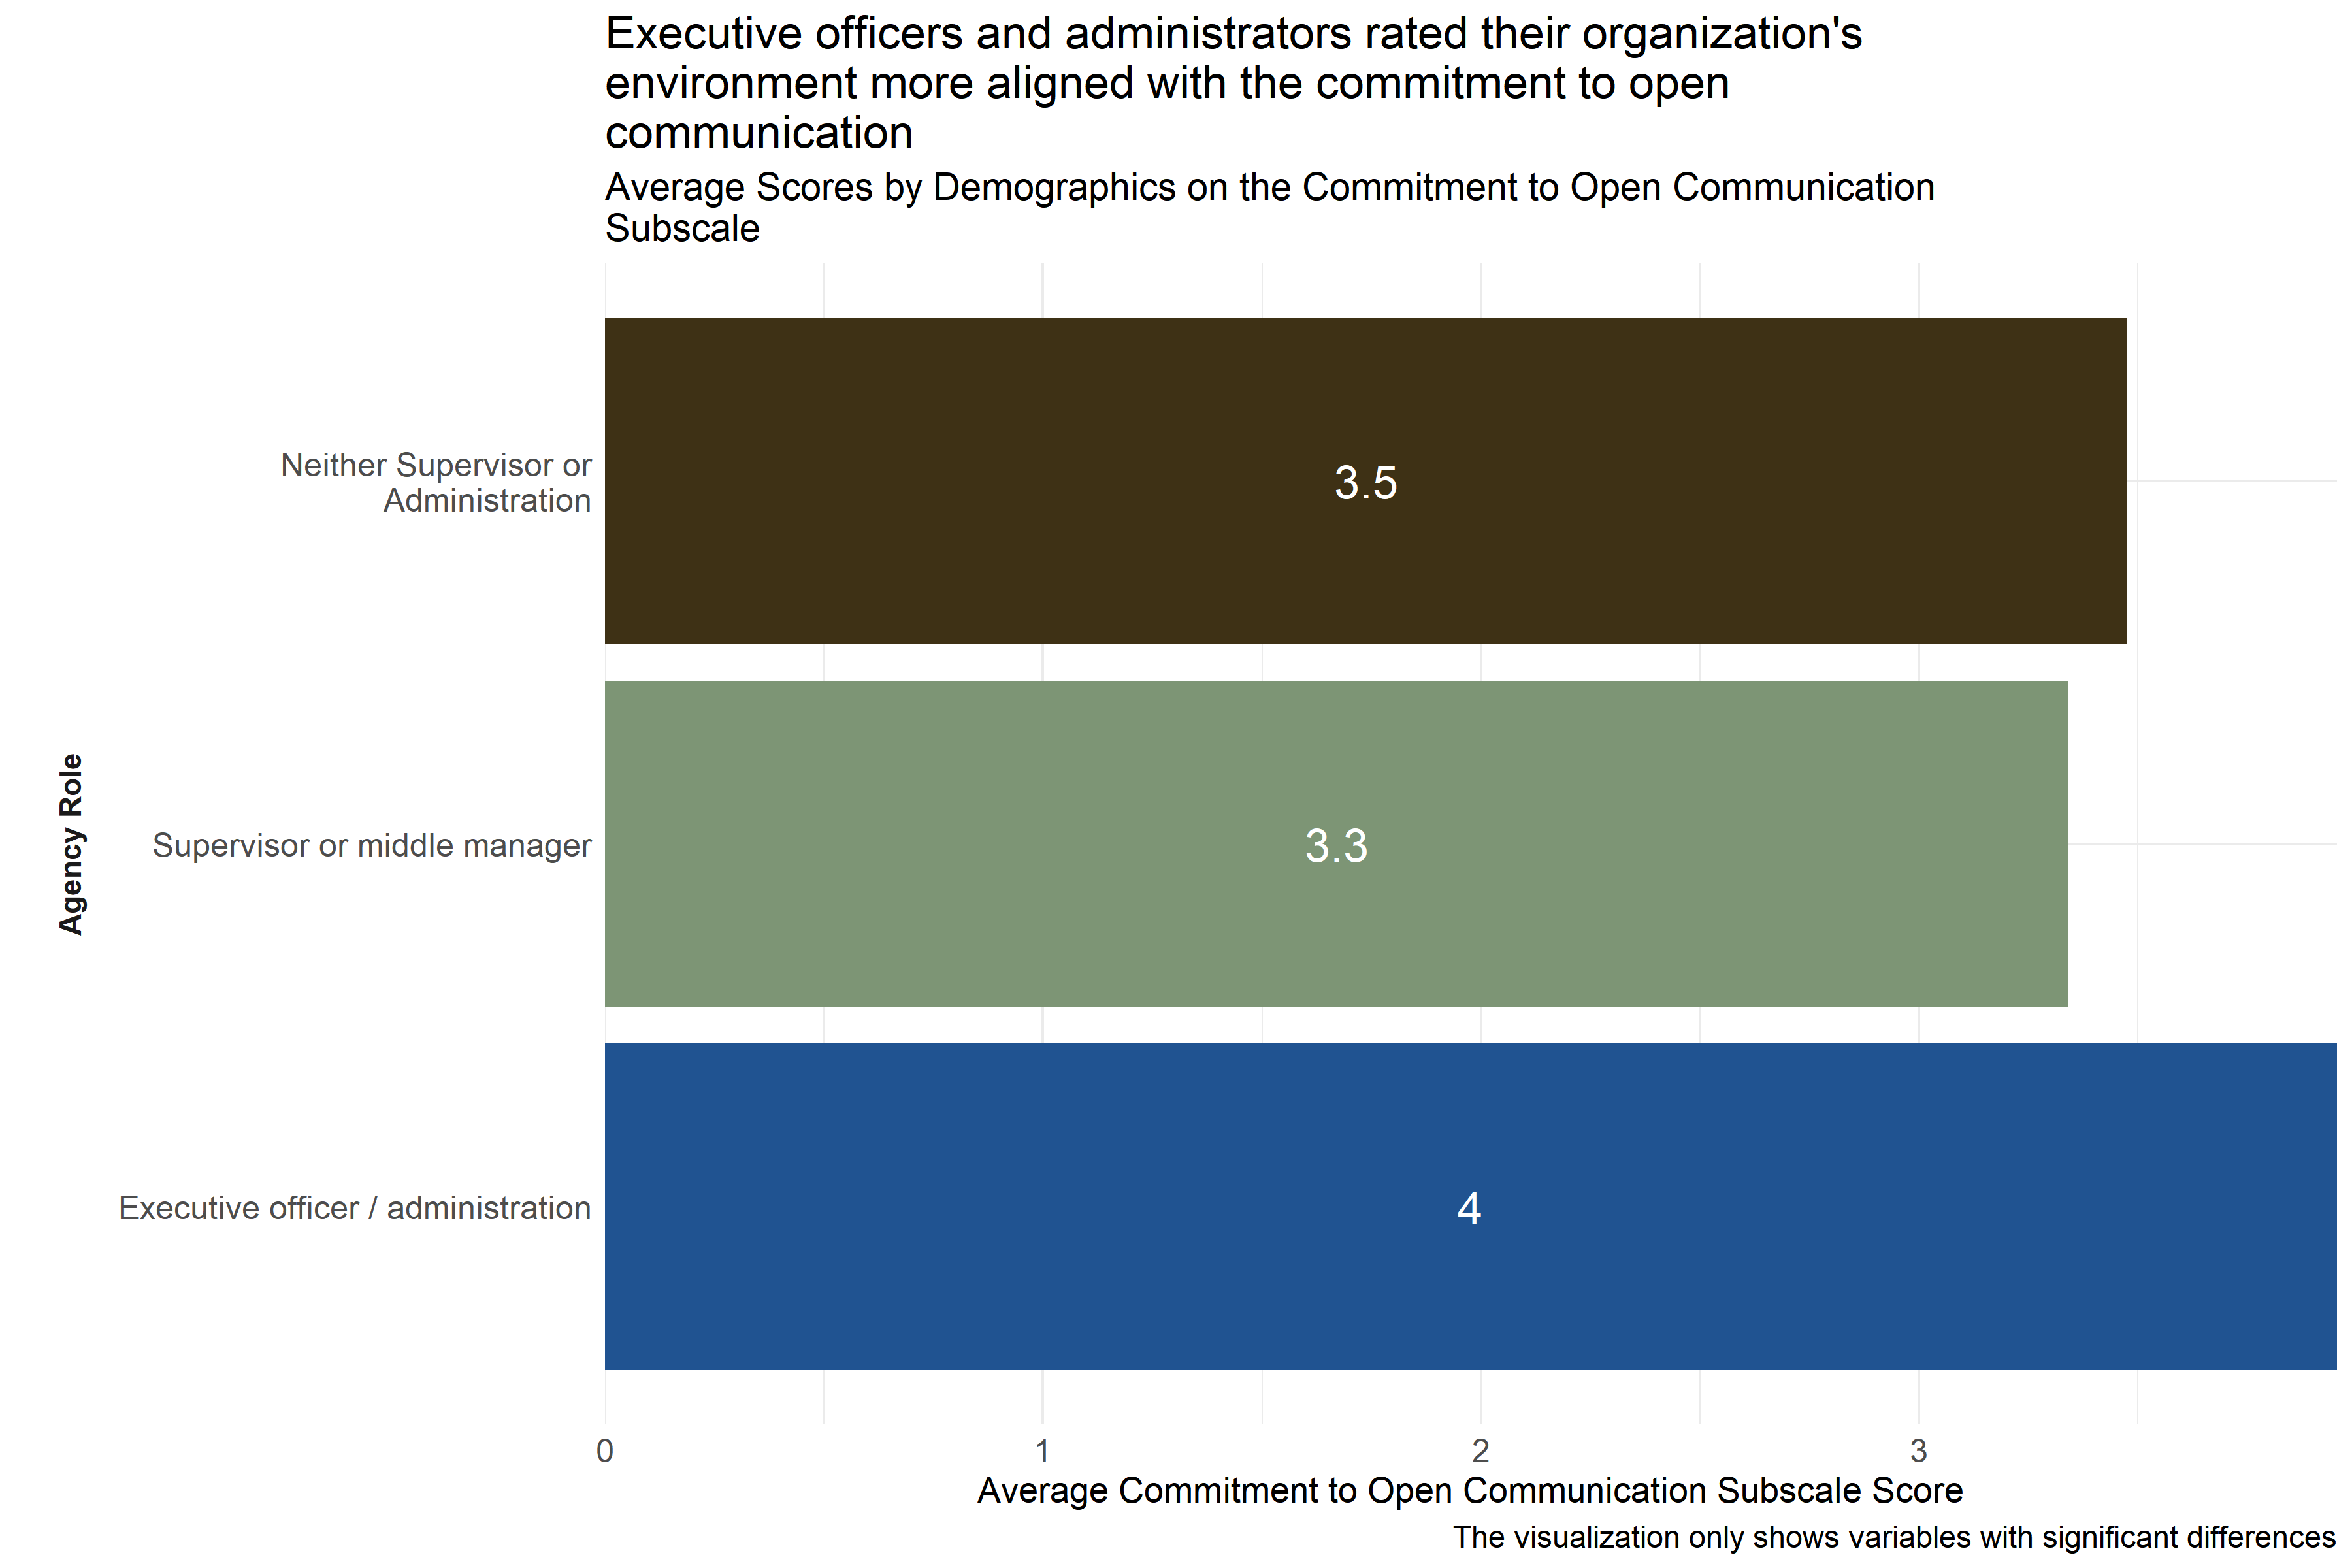
Figure 4.33: Average scores for Commitment to Open Communication Subscale across demographic groups
Analysts tested the average scores on the Commitment to Open Communication Subscale across demographic groups to identify differences in how respondents answered questions about how they perceived indications of their agencies’ commitment to open communication in a way that was consistent with the Trauma Informed Care model. As Figure 4.33 shows, executive officers / administrators scored higher than respondents in other agency roles. This suggests that executive officers / administrators are experiencing more alignment within their respective organizations towards a commitment to open communication.
Analysts also observed significant differences in responses across specific agencies, but did not include that information in Figure 4.33 to protect the privacy of those agencies.
4.5.4.10 Commitment to Social Responsibility
The Commitment to Social Responsibility Subscale measures the extent to which the cultural and social environment at an agency aligns with the trauma-informed norm and value of commitment to social responsibility. Survey participants responded to statements like “Staff and leaders are able to challenge each other, disagree, collaborate, resolve conflicts and learn from the process.” and “Longer-term clients take responsibility for mentoring newer clients.” on a scale of 1 “Strongly Disagree” to 5 “Strongly Agree.” Individual responses to each of the questions in this scale can be found in Appendix B: Detailed Question Responses by Scale. Low scores on this scale indicate that the organization’s environment is less aligned with the commitment to social responsibility.

Figure 4.34: Boxplot of score distributions for Commitment to Social Responsibility Subscale
| Number of Answers | Average Score | Lowest Score | First Quartile | Median | Third Quartile | Highest Score |
|---|---|---|---|---|---|---|
| 188 | 3.48 | 1 | 3 | 3.6 | 4 | 5 |
Figure 4.34 and Table 4.33 provide information about how respondents scored on the Commitment to Social Responsibility Subscale. They provide the following information:
- Response: 188 respondents answered all questions in the scale.
- Average: The average score was 1.
- Range: Scores ranged from 3.48 to 5.
- Median: About half of respondents scored below 3.6 and half scored above 3.6.
- Interquartile Range: If the range of responses were cut into quarters, the middle half of respondents (between the first and third quartiles) scored between 3 and 4.
This means that more than half of respondents generally answered that they neither agreed nor disagreed or agreed with statements about the alignment of their organization’s commitment to social responsibility that were consistent with a Trauma Informed Model.
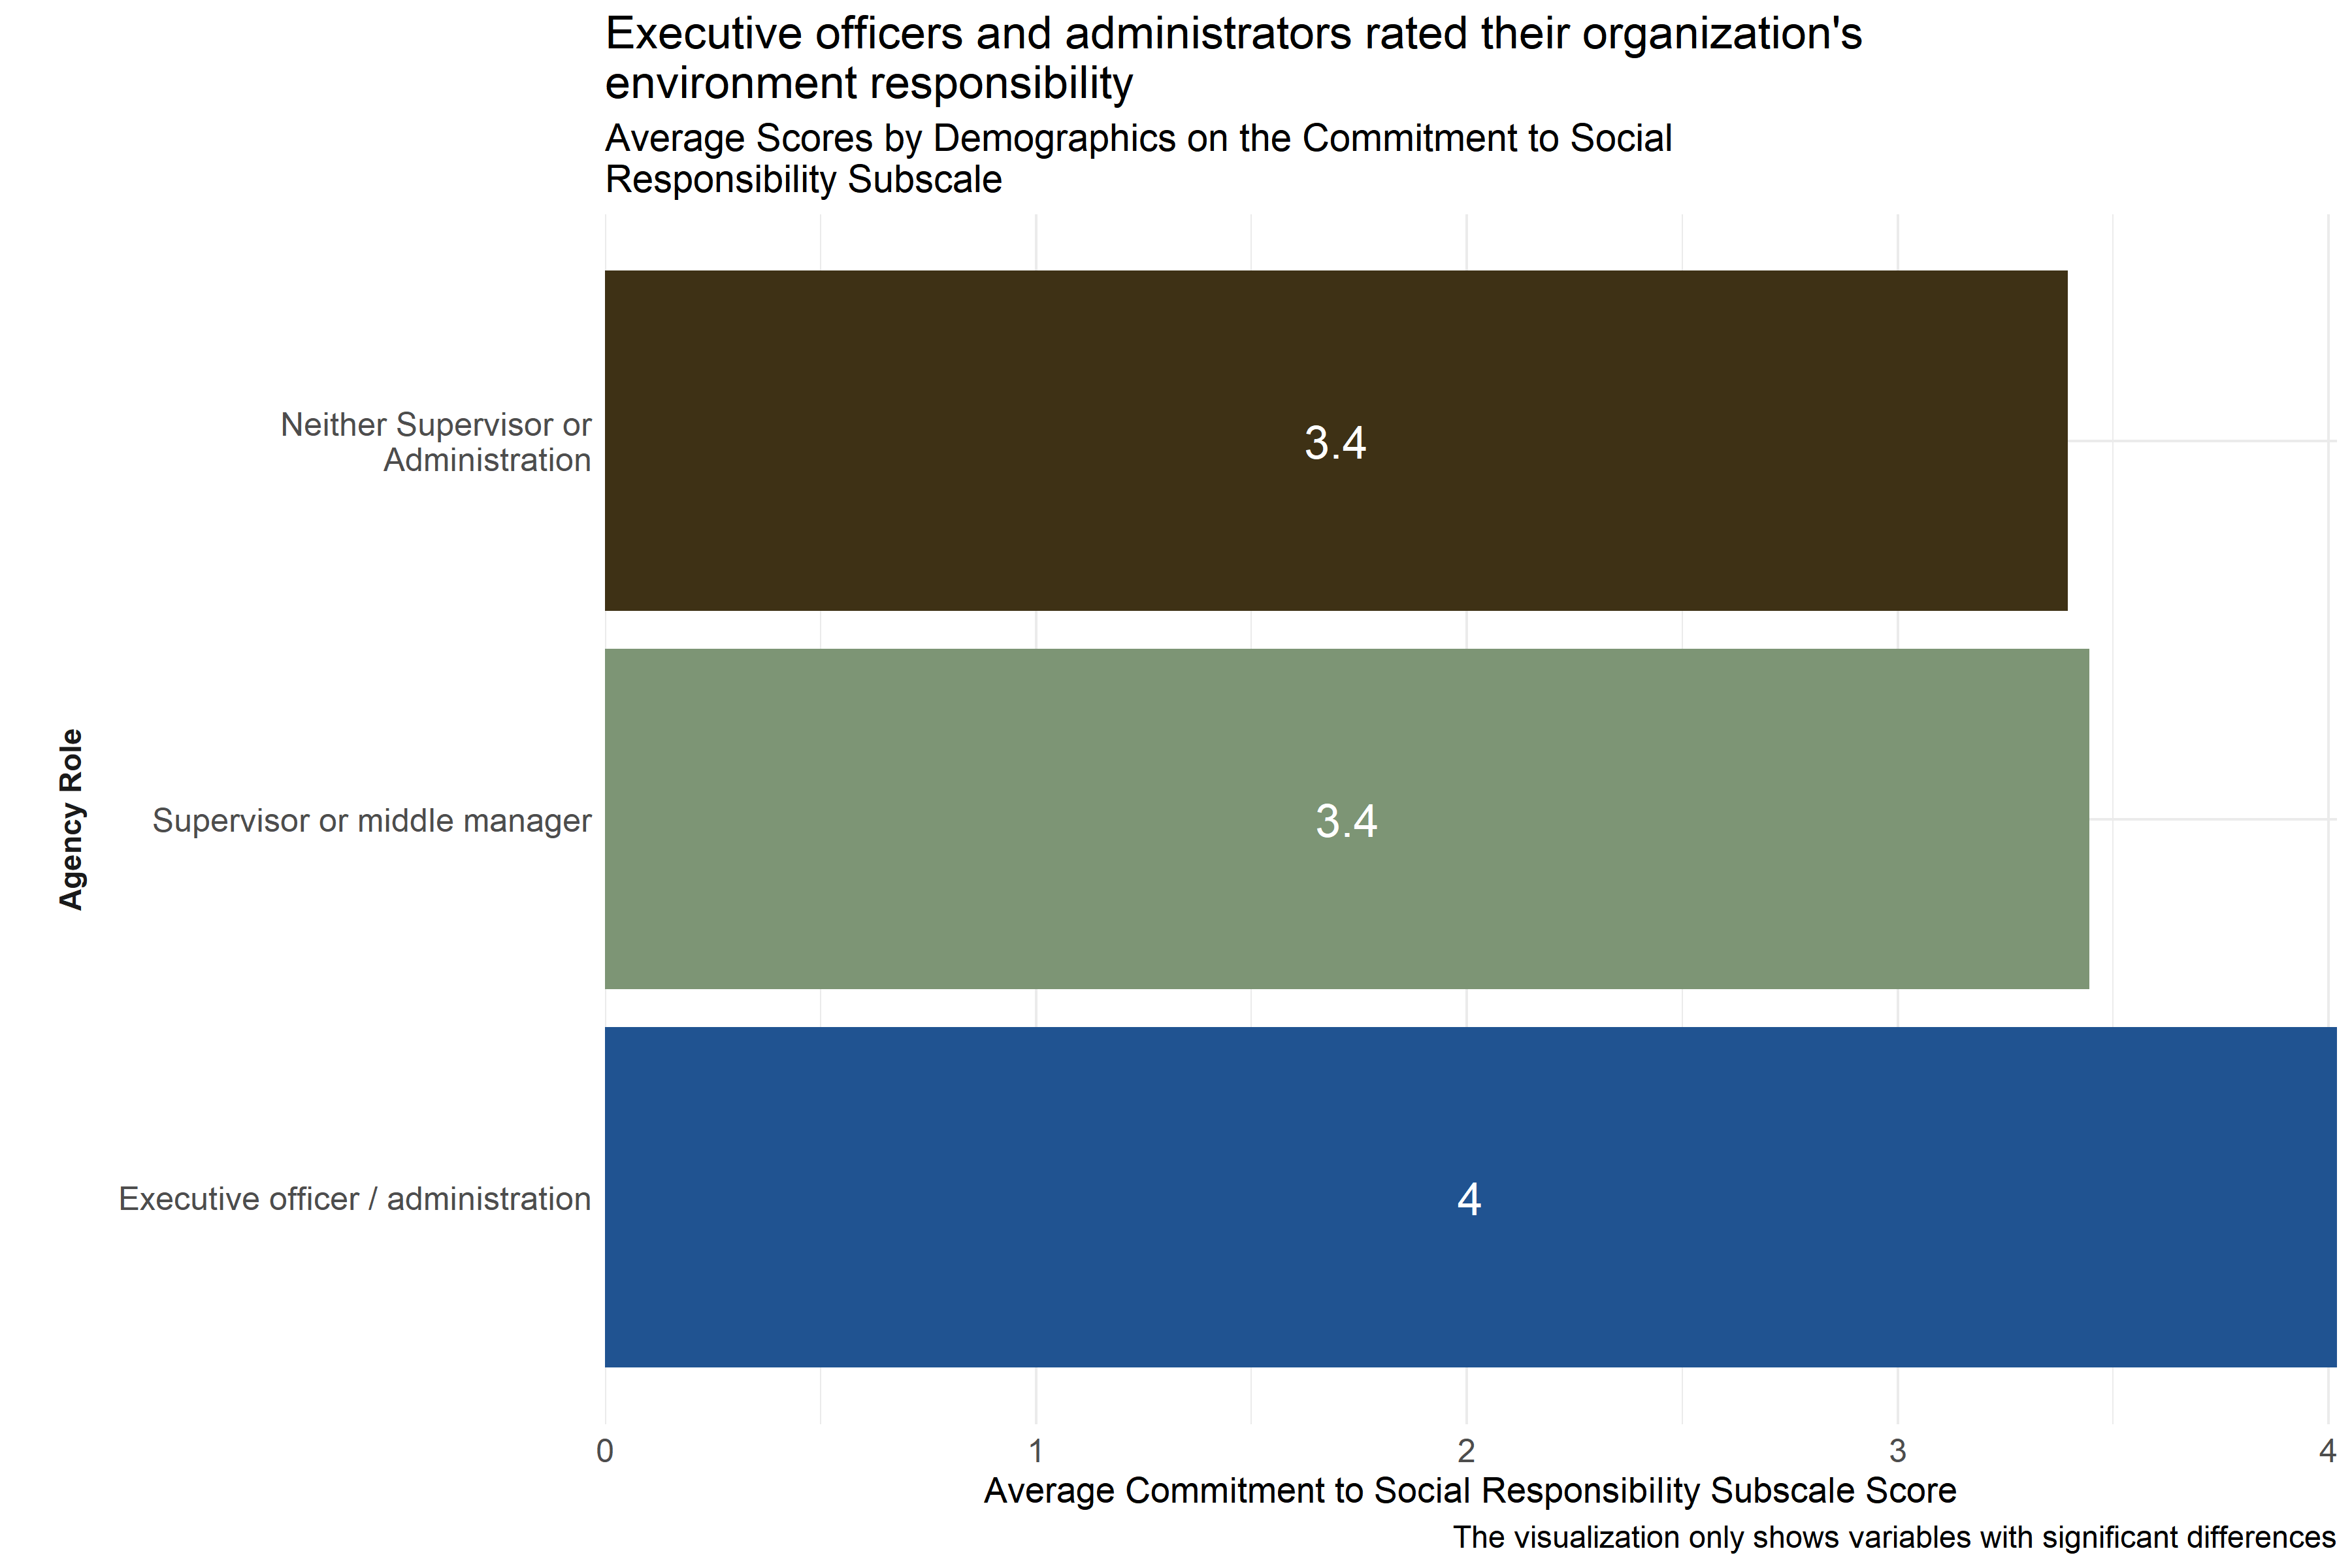
Figure 4.35: Average scores for Commitment to Social Responsibility Subscale across demographic groups
Analysts tested the average scores on the Commitment to Social Responsibility Subscale across demographic groups to identify differences in how respondents answered questions about how they perceived indications of their agencies’ commitment to social responsibility in a way that was consistent with the Trauma Informed Care model. As Figure 4.35 shows, executive officers / administrators scored higher than respondents in other agency roles. This suggests that executive officers / administrators are experiencing more alignment within their respective organizations towards a commitment to social responsibility.
Analysts also observed differences between responses from specific agencies, but these scores were not included in Figure 4.35 to protect those agencies’ privacy.
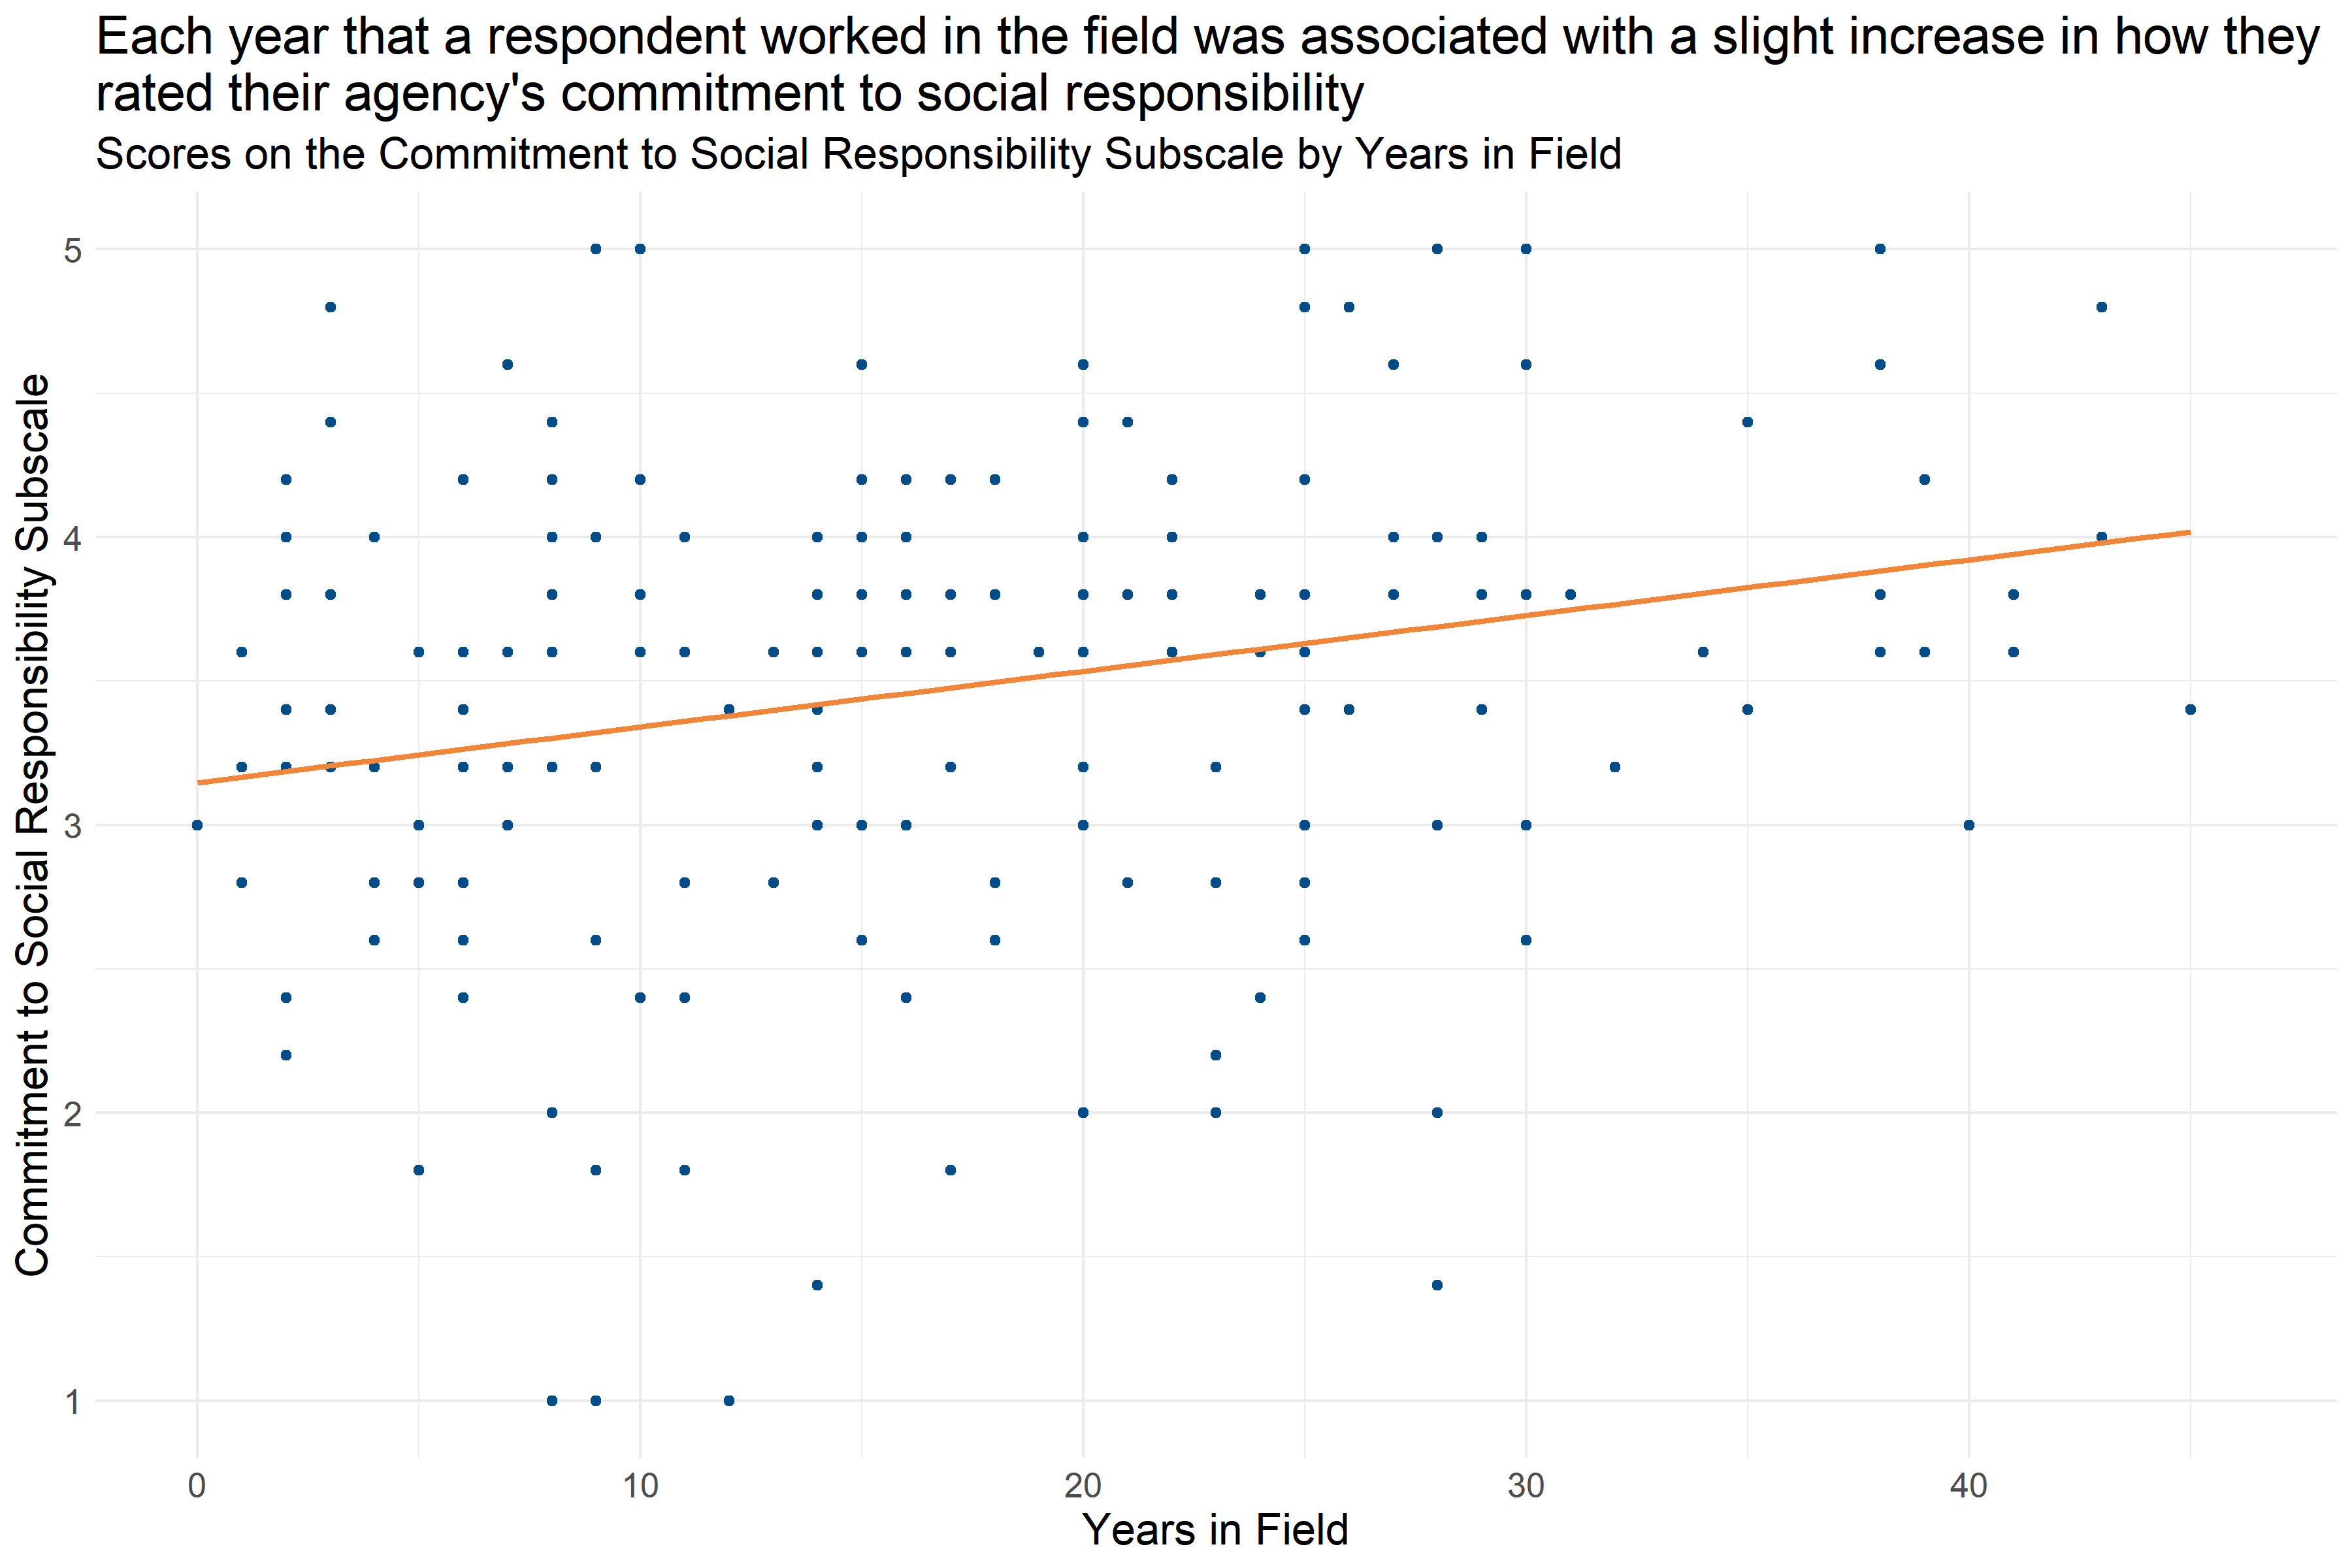
Figure 4.36: Scatter plot of Years in Field and Commitment to Social Responsibility Score
Analysts also found a relationship between how long respondents had worked in their fields and their scores on the Commitment to Social Responsibility Subscale. Figure 4.36 shows that each year that a respondent worked in the field was associated with a slight increase in their Commitment to Social Responsibility Subscale score (increase of about 0.18 per year in the field), which means that staff with more experience were more likely to answer questions about their organization’s commitment to social responsibility in a way that indicated organizational practice being more in alignment with the Trauma Informed Care model.
4.5.4.11 Commitment to Growth and Change
The Commitment to Growth and Change Subscale measures the extent to which the cultural and social environment at an agency aligns with the trauma-informed norm and value of commitment to growth and change. Survey participants responded to statements like “Clients are routinely encouraged to think about, plan and work on goals for the immediate, short-term and long-term future.” and “Administrators, managers and staff truly believe in the potential for positive change in the clients we serve.” on a scale of 1 “Strongly Disagree” to 5 “Strongly Agree.” Individual responses to each of the questions in this scale can be found in Appendix B: Detailed Question Responses by Scale. Low scores on this scale indicate that the organization’s environment is less aligned with the commitment to growth and change.
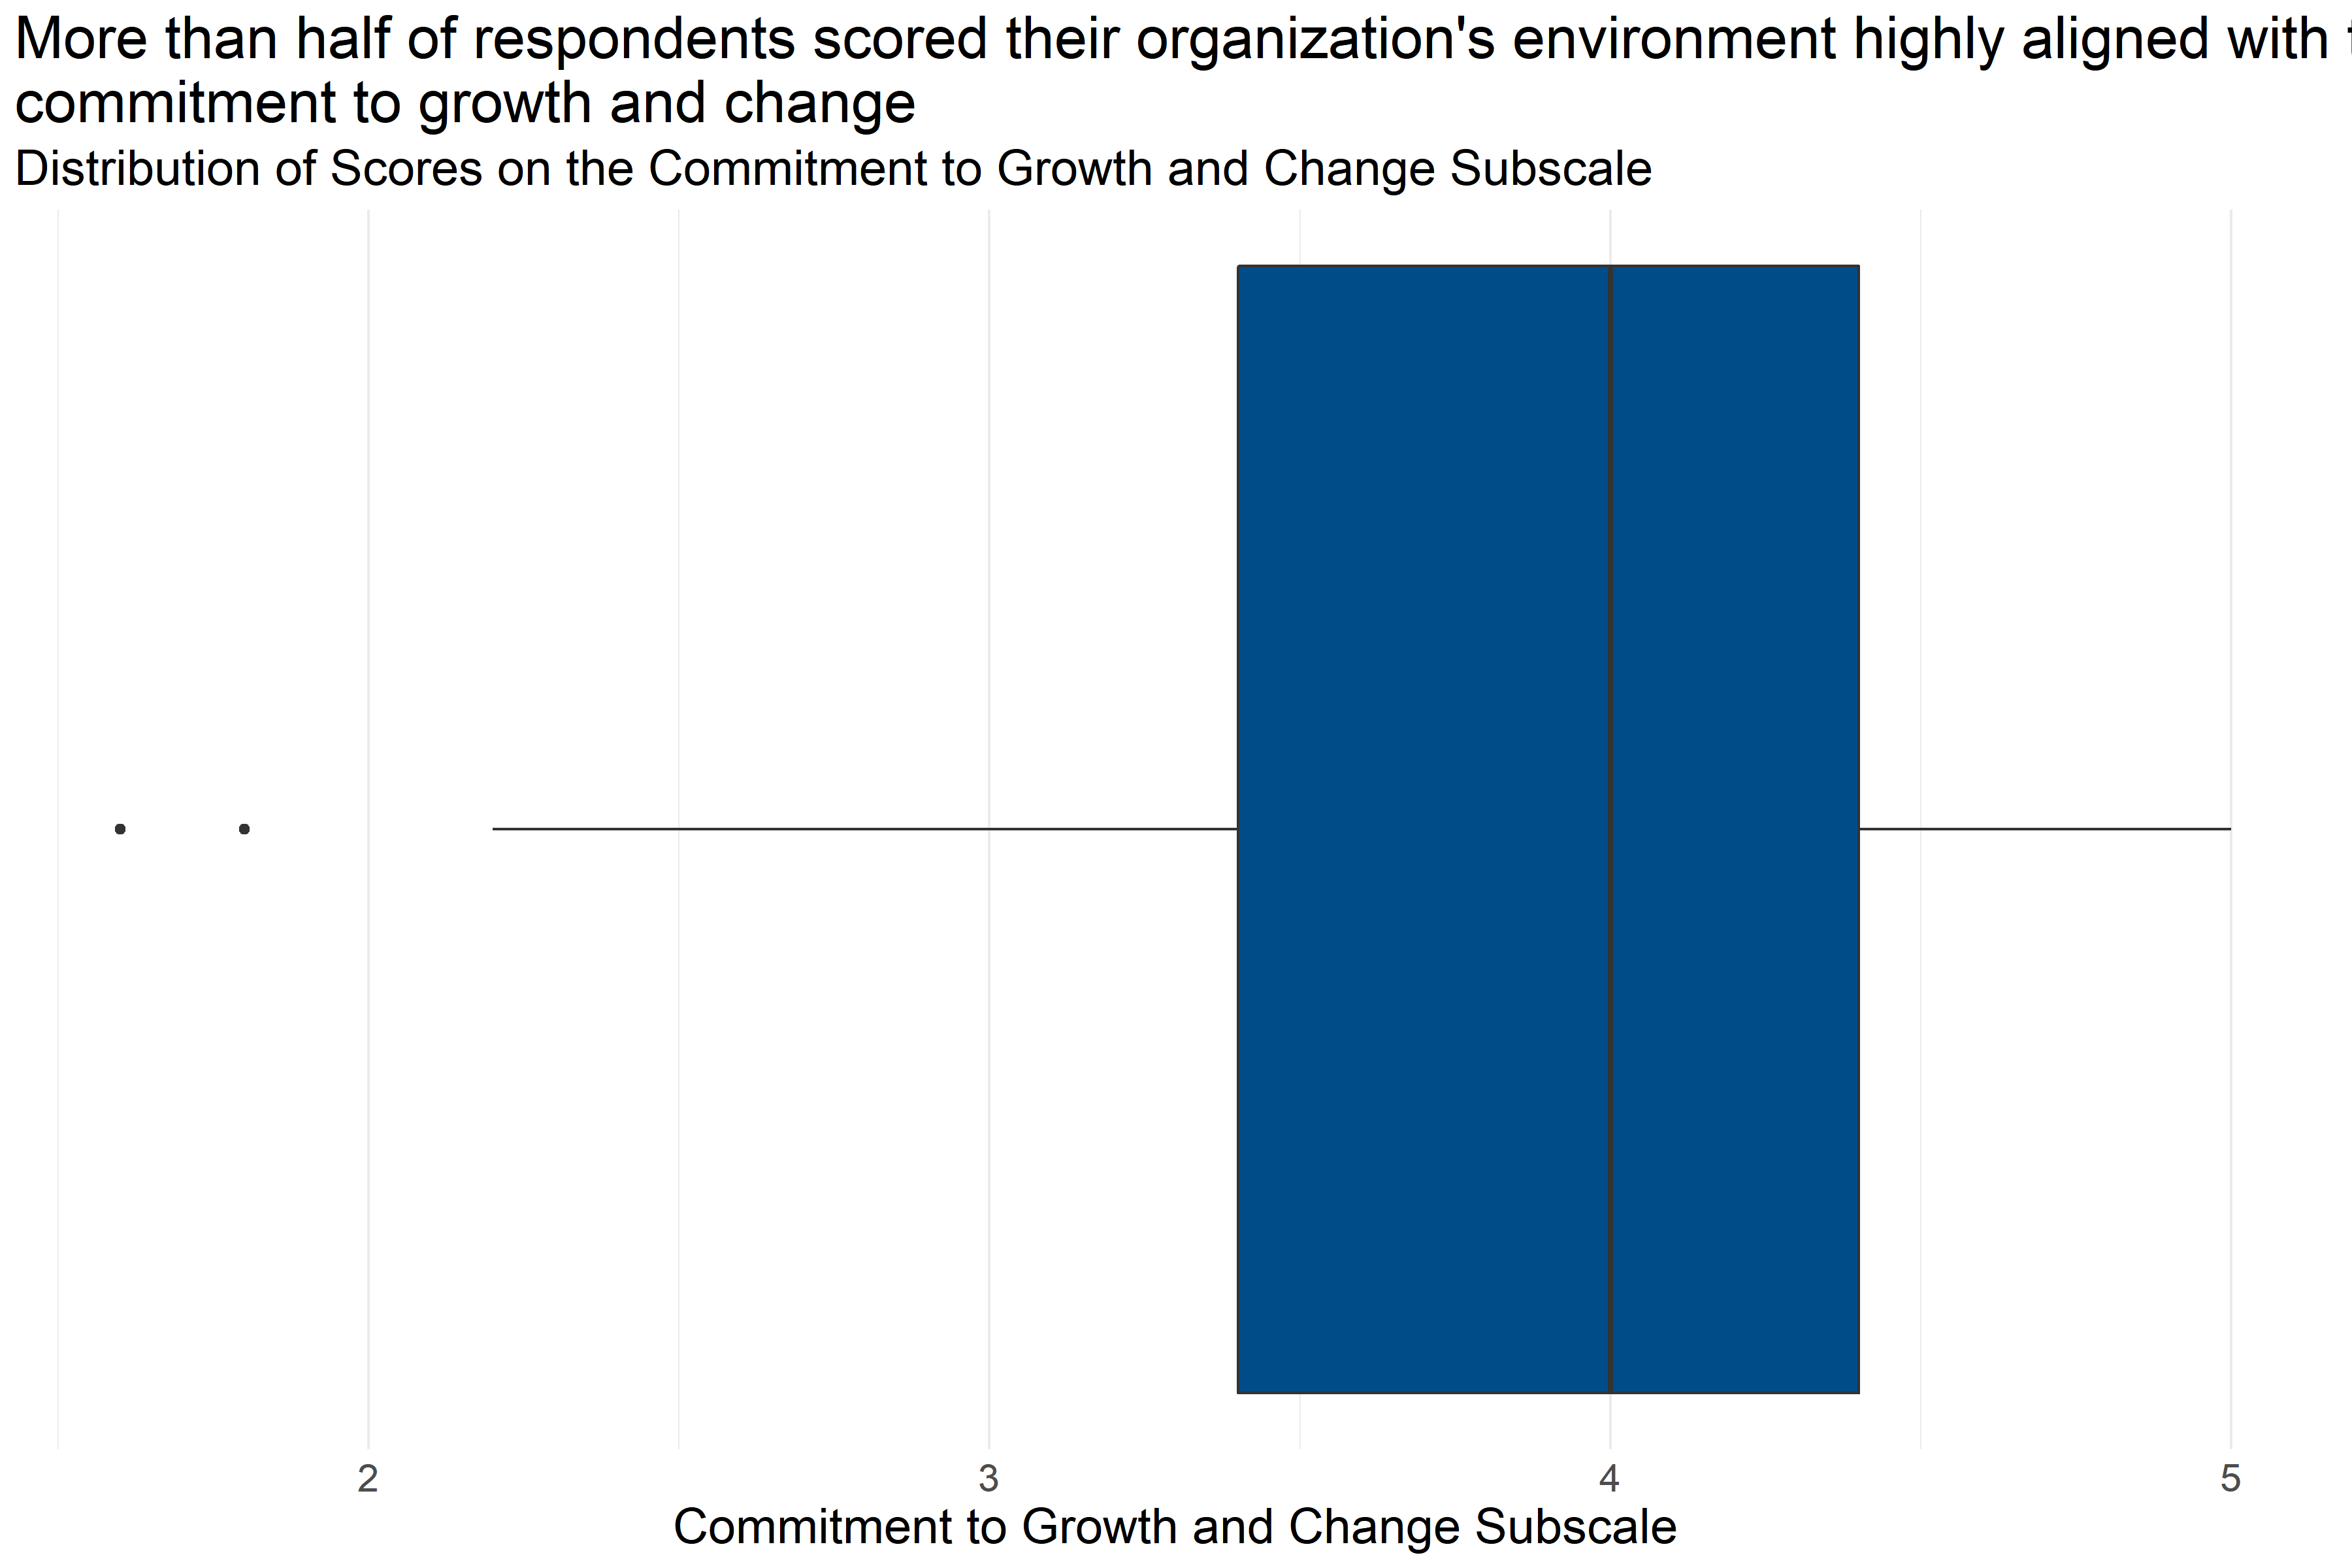
Figure 4.37: Boxplot of score distributions for Commitment to Growth and Change Subscale
| Number of Answers | Average Score | Lowest Score | First Quartile | Median | Third Quartile | Highest Score |
|---|---|---|---|---|---|---|
| 215 | 3.85 | 1.6 | 3.4 | 4 | 4.4 | 5 |
Figure 4.37 and Table 4.34 provide information about how respondents scored on the Commitment to Growth and Change Subscale. They provide the following information:
- Response: 215 respondents answered all questions in the scale.
- Average: The average score was 1.6.
- Range: Scores ranged from 3.85 to 5.
- Median: About half of respondents scored below 4 and half scored above 4.
- Interquartile Range: If the range of responses were cut into quarters, the middle half of respondents (between the first and third quartiles) scored between 3.4 and 4.4.
This means that more than half of respondents generally answered that they agreed or strongly agreed with statements about the alignment of their organization’s commitment to growth and change that were consistent with a Trauma Informed Model.
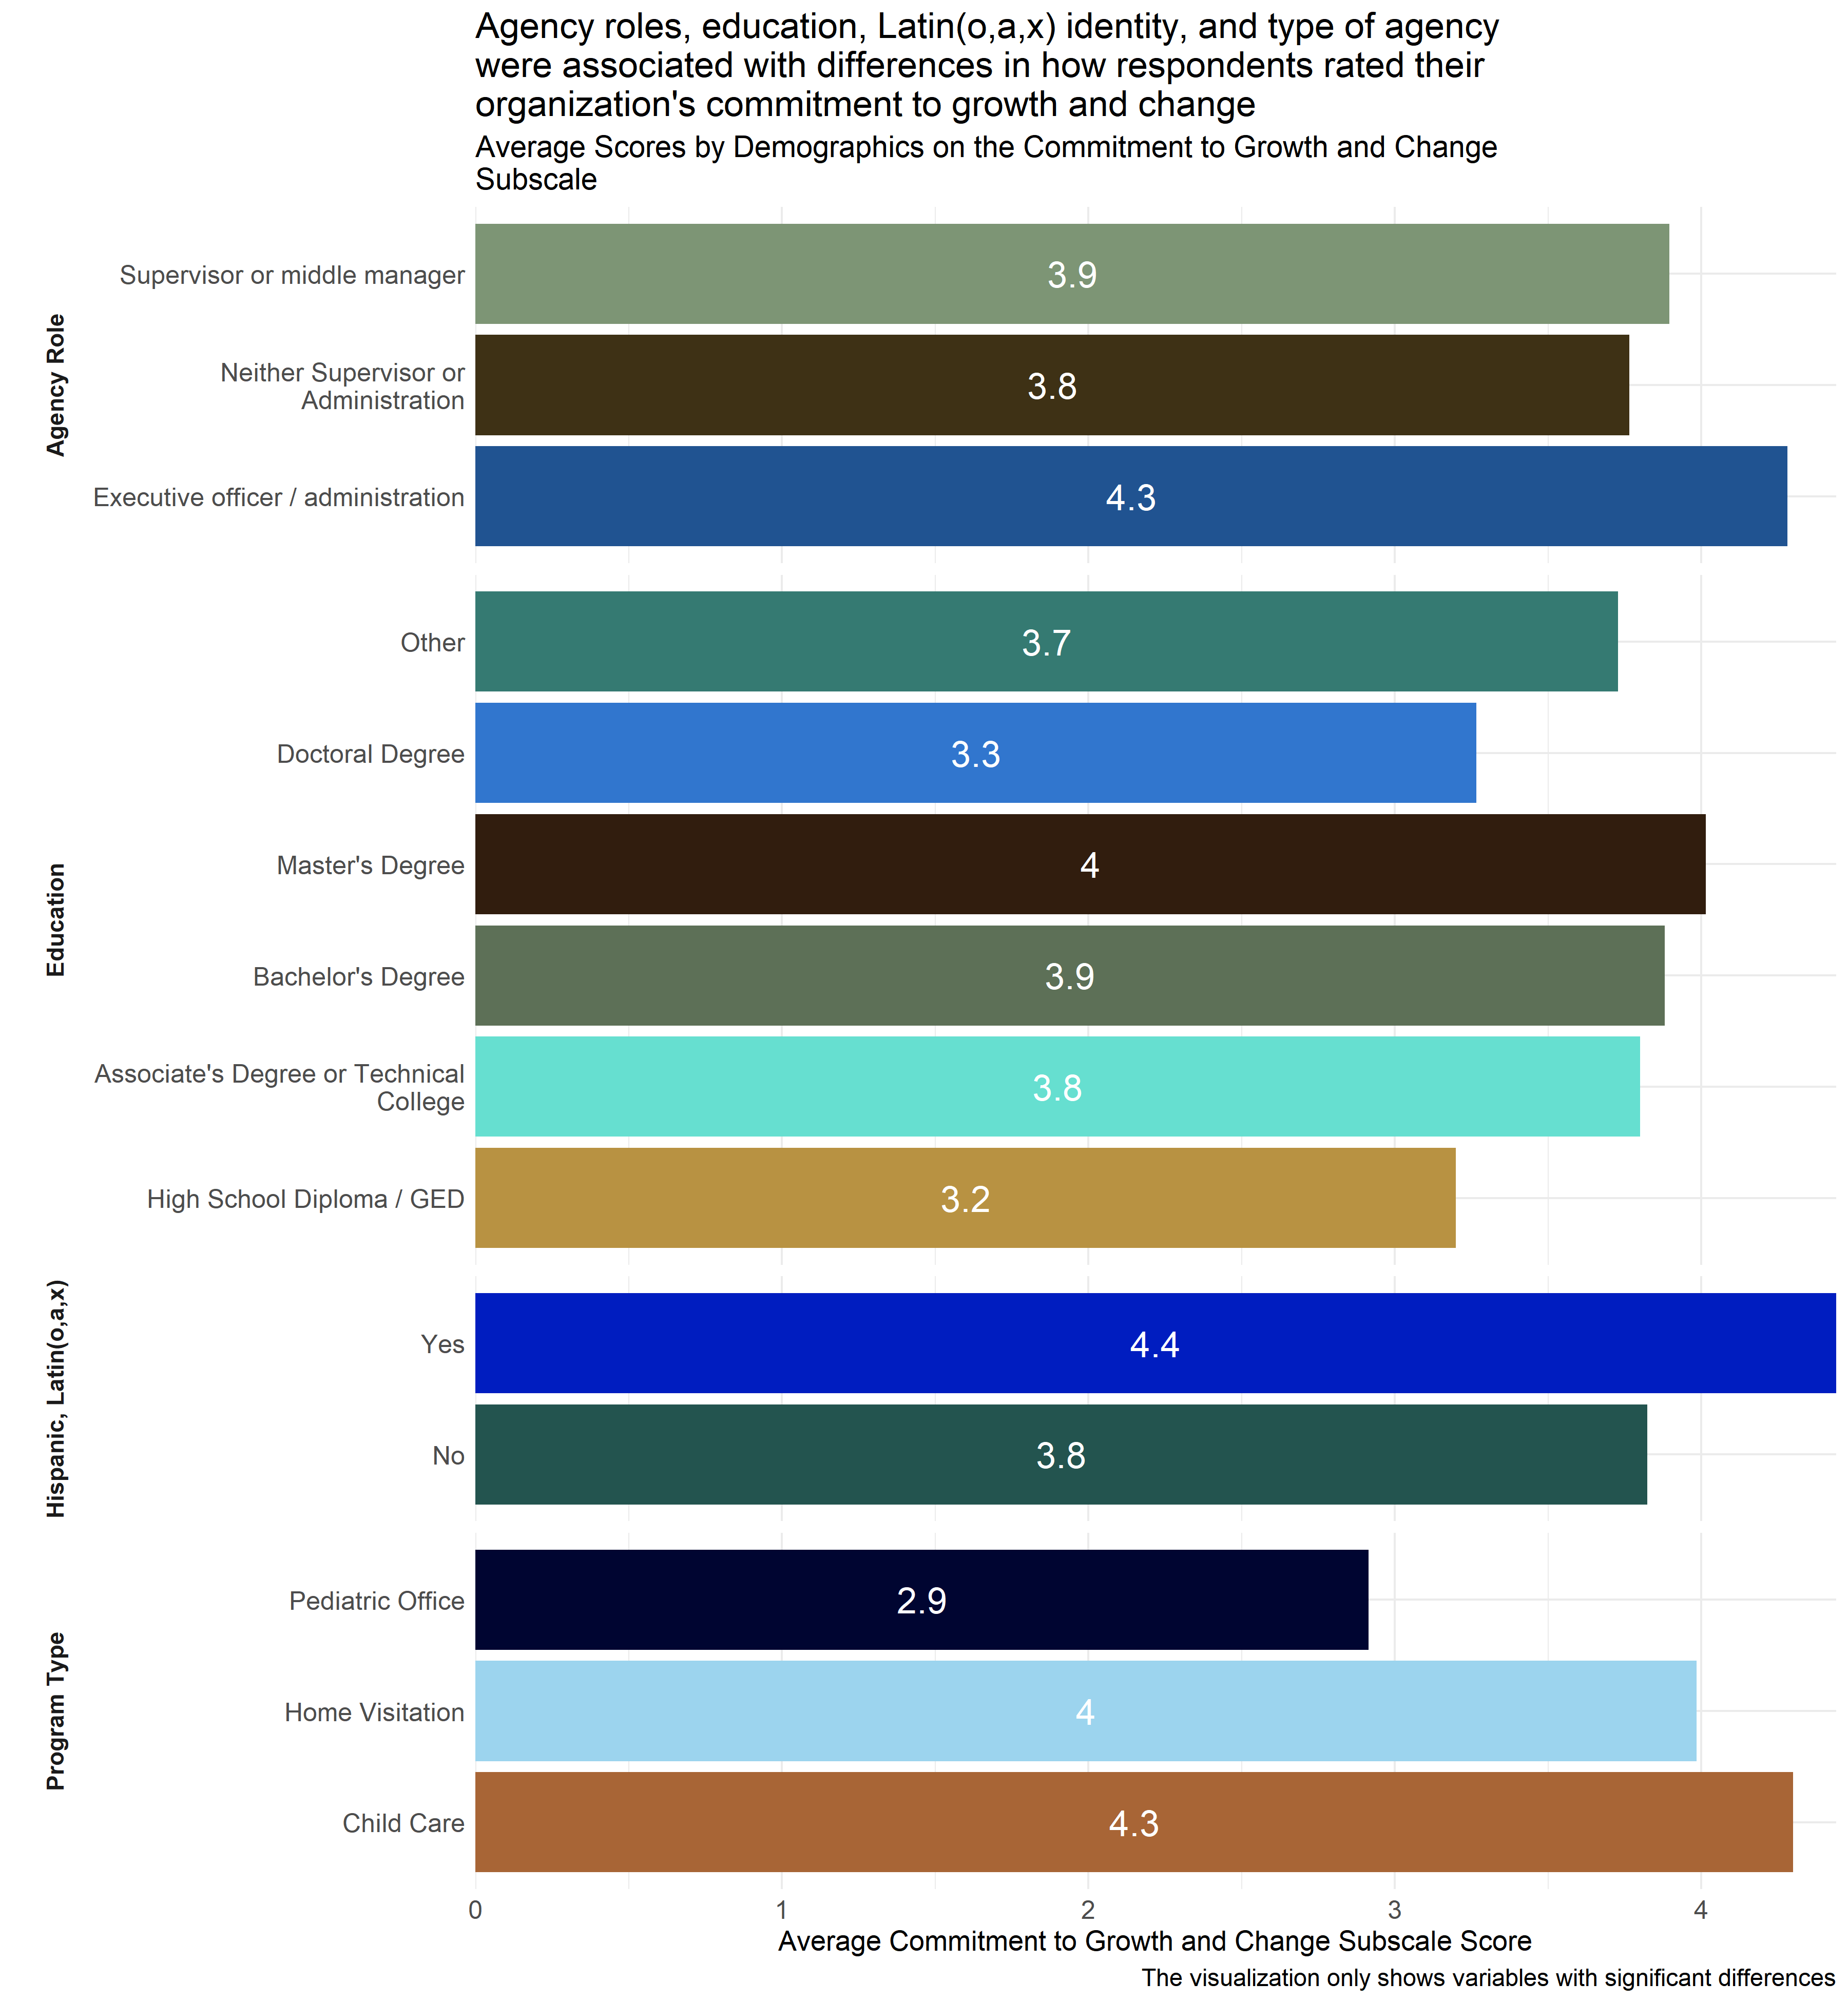
Figure 4.38: Average scores for Commitment to Growth and Change Subscale across demographic groups
Analysts tested the average scores on the Commitment to Growth and Change Subscale across demographic groups to identify differences in how respondents answered questions about how they perceived indications of their agencies’ commitment to growth and change in a way that was consistent with the Trauma Informed Care model. As Figure 4.38 shows, analysts found significant differences by agency role, highest level of education, whether or not the respondent self-identified as Hispanic, Latino(a) or Latinx, and agency type. Respondents whose highest level of education is a High School Diploma / GED or Doctoral degree reported lower scores on average than those who have achieved other levels of education. Those with High School Diploma / GED as their highest level of education specifically had lower scores than respondents who had bachelor’s or master’s degrees, and those with doctoral degrees had lower scores than those with master’s degrees. Respondents who identified themselves as working at pediatric offices had lower scores than those working in home visitation programs or child care settings. And, executive officers and administrators scored higher than respondents who did not identify as supervisors or administrators.
Additionally, respondents identifying as Hispanic, Latino(a) or Latinx rated their organizations higher on average than those who did not identify as Hispanic, Latino(a) or Latinx. This suggests that respondents whose highest level of education is a High School Diploma / GED or Doctoral degree, who work at pediatric offices, did not identify as Hispanic, Latino(a) or Latinx, and are not supervisors or administrators are experiencing less alignment within their respective organizations towards a commitment to growth and change.
4.5.4.12 Conclusion
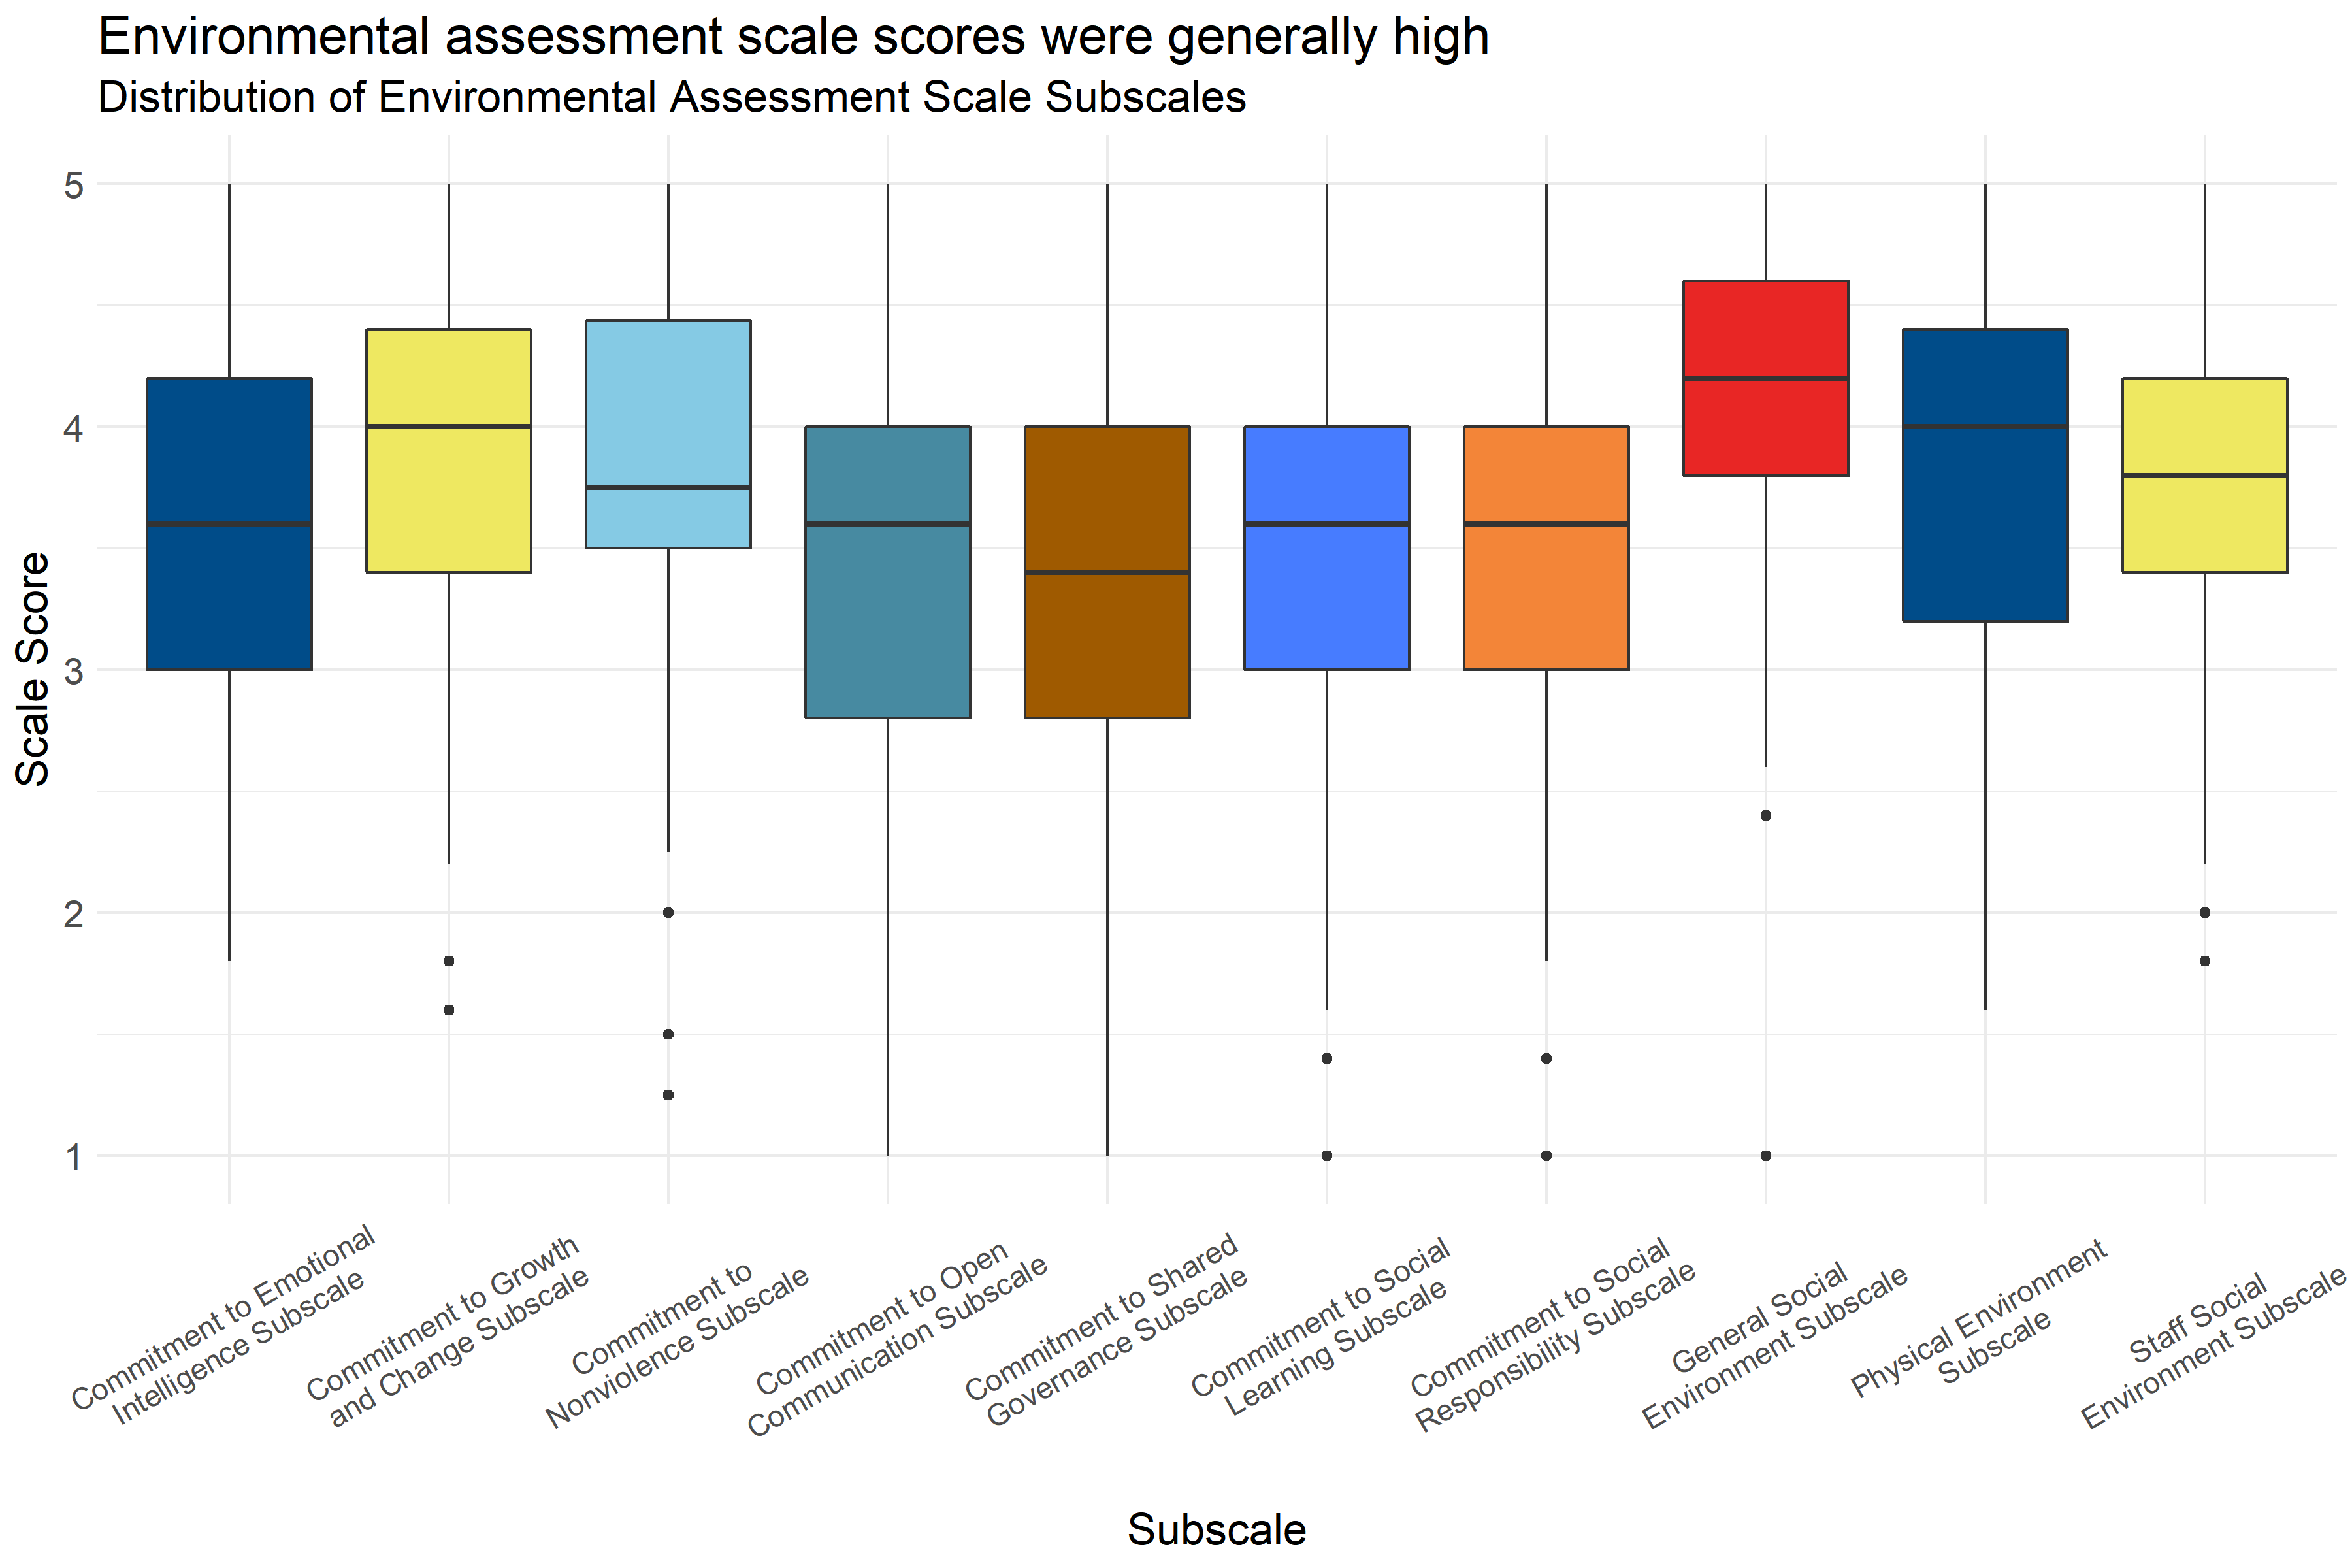
Figure 4.39: Boxplot of score distributions on the Environmental Assessment Scale Subscales
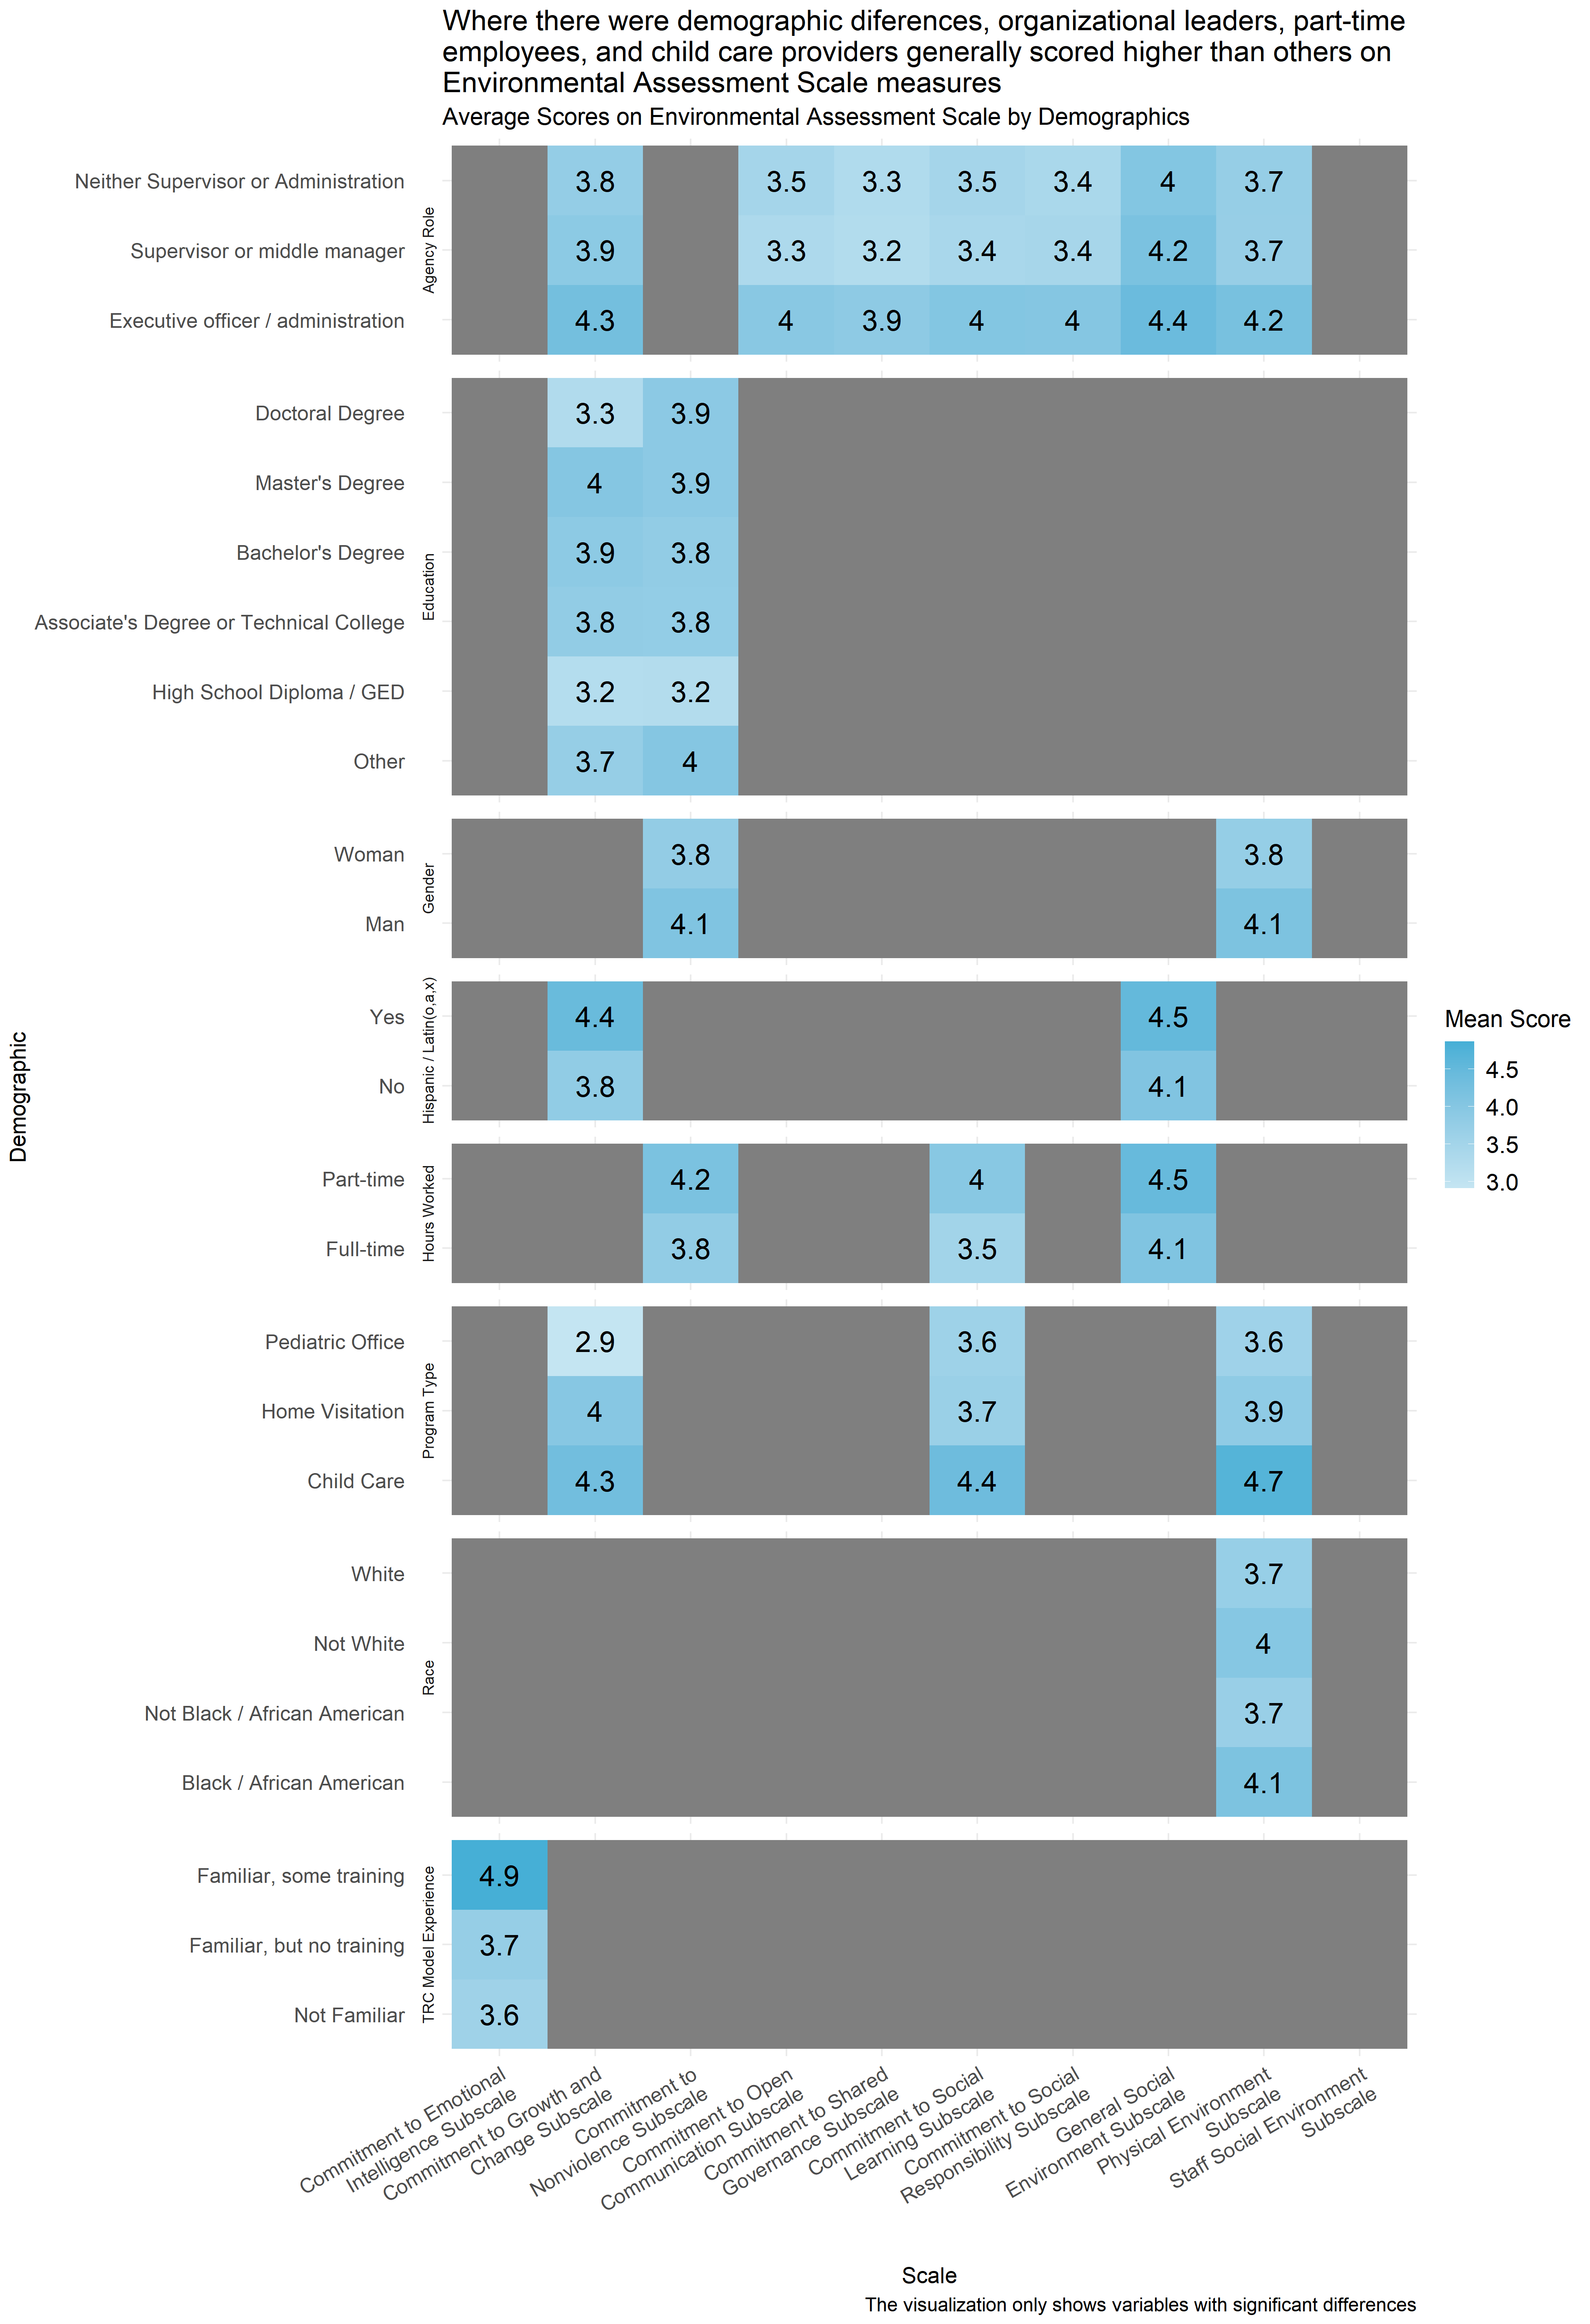
Figure 4.40: Mean score on Environmental Assessment Scale Subscales by demographic
Figure 4.39 shows the distribution of scores on the Environmental Assessment Scale subscales. The colored boxes represent the range that the scores of the middle half of respondents. (If you were to cut all of the scores into quarters, this would be between the first and third quartiles.) And, the lines and dots represent the full distribution of scores on each scale. Scales with dots on either side indicate unusually high or low scores. Figure 4.39 shows that the scores on the Environmental Assessment Scale subscales were generally between neutral and moderately aligned with trauma-informed practice, with the highest scores generally being on the General Social Environment subscale.
While most respondents rated their organization’s commitment to open communication and shared governance neutrally or highly on average, at least 25% of respondents responded to questions about their organizations’ environment more negatively on average. Similarly, at least 75% of respondents generally responded to questions about their organizations’ commitment to emotional intelligence, social learning, and social responsibility neutrally or positively, but at least 25% gave responses ranging from negative to neutral.
Similarly Figure 4.40 shows the average scores by demographics for all three subscales for all of the demographics for which analysts were able to identify statistically significant differences in scores. Gray boxes indicate that demographic differences for that scale were not statistically significant. Figure 4.40 shows that across the demographics for which analysts were able to measure statistically significant differences across at least three scales, executive directors and administrators, child care providers, and part-time employees consistently scored higher on the Environmental Assessment subscales than other groups. It also shows that respondents in pediatric offices had a particularly low score on the commitment to growth and change subscale and that respondents with high levels of exposure to the TRC model had unusually high scores on the commitment to social intelligence score. In many cases, analysts also noted significant differences in responses across specific agencies, but that data was not included in Figure 4.40 to protect the privacy of the respondents and the agencies.
It is also noteworthy that having spent more years employed at an agency was associated with slightly lower scores on the General Social Environment Subscale (Figure 4.22) and that more years in the field was associated with a slightly higher score on the Commitment to Social Responsibility Subscale (Figure 4.36).
4.5.4.12.1 Important Considerations
These demographic breakdowns only compare scores by demographics considering one demographic at a time. In cases where these demographics may be interrelated (for example, employees in pediatric offices may be more likely to have doctoral degrees than respondents in other settings) it is not possible to know from this analysis what those differences would look like if those relationships were controlled for (for example, looking at education while controlling for agency type). It is possible that some of these differences in scores are actually the result of other demographic differences, even differences not measured in this analysis.
Additionally, this data is based on a survey that respondents volunteered to take across a variety of fields. There could be ways that the people who volunteered to take the survey are different from other people who work in child-serving agencies. And, because smaller differences between groups are easier to see with a higher number of survey responses, it is possible that there are other differences that exist across demographics that analysts would be able to measure with a larger group of respondents.
4.5.4.12.2 Implications
Scores on the Environmental Assessment Scale generally indicate that most respondents’ survey answers were moderately to highly aligned with a Trauma Informed Model. However, at least a quarter of respondents gave answers which rated their environments more negatively or neutrally on many of the subscales, and the range of scale scores could indicate that some agencies have less aligned environments than others. The data suggests that commitment to growth and change, commitment to social learning, and the physical environment are relative strengths of child care providers in Forsyth County. Planners should also note that executive officers and administrators and part-time employees may have a more positive perception of their agencies’ environment than other employees.
4.5.5 Staff Practice Survey
This section includes survey results from the Trauma-Informed Practice Survey. The Trauma-Informed Practice Survey consists of 59 questions that ask participants their agreement with a series of statements on a scale from “Strongly Disagree” to “Strongly Agree.” The closer the average for each subscale is to 5, the greater staff members felt the particular domain exhibited aspects of being trauma informed. The Trauma-Informed Practice Survey measures six domains of trauma-informed practice: staff safety, staff empowerment, self-care, staff knowledge and competence, staff attitudes, and trauma-informed practices with clients.
4.5.5.1 Key Findings
- Scores on the staff practice survey were generally high.
- While scores were generally neutral to moderately high, some respondents had lower scores particularly on the self care, staff empowerment, and staff safety subscales which means that those scores had a larger range of responses than other subscales.
- The agency role demographic was most consistently associated with differences in staff practice survey scores, and organizational leaders generally had higher scores than those in other roles.
- Respondents with training in the TRC model generally had higher scores than other respondents.
4.5.5.2 Staff Safety
The Staff Safety Subscale of the TIPS Data Analysis Tool measures staff member perceptions of their physical, psychological, and emotional safety in the workplace, including feeling supported by supervisors and co-workers during challenging times, feeling that the environment is professional, that the expectations for employees are clear and reasonable, that the environment is physically safe, and that individuals feel safe expressing opinions and concerns to other staff members . Respondents answered on a five point scale with options ranging from 1 “Strongly Disagree” to 5 “Strongly Agree” to statements like “Procedures for handling emergencies are well-thought out, learned and practiced.” and “People here behave responsibly and professionally.” Individual responses to each of the questions in this scale can be found in Appendix B: Detailed Question Responses by Scale. Lower scores on this scale indicate staff members feel staff safety is an area of growth at their workplace, and higher scores indicate staff members feel staff safety is an area of strength.
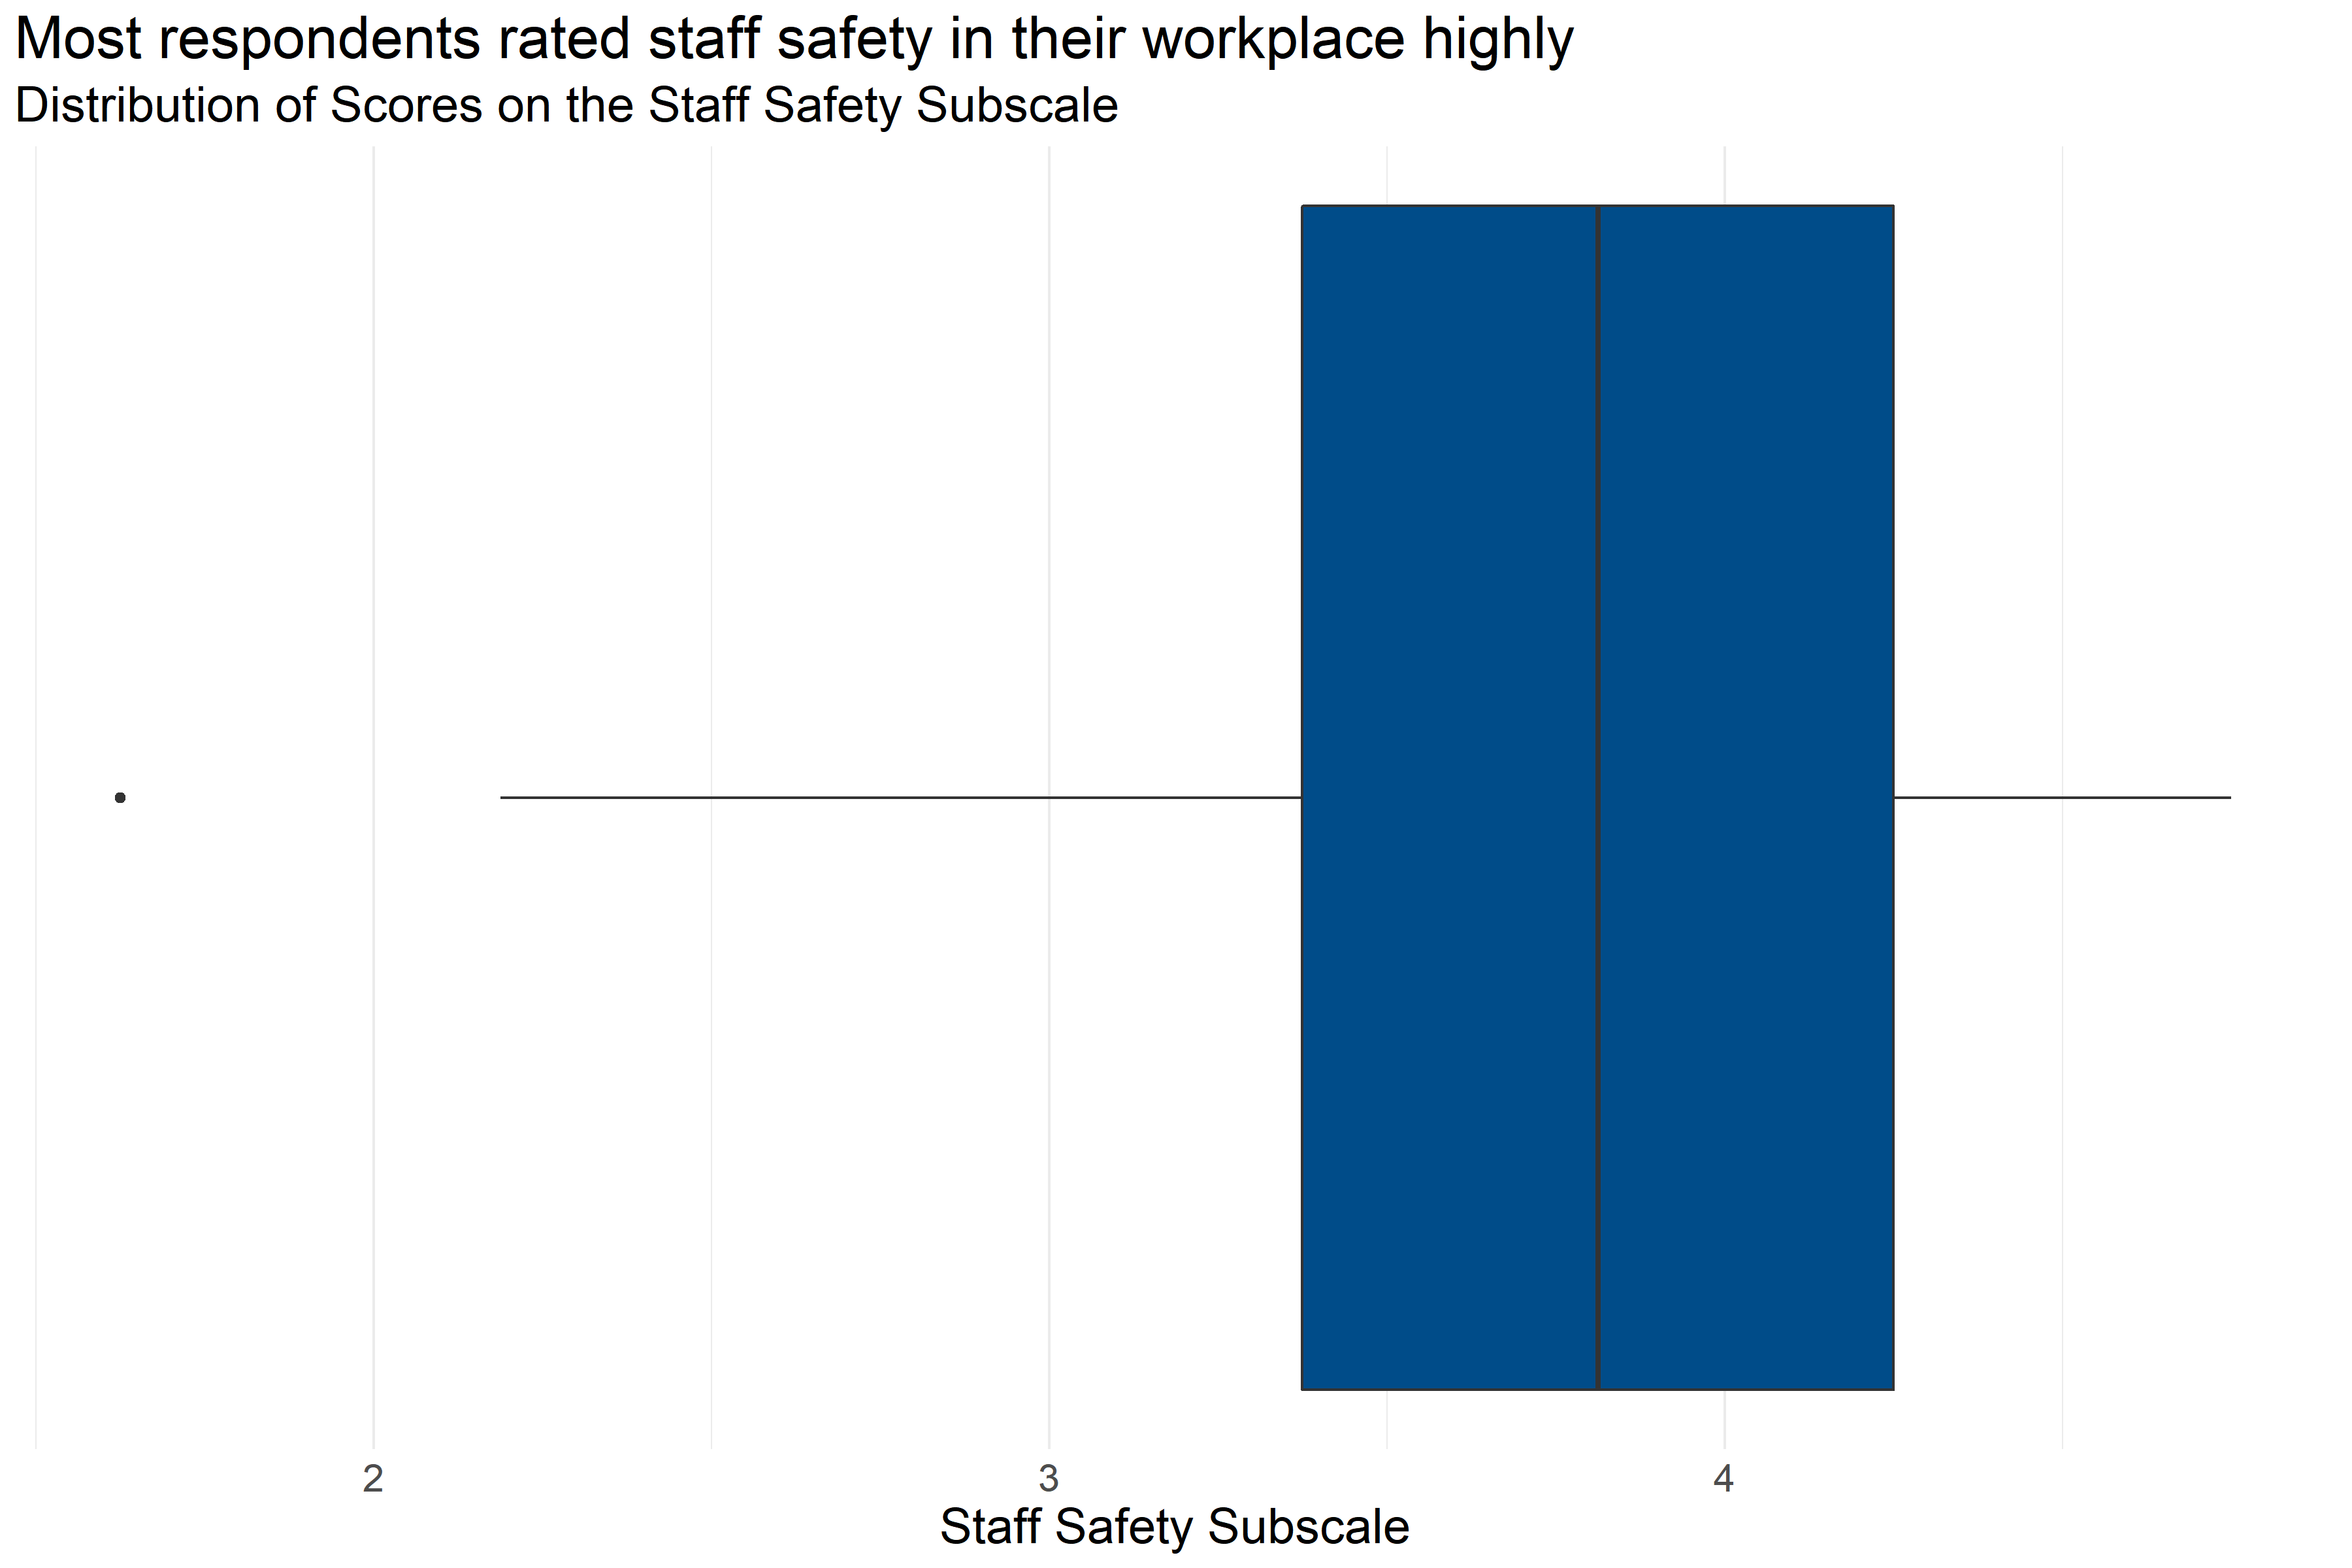
Figure 4.41: Boxplot of score distributions for Staff Safety Subscale
| Number of Answers | Average Score | Lowest Score | First Quartile | Median | Third Quartile | Highest Score |
|---|---|---|---|---|---|---|
| 215 | 3.75 | 1.62 | 3.38 | 3.81 | 4.25 | 4.75 |
Figure 4.41 and Table 4.35 provide information about how respondents scored on the Staff Safety Subscale. They provide the following information:
- Response: 215 respondents answered all questions in the scale.
- Average: The average score was 1.62.
- Range: Scores ranged from 3.75 to 4.75.
- Median: About half of respondents scored below 3.81 and half scored above 3.81.
- Interquartile Range: If the range of responses were cut into quarters, the middle half of respondents (between the first and third quartiles) scored between 3.38 and 4.25.
This means that on average respondents gave responses that were between neutral and moderately agreeing but leaning towards agreeing.
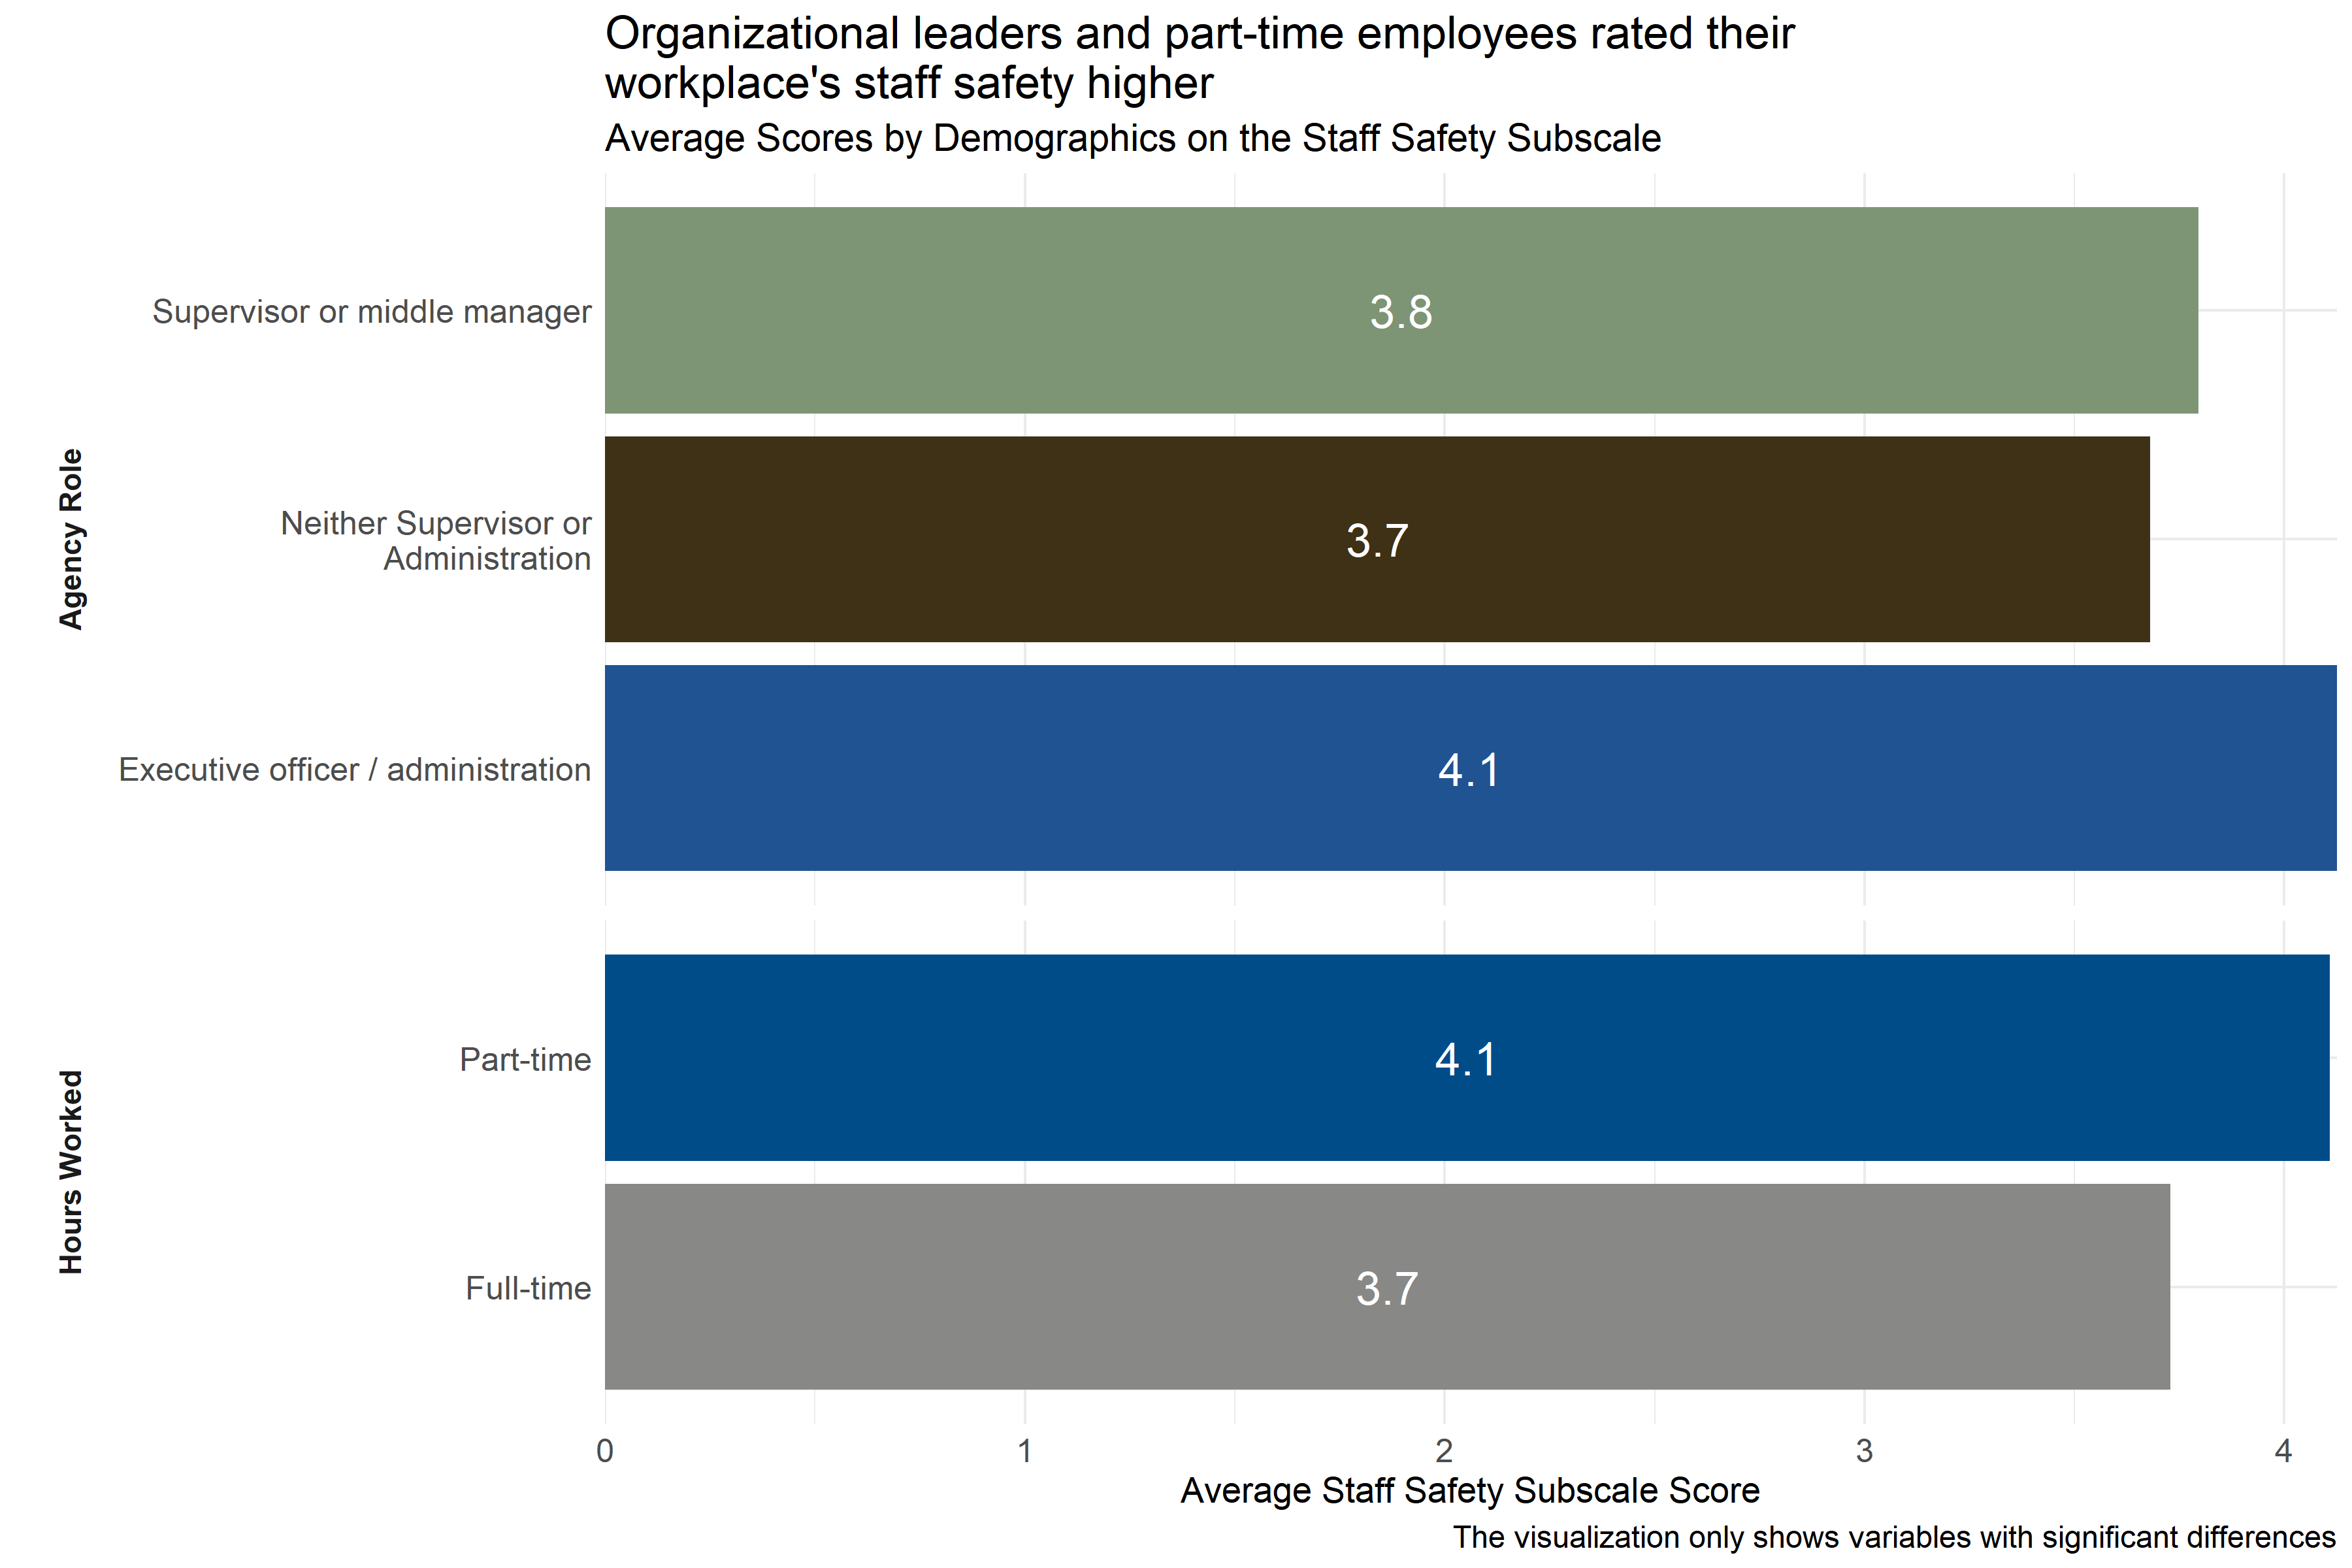
Figure 4.42: Average scores for Staff Safety Subscale across demographic groups
Analysts tested the average scores on the Staff Safety Subscale across demographic groups to identify differences in how respondents answered questions about staff safety practices at their agencies. As Figure 4.42 shows, there were differences in responses from respondents in different agency roles, working different hours, and working in different types of settings. Executive officers and administrators and part-time employees scored their workplaces higher on indicators of staff safety than staff in other roles did.
Analysts also observed significant differences in ratings between respondents from specific agencies, but those scores are not shown in Figure 4.42 above to protect the privacy of those agencies.
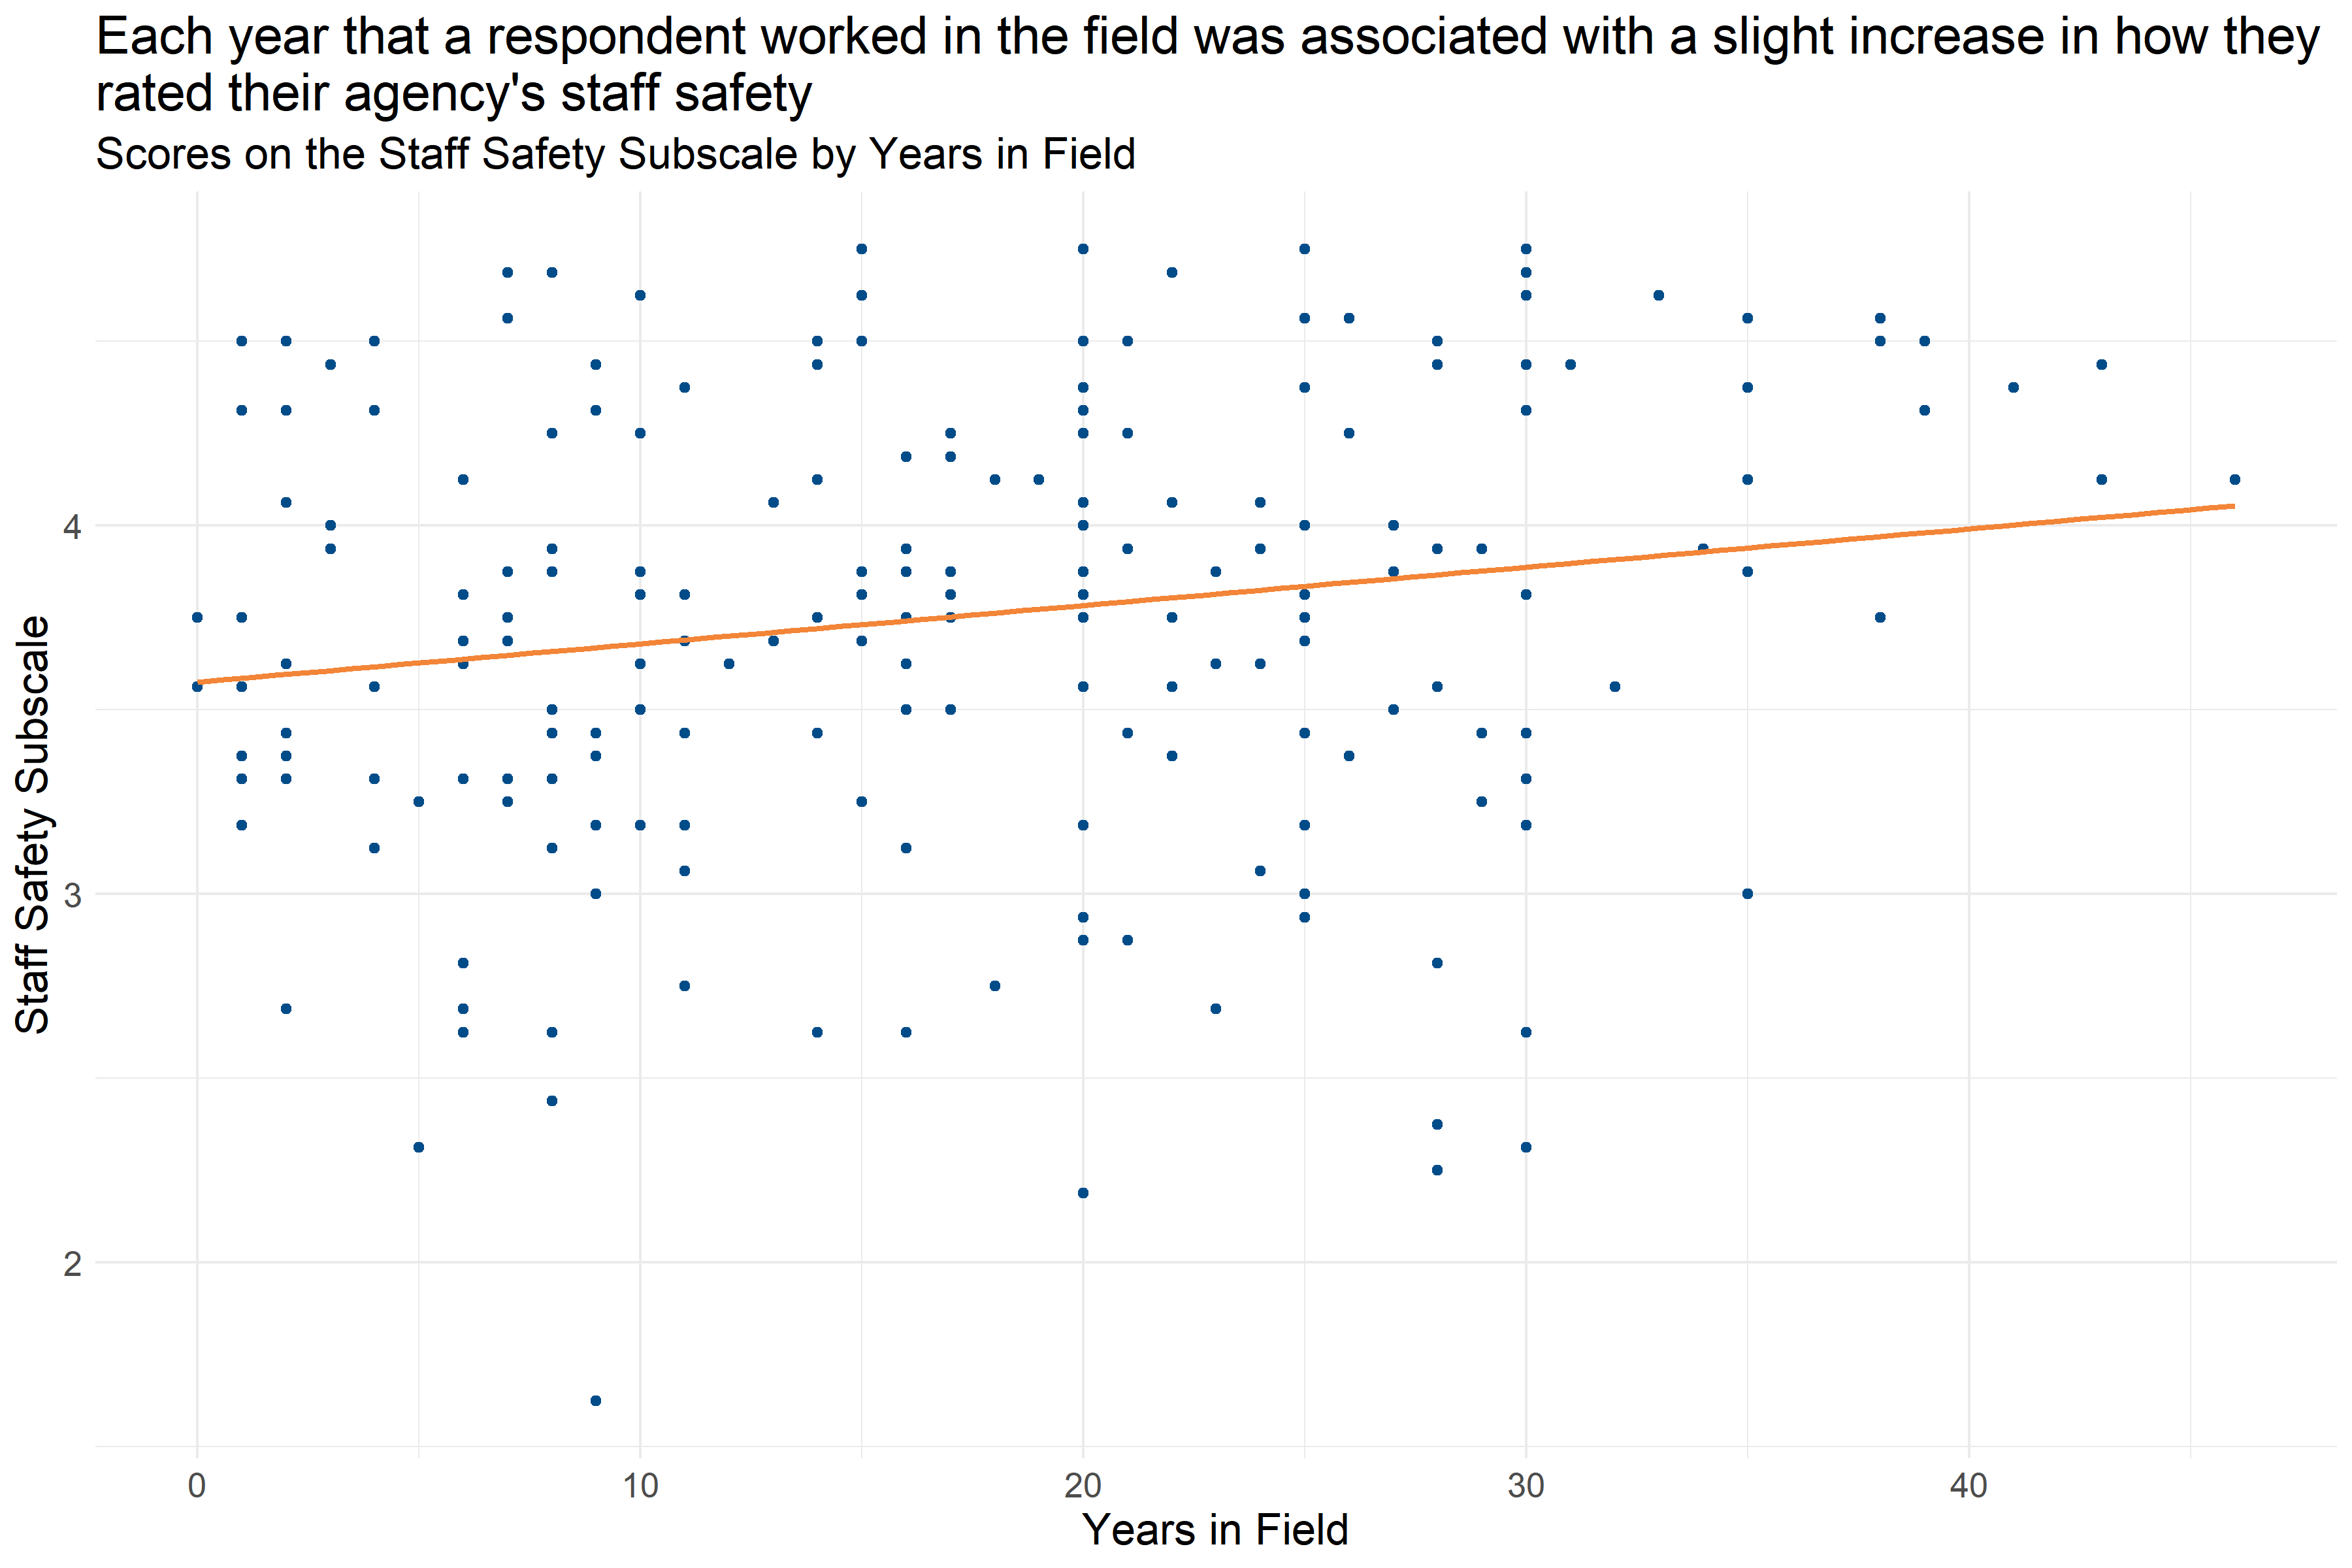
Figure 4.43: Scatter plot of Years in Field and Staff Safety Subscale score
Figure 4.43 shows that each year that a respondent worked in the field was associated with a slight increase in their Staff Safety Subscale score (increase of about 0.13 per year). This suggests that staff with more experience are slightly more likely to report staff safety practices at their agency that are more aligned with a Trauma Informed Care model.
4.5.5.3 Staff Empowerment
The Staff Empowerment Subscale of the TIPS Data Analysis Tool measures whether staff members feel like they are empowered through being supported in improving their work, having choice in how they conduct their work, feeling that input is considered and not ignored, having opportunities to work together to develop solutions to problems, and feeling that supervisors understand a staff member’s strengths. Respondents answered on a five point scale with options ranging from 1 “Strongly Disagree” to 5 “Strongly Agree” to statements like “I feel I have a lot of choice in how I do my job.” and “I am supported in learning new things that will make me better at my job.” Individual responses to each of the questions in this scale can be found in Appendix B: Detailed Question Responses by Scale. Lower scores on this scale indicate staff members feel staff empowerment is an area of growth at their workplace, and higher scores indicate staff members feel staff empowerment is an area of strength.
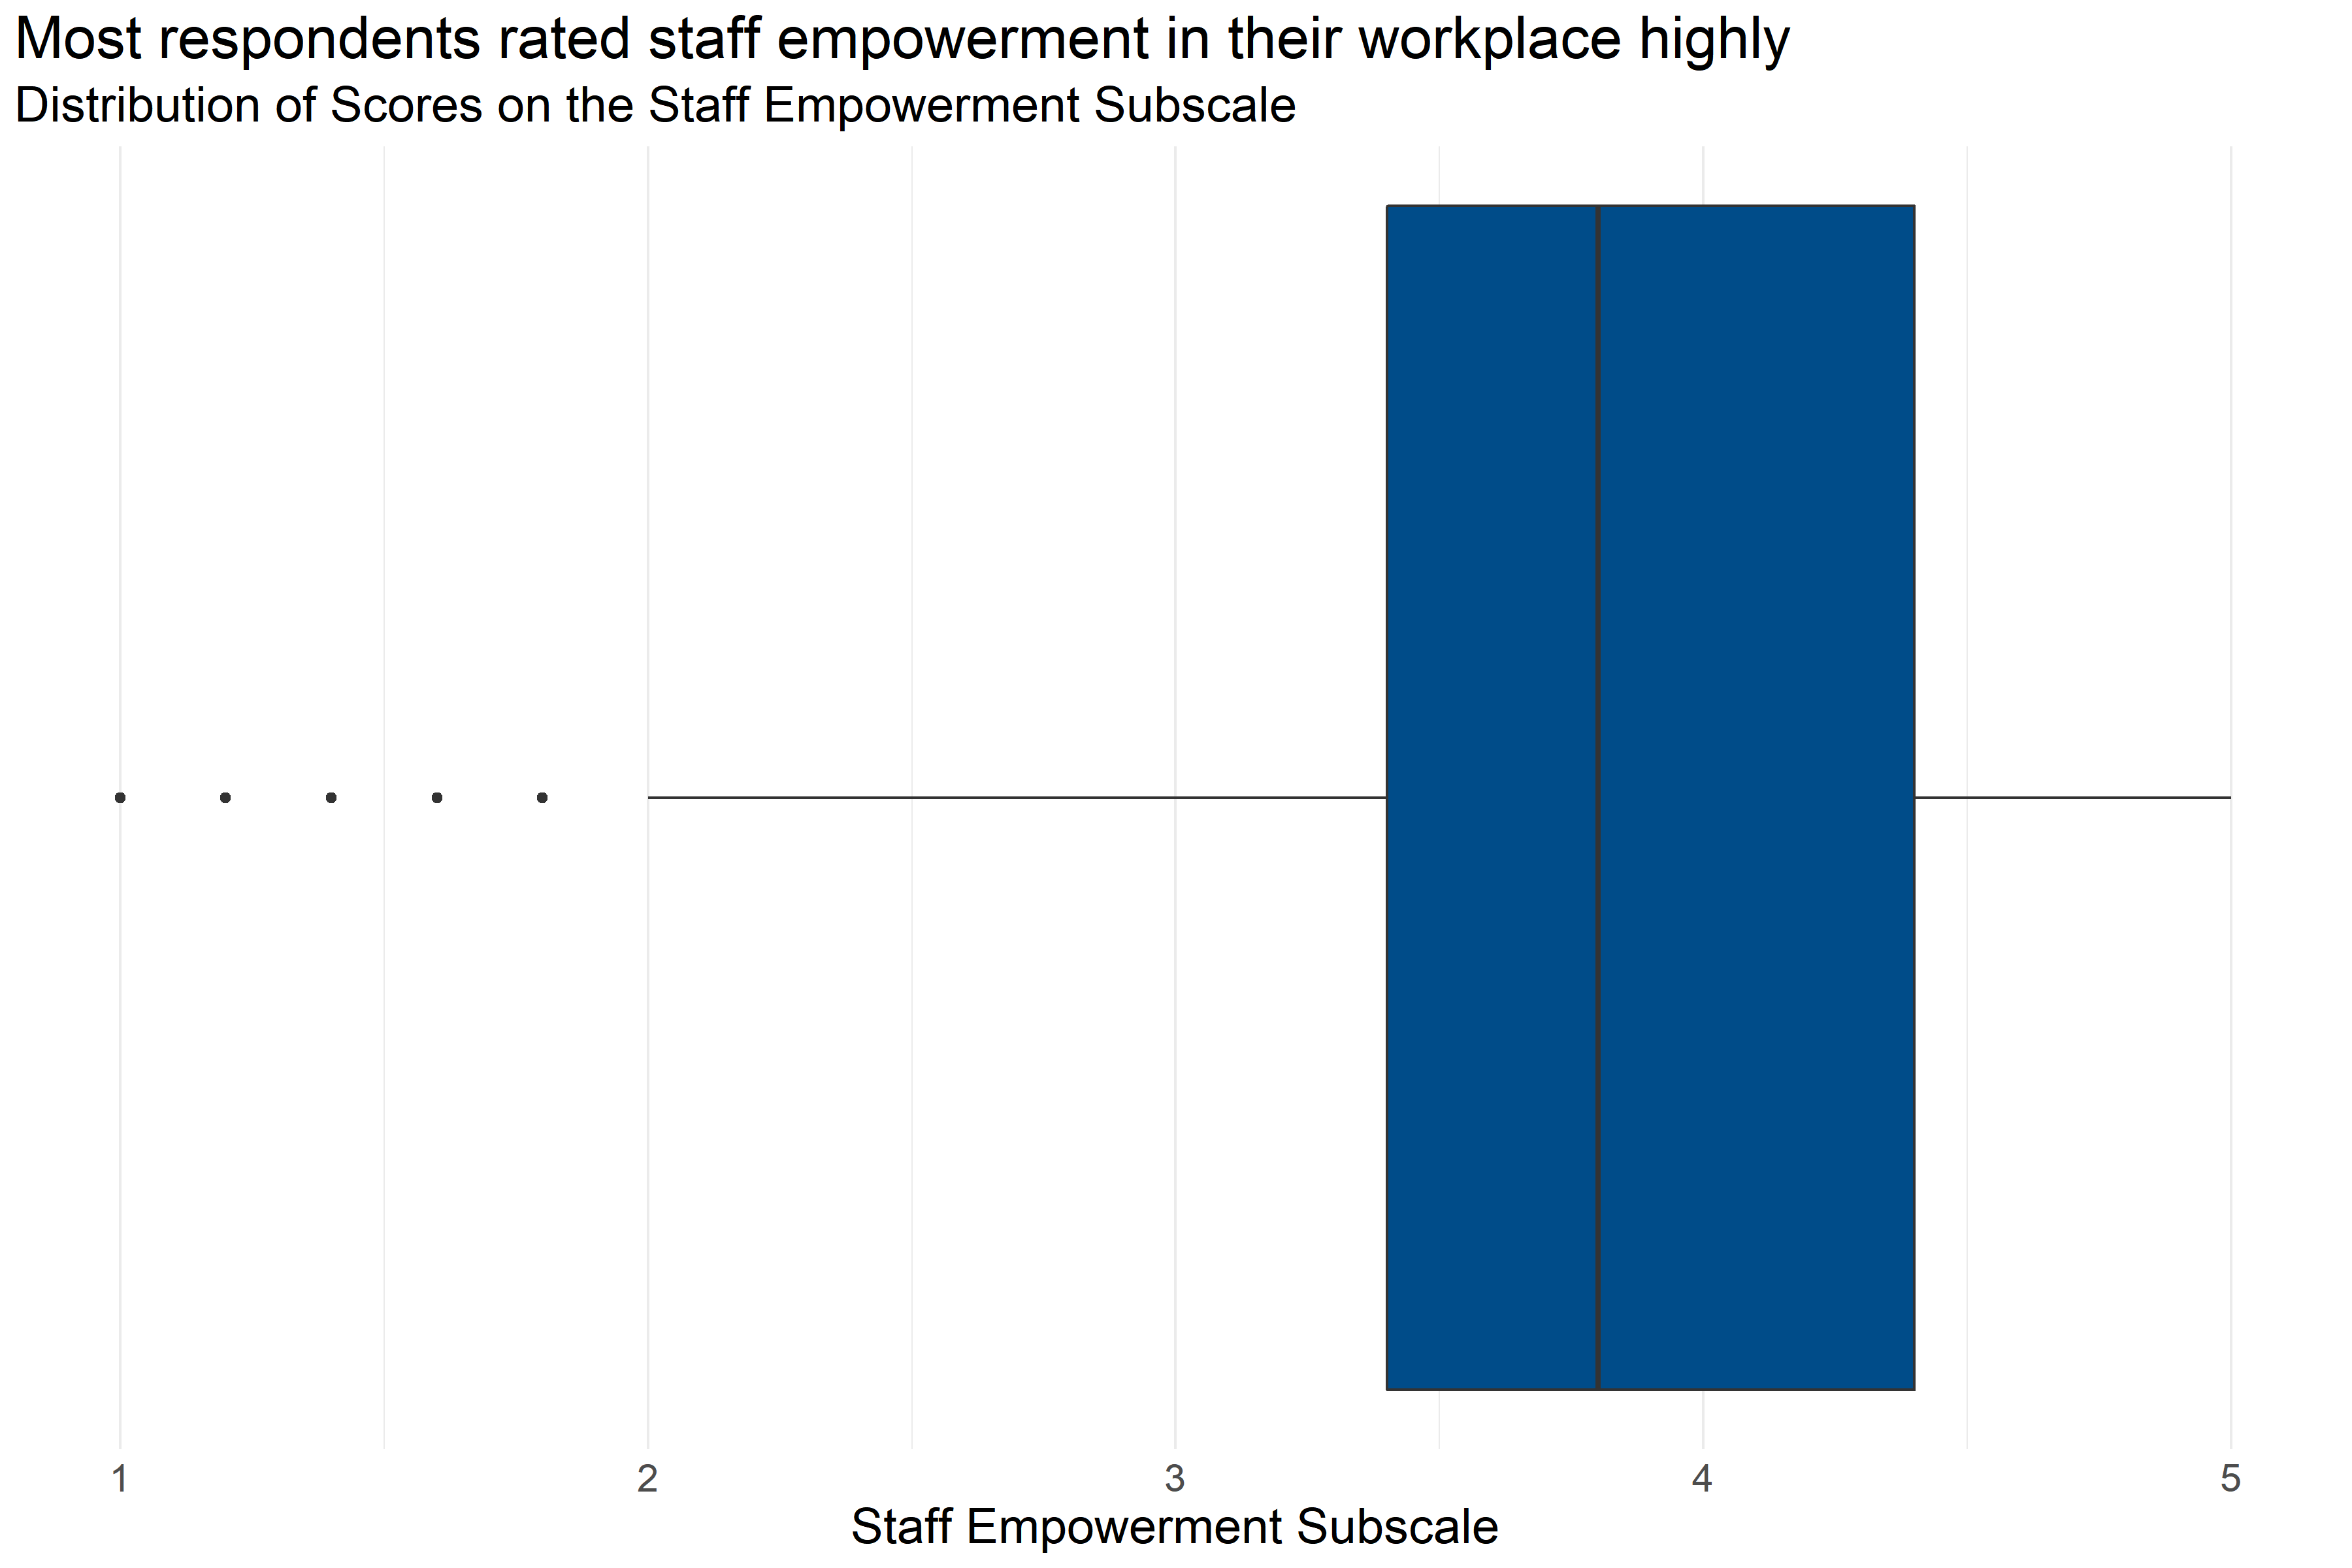
Figure 4.44: Boxplot of score distributions for the Staff Empowerment Subscale
| Number of Answers | Average Score | Lowest Score | First Quartile | Median | Third Quartile | Highest Score |
|---|---|---|---|---|---|---|
| 235 | 3.76 | 1 | 3.4 | 3.8 | 4.4 | 5 |
Figure 4.44 and Table 4.36 provide information about how respondents scored on the Staff Empowerment Subscale. They provide the following information:
- Response: 235 respondents answered all questions in the scale.
- Average: The average score was 1.
- Range: Scores ranged from 3.76 to 5.
- Median: About half of respondents scored below 3.8 and half scored above 3.8.
- Interquartile Range: If the range of responses were cut into quarters, the middle half of respondents (between the first and third quartiles) scored between 3.4 and 4.4.
This means that about half of respondents generally answered that they agreed or strongly agreed with statements about their staff empowerment while on the job that were consistent with a Trauma Informed Model.
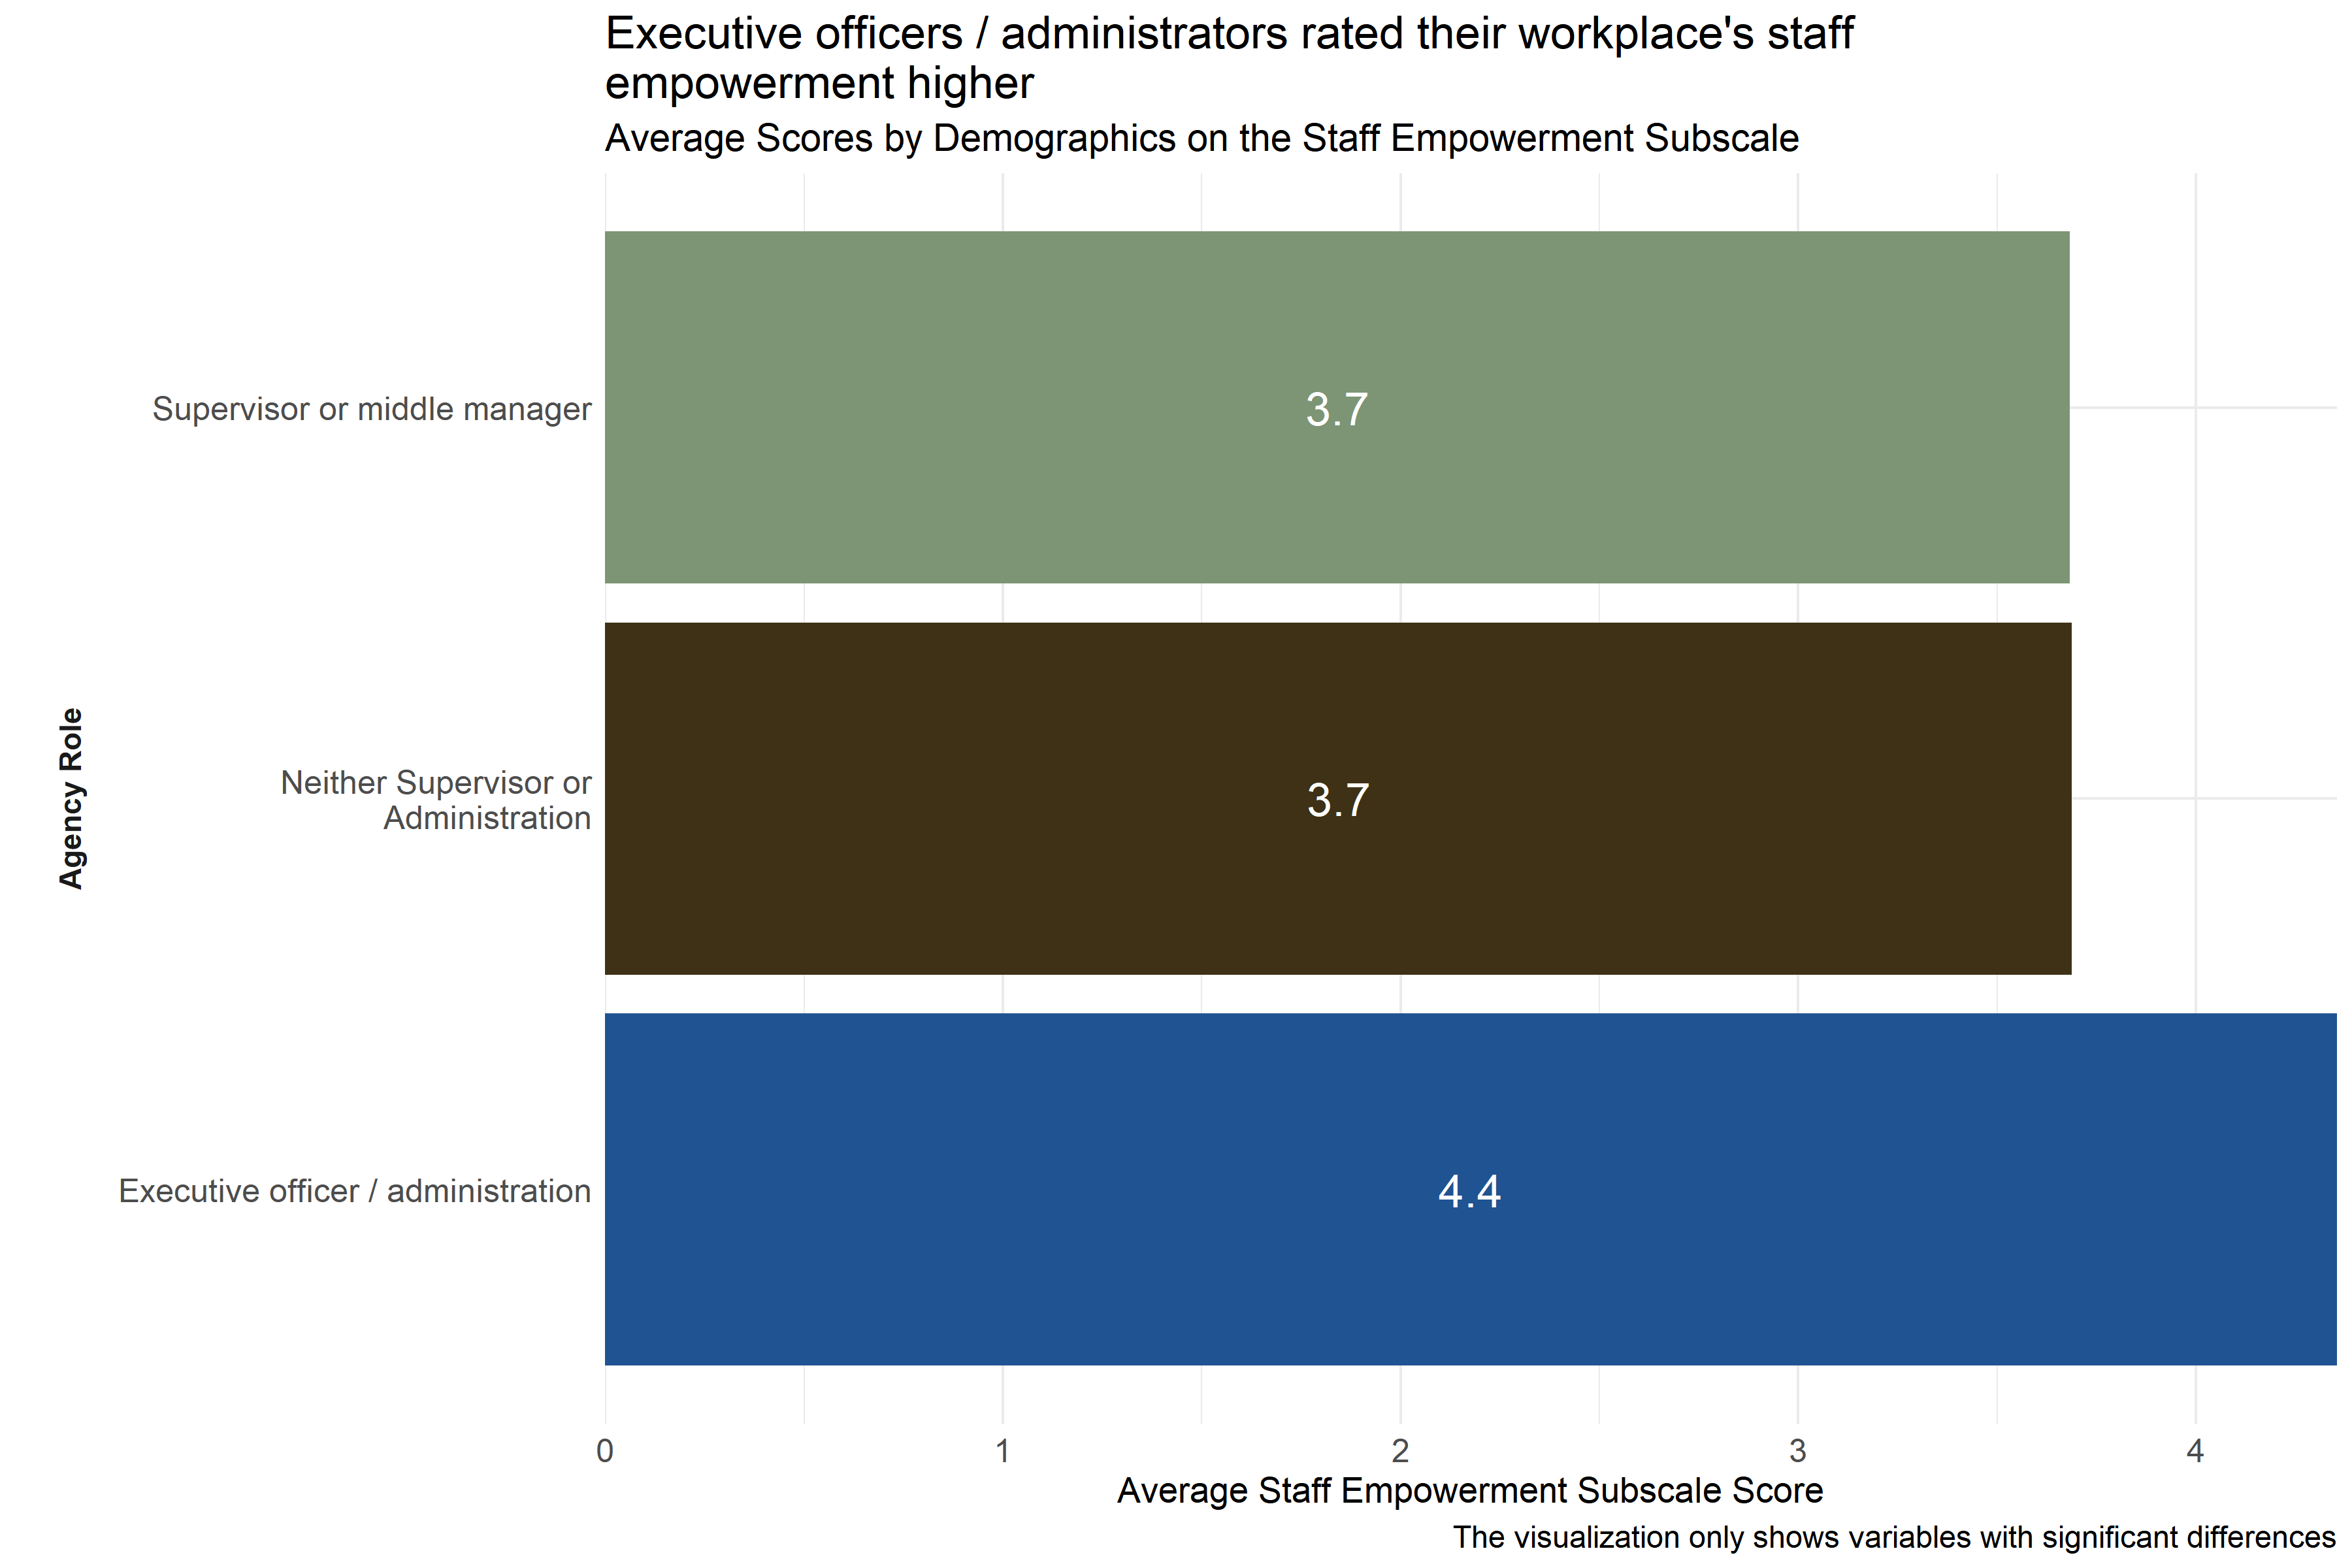
Figure 4.45: Average scores for Staff Empowerment Subscale across demographic groups
Analysts tested the average scores on the Staff Empowerment Subscale across demographic groups to identify differences in how respondents answered questions about staff empowerment practices at their agencies. As Figure 4.45 shows, executive officers / administrators scored their workplaces higher on indicators of staff empowerment practices than staff in other roles did.
Analysts also observed significant differences in ratings between respondents from specific agencies, but those scores are not shown in Figure 4.45 above to protect the privacy of those agencies.
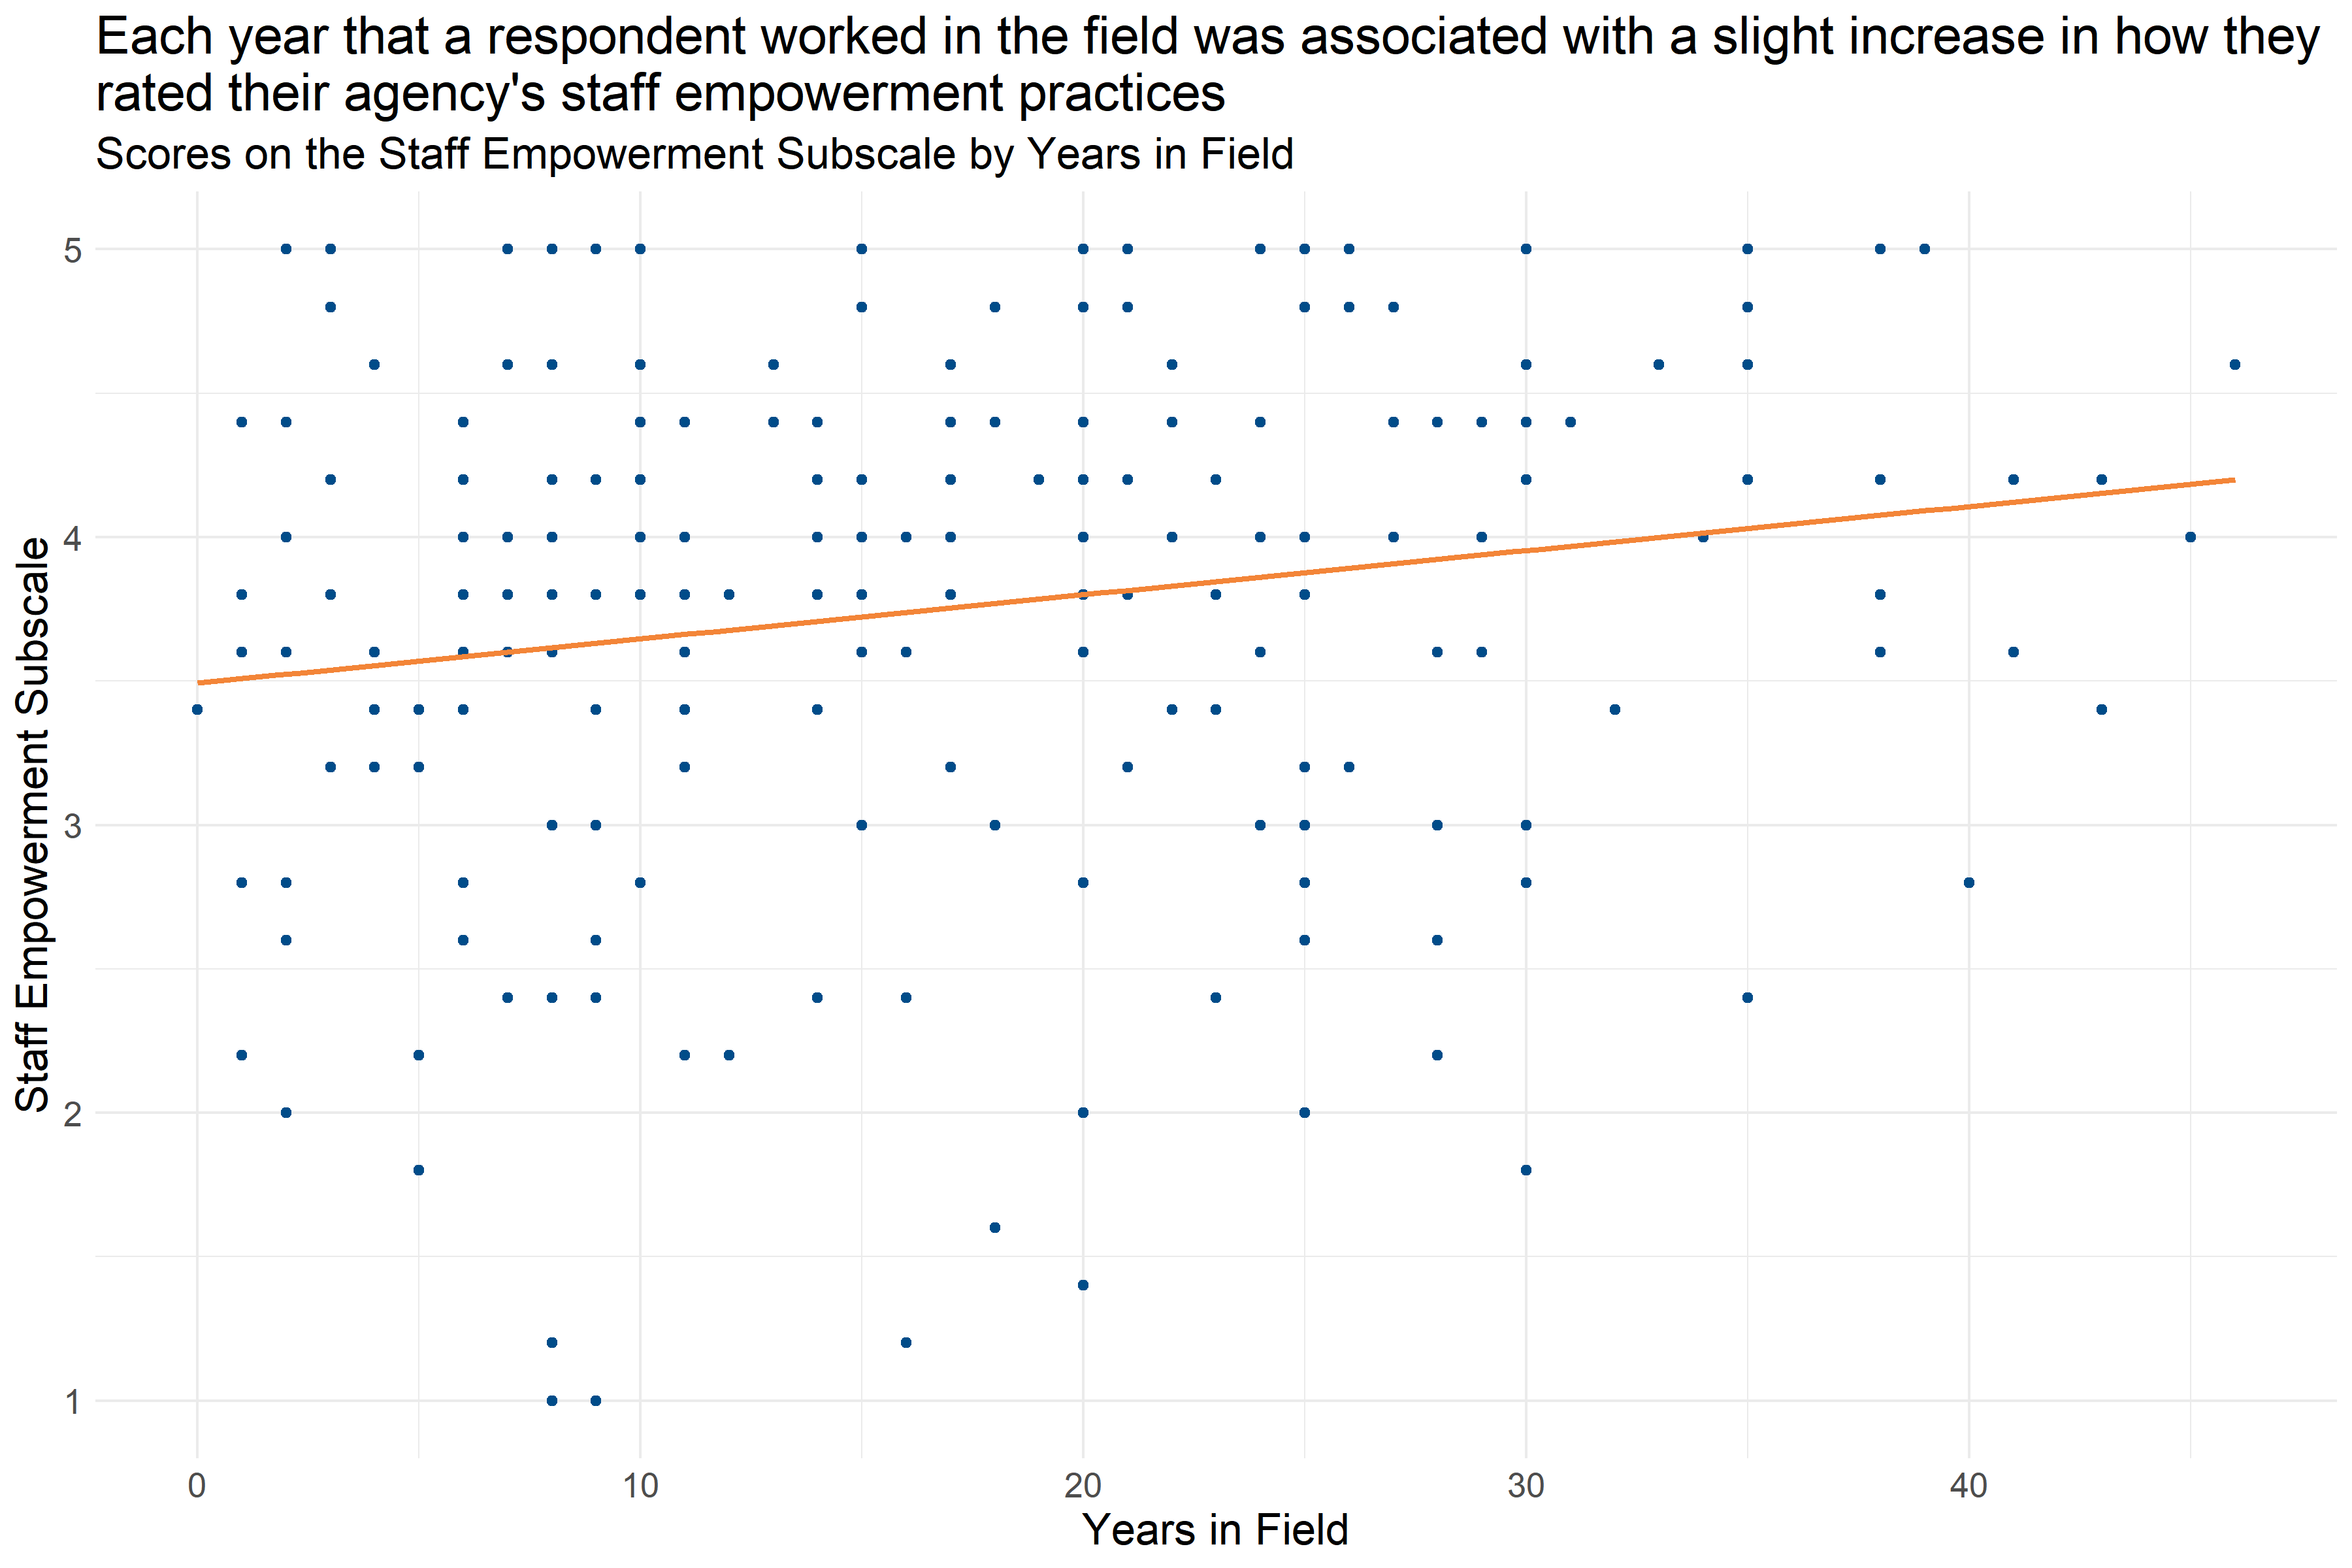
Figure 4.46: Scatter plot of Years in Field and Staff Empowerment Subscale Score
Figure 4.46 shows that each year that a respondent worked in the field was associated with a slight increase in their Staff Empowerment Subscale score (increase of about 0.15 per year). This suggests that staff with more experience are slightly more likely to report staff empowerment practices at their agency that are more aligned with a Trauma Informed Care model.
4.5.5.4 Self-Care
The Self Care Subscale domain measures various aspects of current self-care practices such as feeling that there are procedures for ensuring safety if a place or client makes a staff member feel unsafe, whether there is supervisory support for leaving unsafe situations, whether staff are encouraged to prioritize self-care, and whether there are physical places within an agency to de-stress and relax. Respondents answered on a five point scale with options ranging from 1 “Strongly disagree” to 5 “Strongly agree” to statements like “We have procedures for maintaining safety when a place or client makes one of us feel unsafe.” and “Staff here are encouraged to take care of themselves.” Individual responses to each of the questions in this scale can be found in Appendix B: Detailed Question Responses by Scale. Lower scores on this scale indicate staff members feel self-care practices are an area of growth at their workplace, and higher scores indicate staff members feel self-care practices are an area of strength.
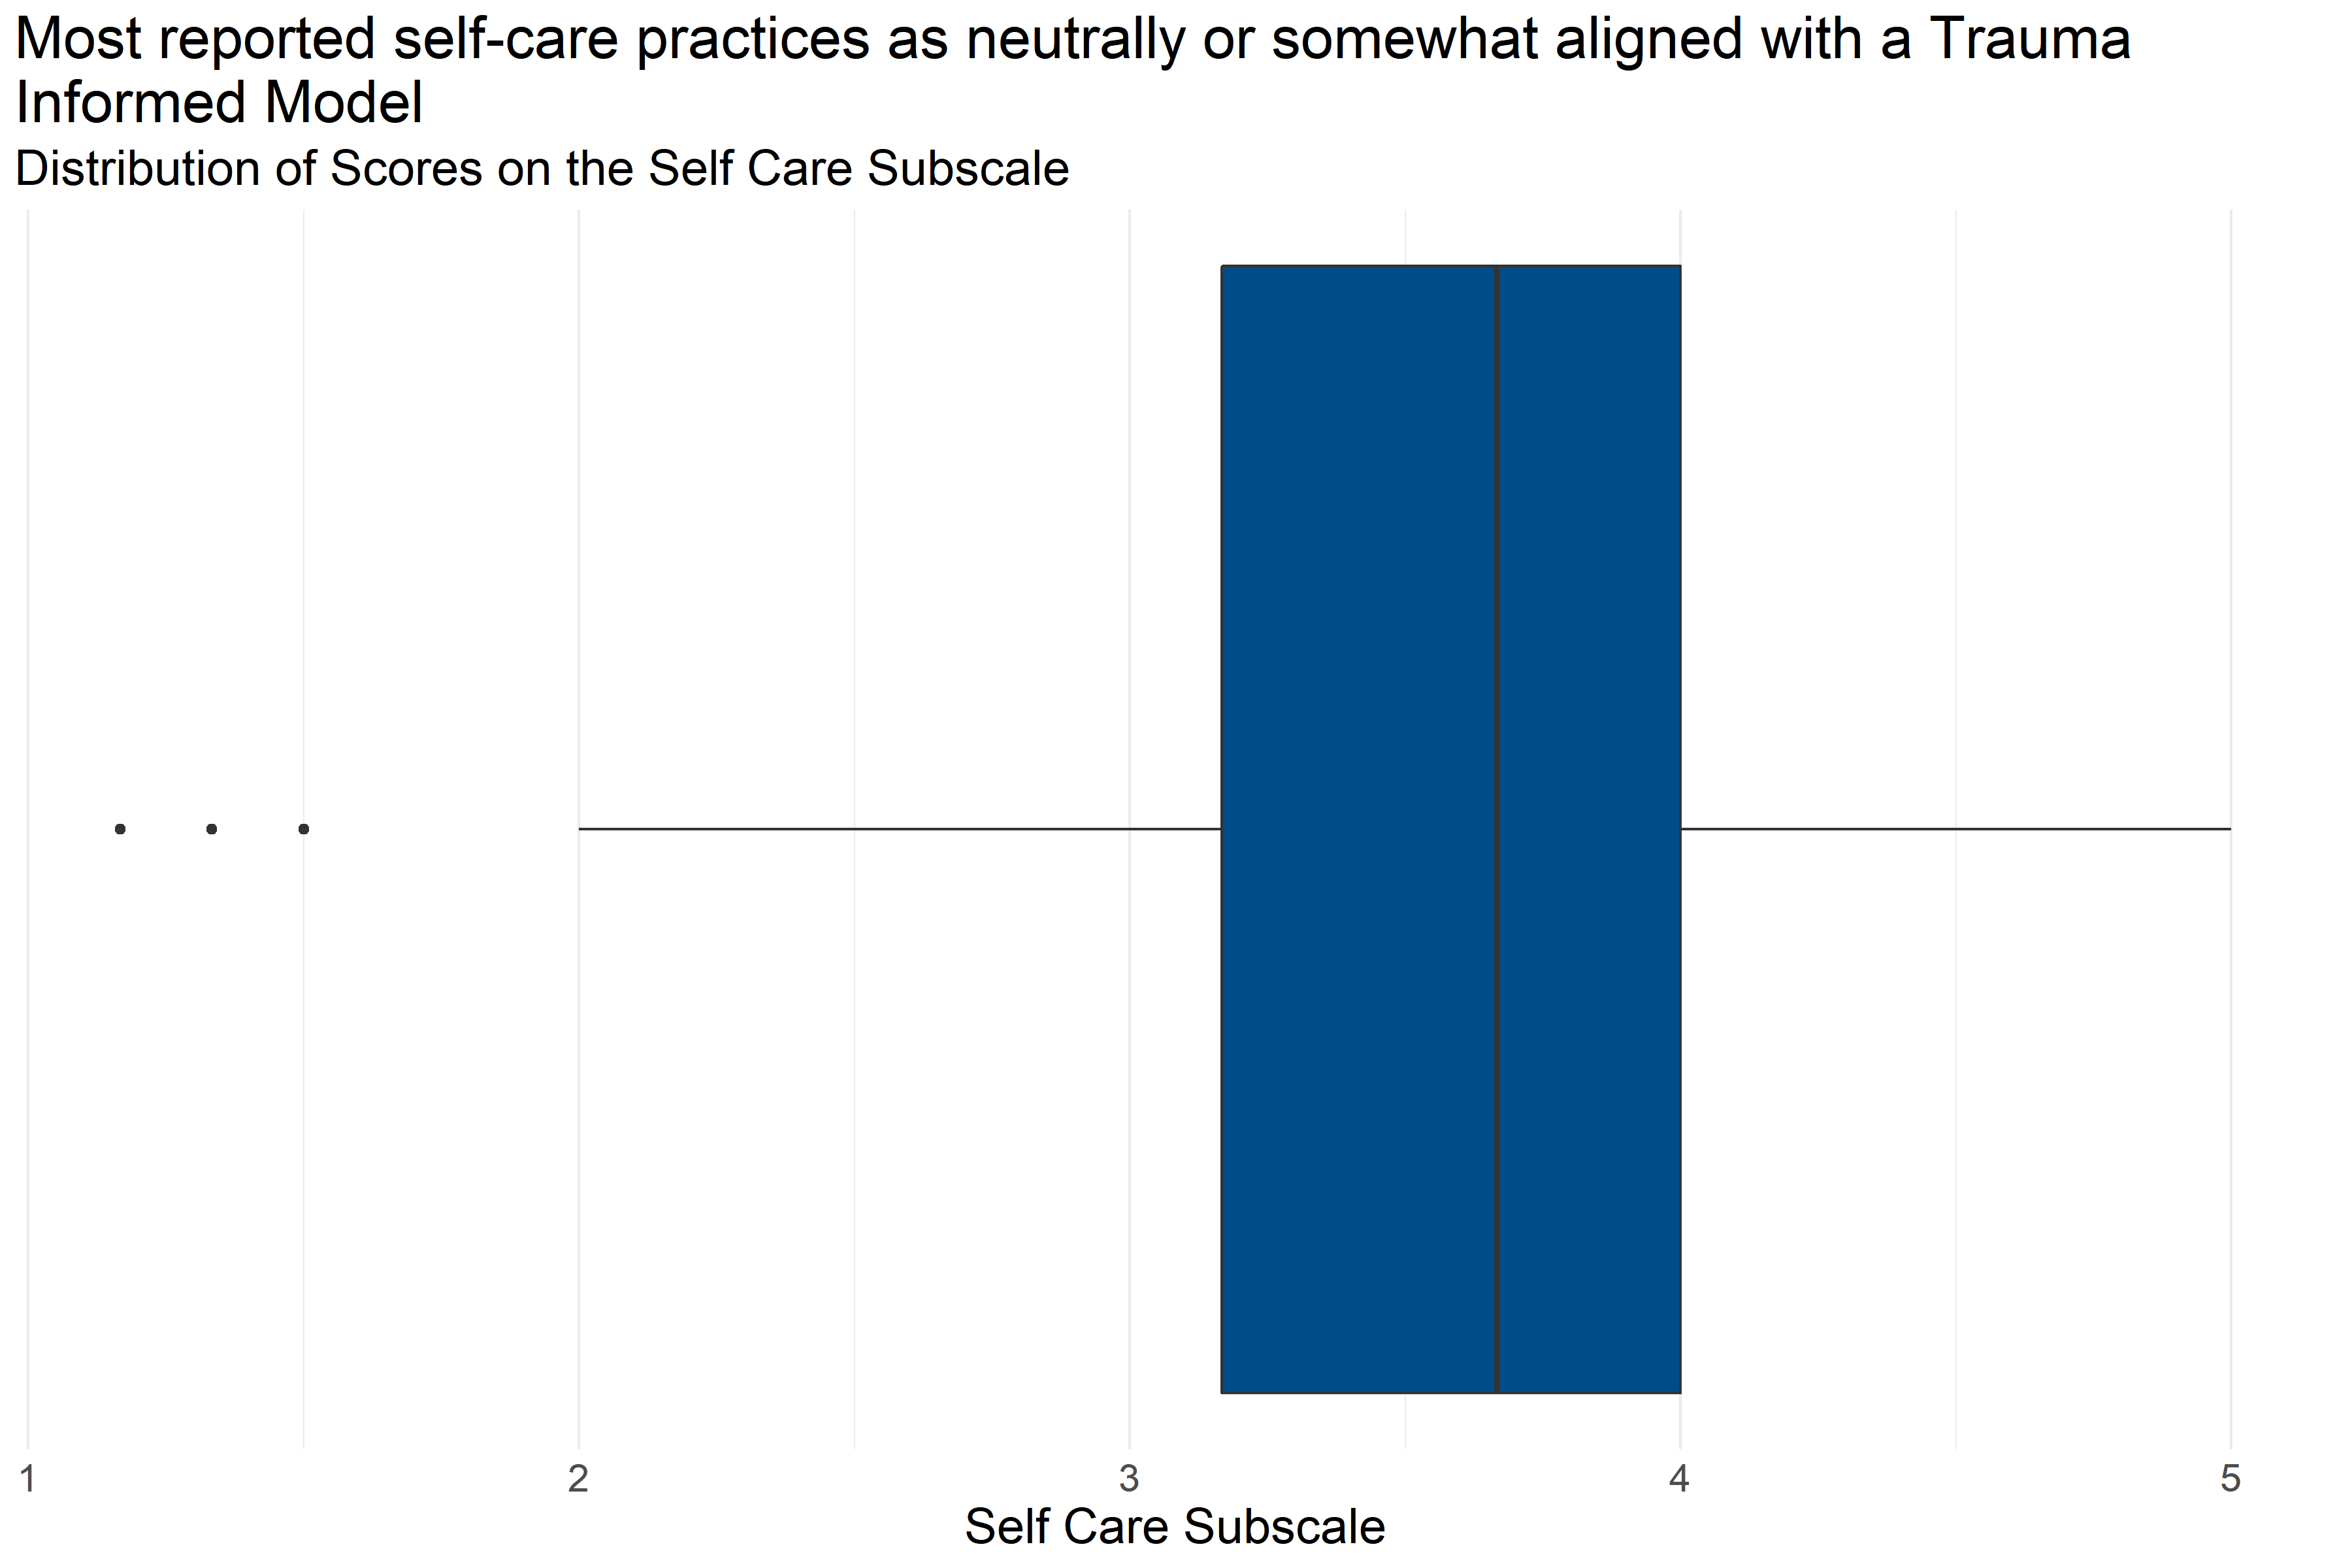
Figure 4.47: Boxplot of score distributions for Self Care Subscale
| Number of Answers | Average Score | Lowest Score | First Quartile | Median | Third Quartile | Highest Score |
|---|---|---|---|---|---|---|
| 217 | 3.59 | 1.17 | 3.17 | 3.67 | 4 | 5 |
Figure 4.47 and Table 4.37 provide information about how respondents scored on the Self Care Subscale. They provide the following information:
- Response: 217 respondents answered all questions in the scale.
- Average: The average score was 1.17.
- Range: Scores ranged from 3.59 to 5.
- Median: About half of respondents scored below 3.67 and half scored above 3.67.
- Interquartile Range: If the range of responses were cut into quarters, the middle half of respondents (between the first and third quartiles) scored between 3.17 and 4.
This means that about half of respondents gave responses that were neutral or moderately aligned with a Trauma Informed Model.
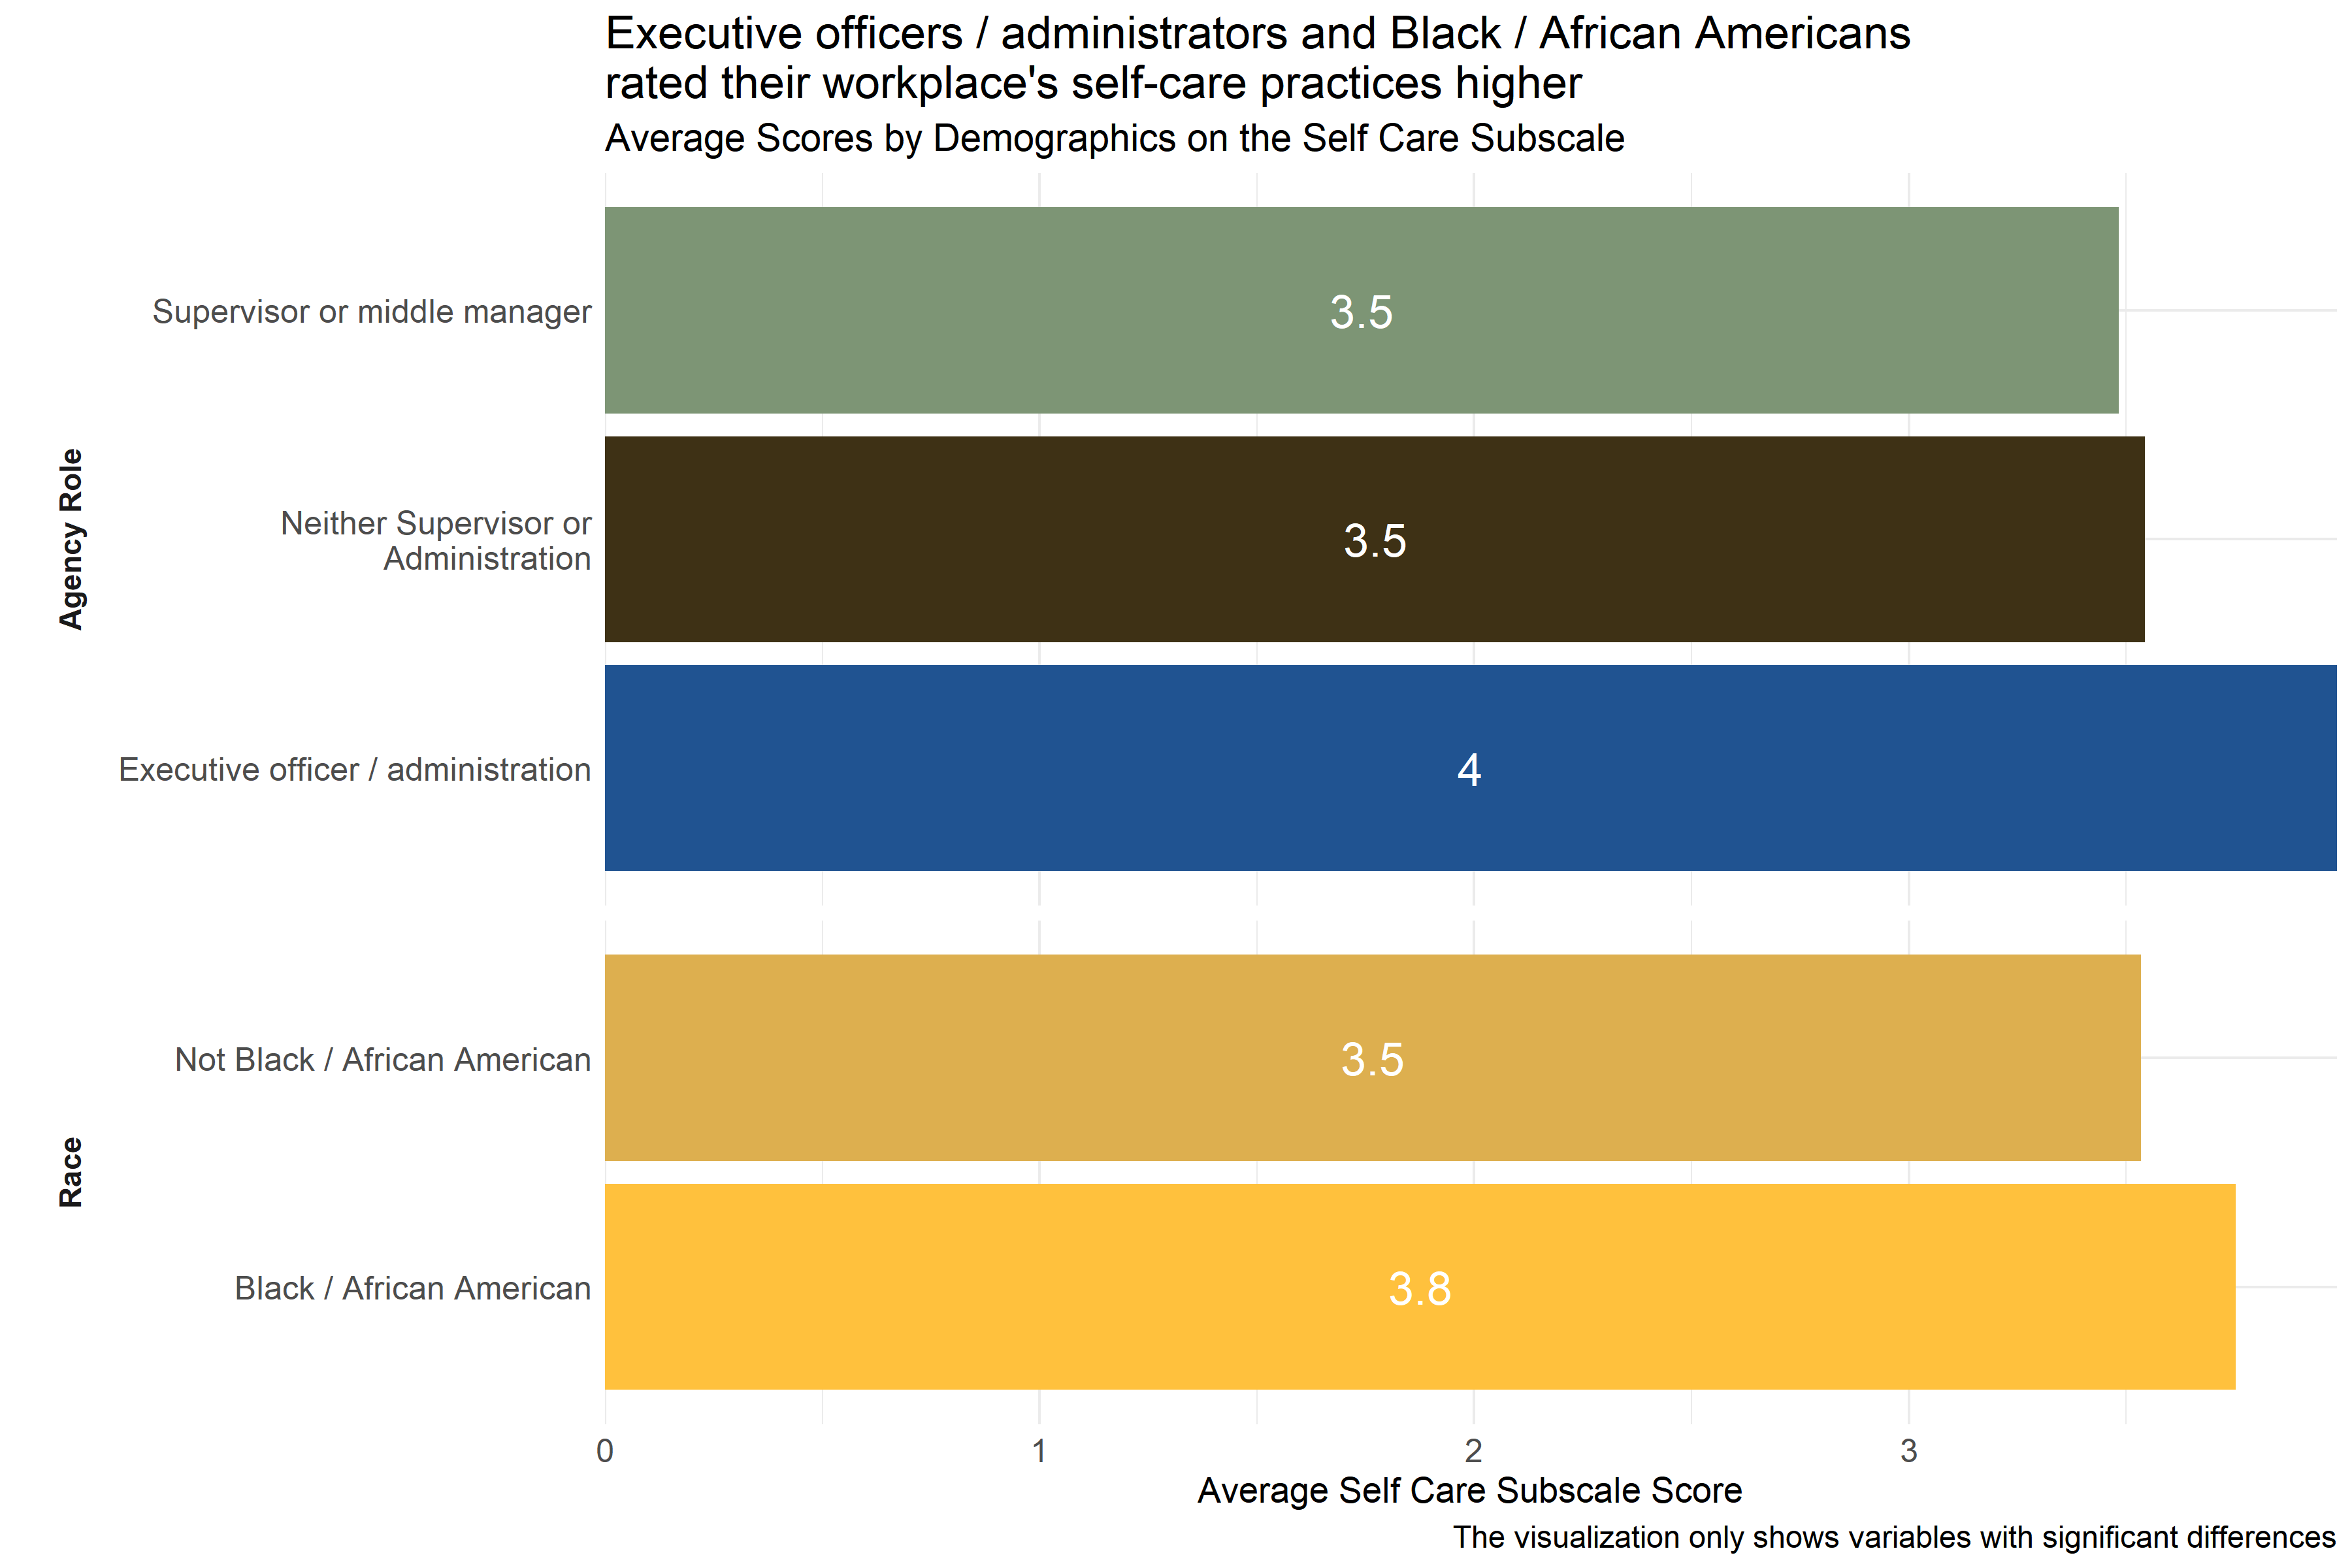
Figure 4.48: Average scores for Self Care Subscale across demographic groups
Analysts tested the average scores on the Self Care Subscale across demographic groups to identify differences in how respondents answered questions about self-care practices at their agencies. As Figure 4.48 shows, there were differences in responses from respondents in different agency roles and race. Executive officers / administrators and Black / African Americans scored their workplaces higher on indicators of self-care practices than staff in other roles did and staff who did not identify as Black / African American. (Respondents were asked to select racial identities from a list of options and could select more than one.)
Analysts also observed significant differences in ratings between respondents from specific agencies, but those scores are not shown in Figure 4.48 above to protect the privacy of those agencies.
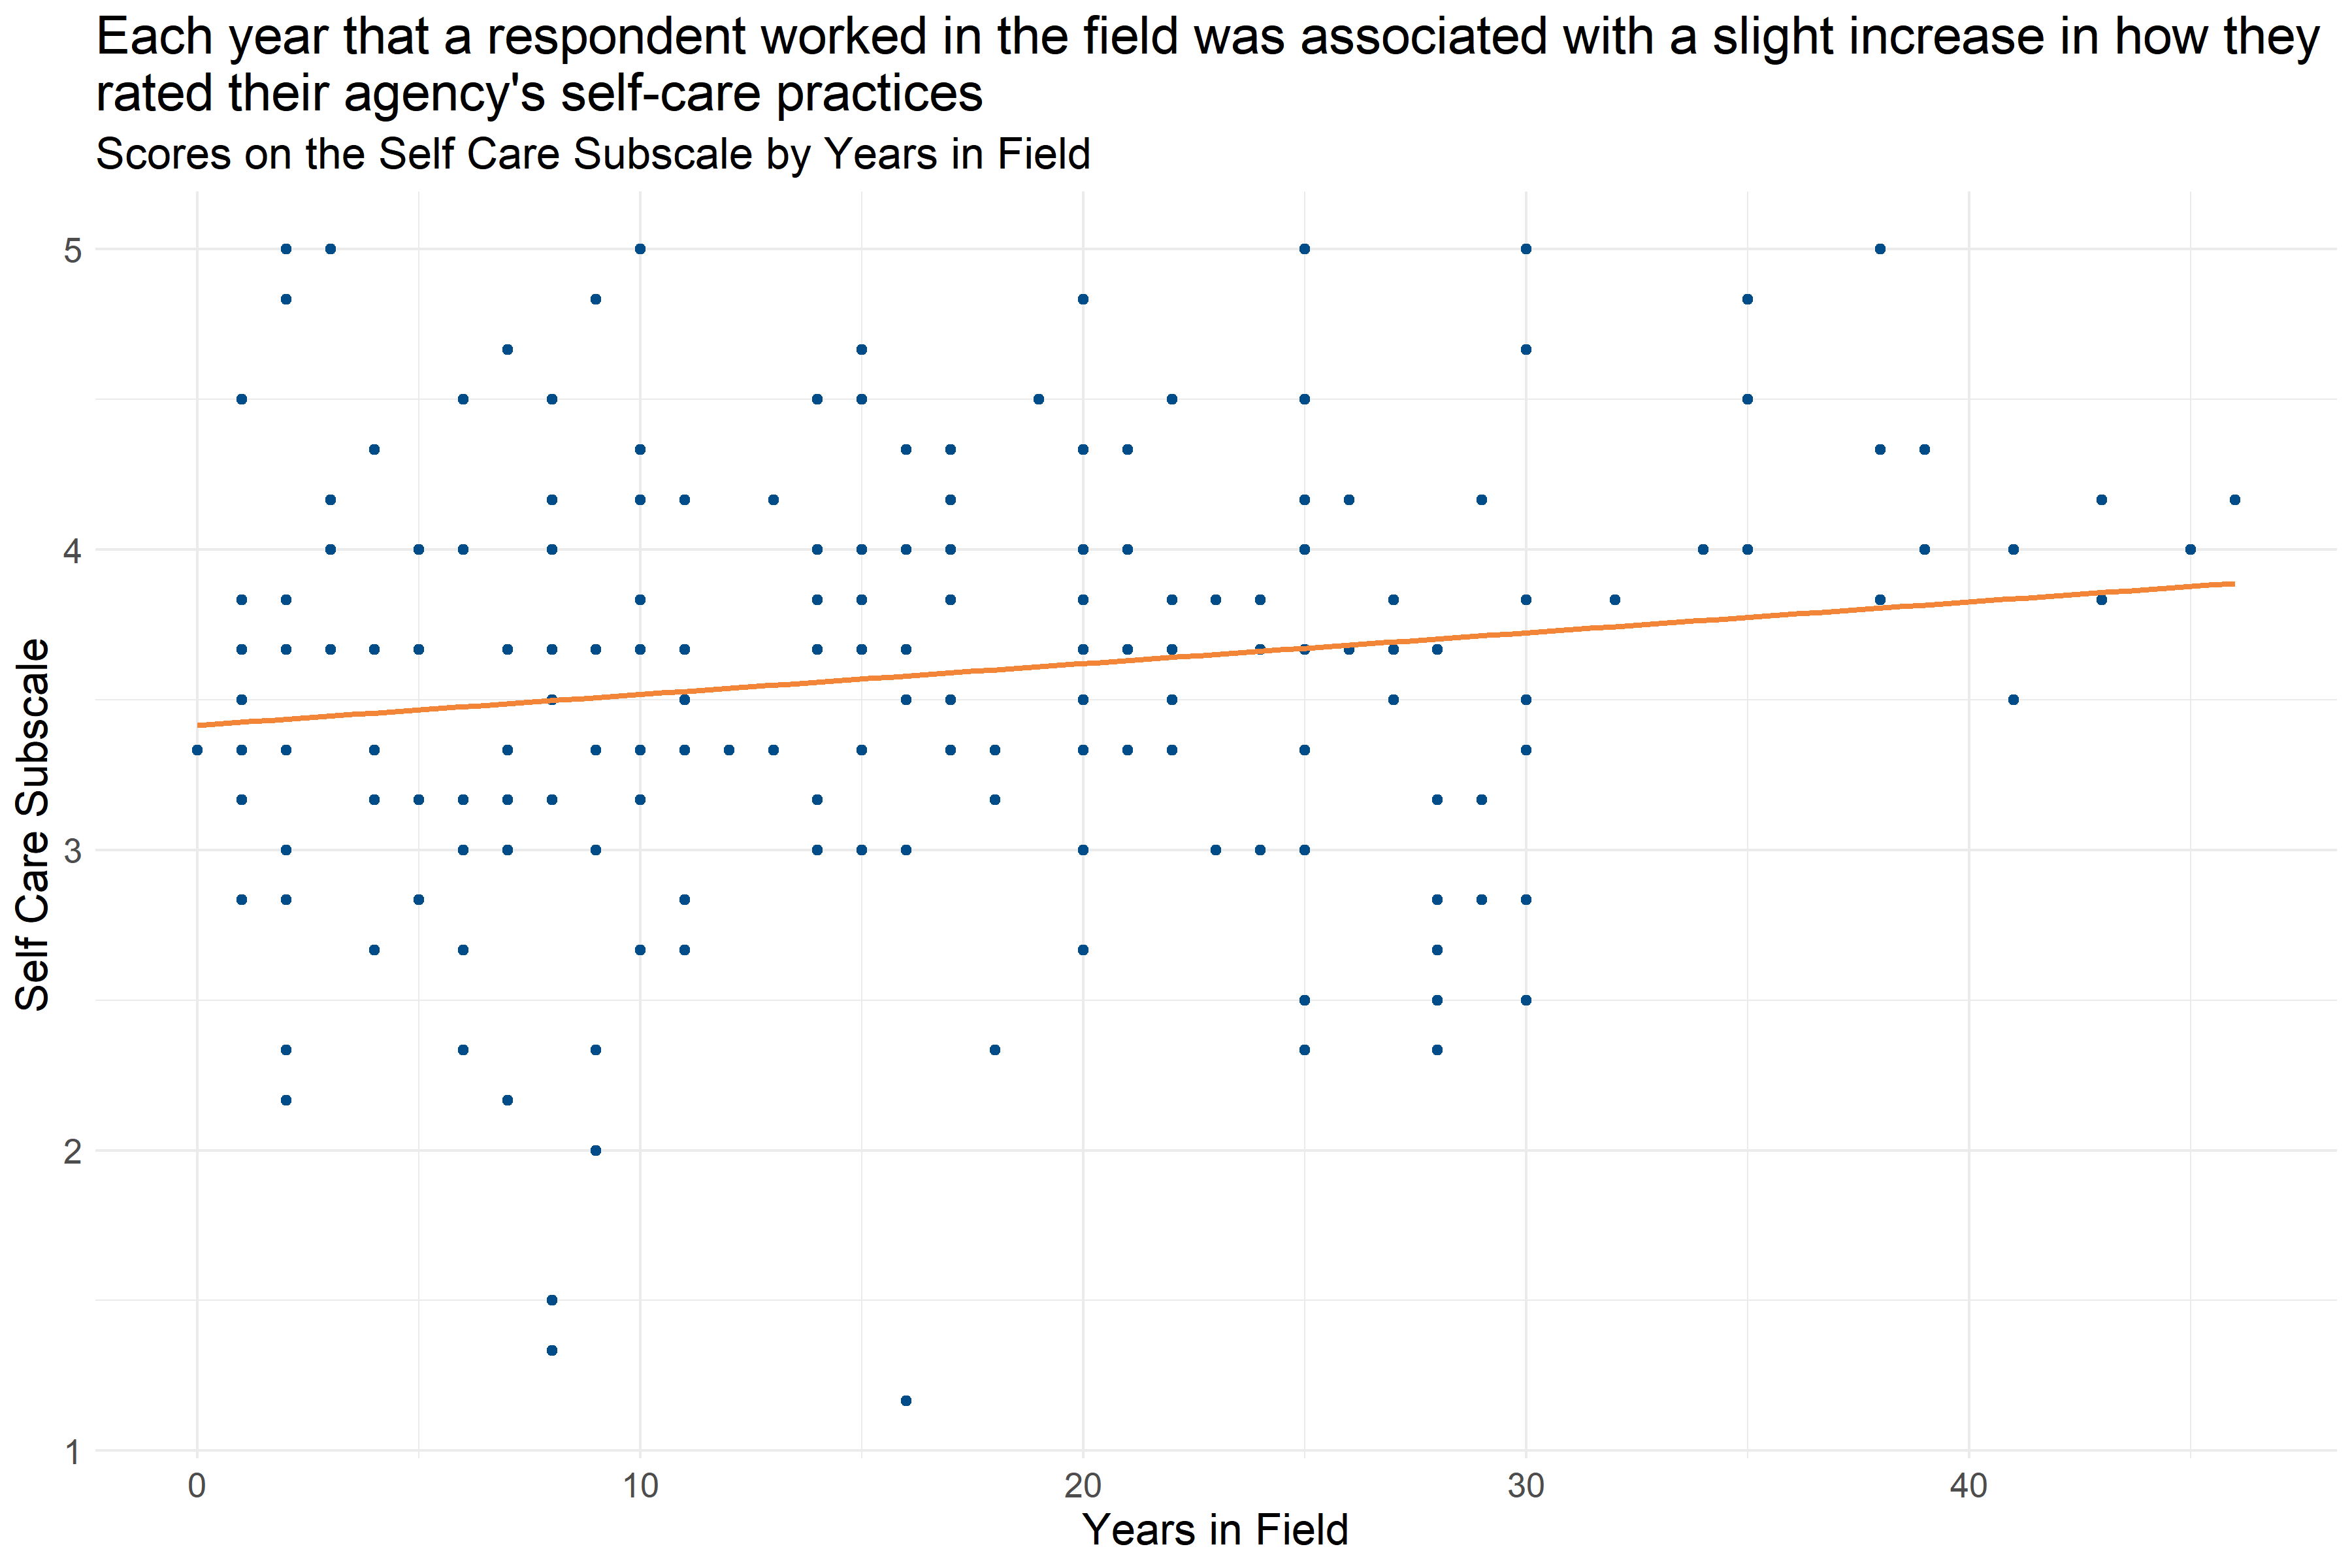
Figure 4.49: Scatter plot of Years in Field and Self Care Subscale Score
Figure 4.49 shows that each year that a respondent worked in the field was associated with a slight increase in their Self Care Subscale score (increase of about 0.10 per year). This suggests that staff with more experience are slightly more likely to report self-care practices at their agency that are more aligned with a Trauma Informed Care model.
4.5.5.5 Staff Knowledge and Competence
The Staff Knowledge and Competence Subscale of the TIPS Data Analysis Tool measures the extent to which staff members perceive that they have the appropriate knowledge and competencies to provide trauma-informed care to clients, feeling comfortable broaching the subject of trauma with clients, working with clients to develop coping strategies for addressing the effects of trauma, and having the skills to help calm agitated clients. The domain also covers the extent to which a staff member feels they understand and can prevent negative personal impacts as a result of the work they are engaged in. Respondents answered on a five point scale with options ranging from 1 “Strongly disagree” to 5 “Strongly agree” to statements like “I believe I understand the impact of trauma on the people I work with.” and “I am comfortable helping clients identify the kinds of things that upset them.” Individual responses to each of the questions in this scale can be found in Appendix B: Detailed Question Responses by Scale. Lower scores on this scale indicate staff members feel staff knowledge and competency practices are an area of growth at their workplace, and higher scores indicate staff members feel staff knowledge and competency practices are an area of strength.
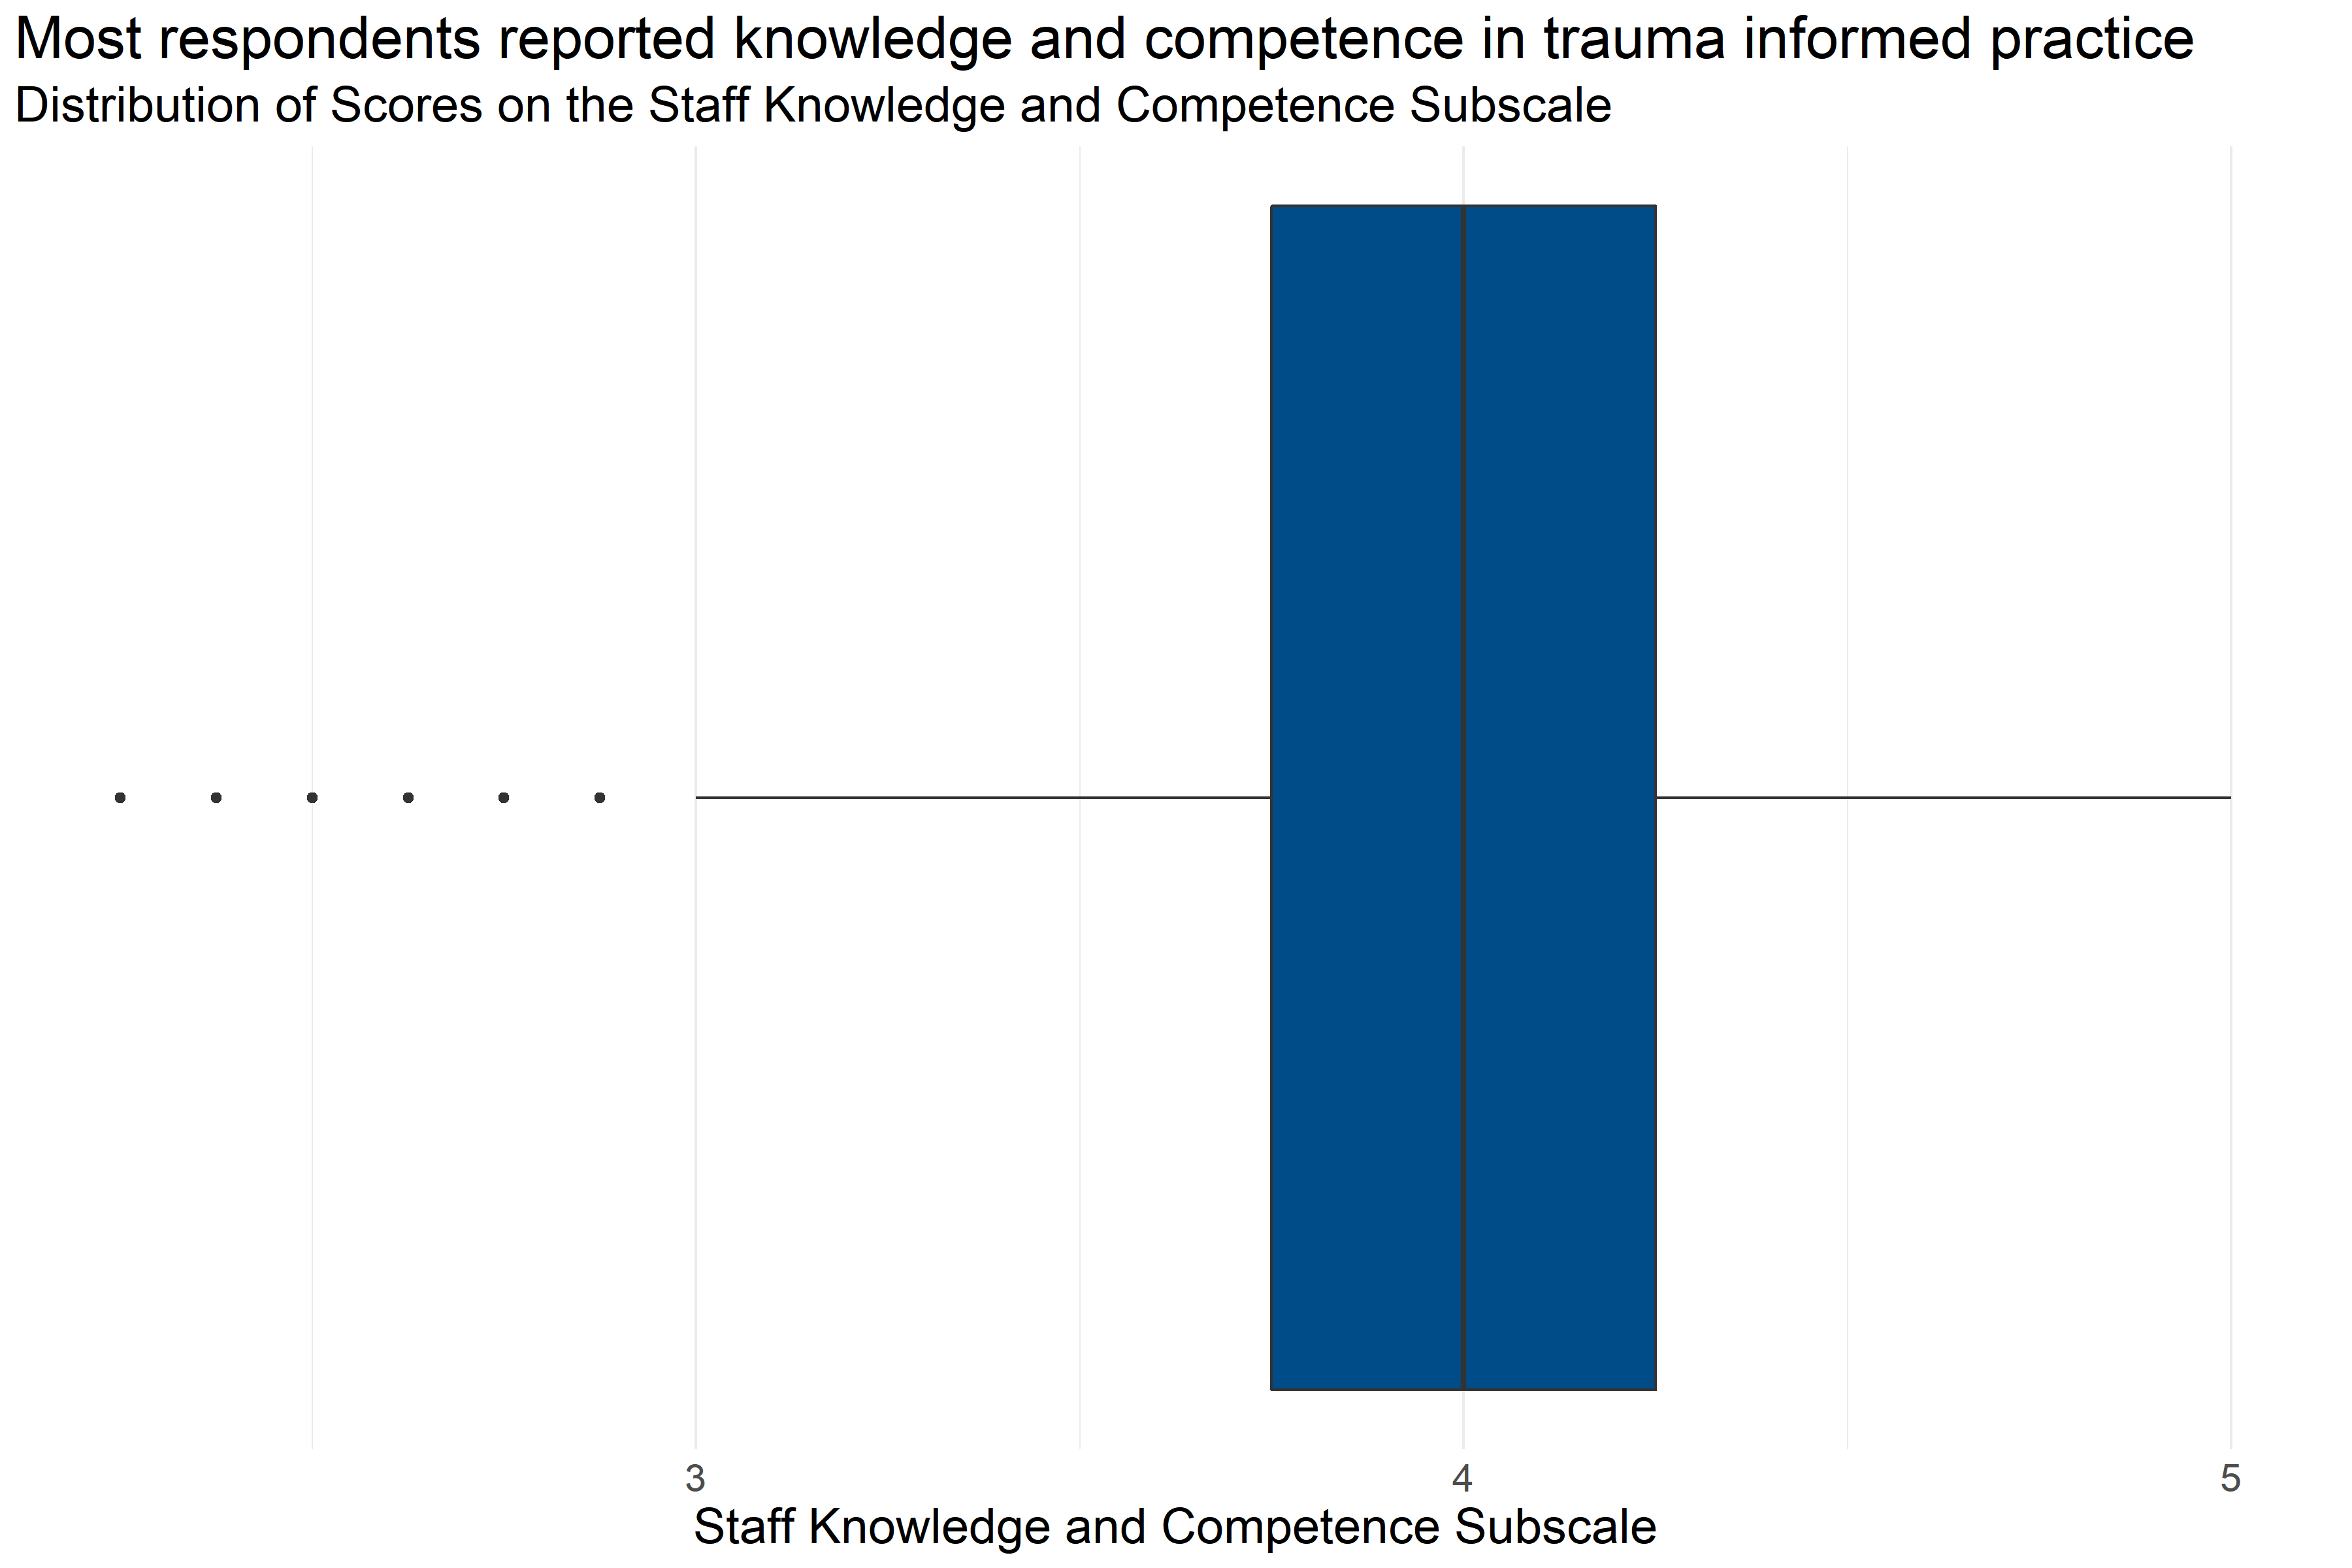
Figure 4.50: Boxplot of score distributions for Staff Knowledge and Competence Subscale
| Number of Answers | Average Score | Lowest Score | First Quartile | Median | Third Quartile | Highest Score |
|---|---|---|---|---|---|---|
| 205 | 3.99 | 2.25 | 3.75 | 4 | 4.25 | 5 |
Figure 4.50 and Table 4.38 provide information about how respondents scored on the Staff Knowledge and Competence Subscale. They provide the following information:
- Response: 205 respondents answered all questions in the scale.
- Average: The average score was 2.25.
- Range: Scores ranged from 3.99 to 5.
- Median: About half of respondents scored below 4 and half scored above 4.
- Interquartile Range: If the range of responses were cut into quarters, the middle half of respondents (between the first and third quartiles) scored between 3.75 and 4.25.
This means that more than half of respondents generally answered that they agreed or strongly agreed with statements about their staff knowledge and competence while on the job that were consistent with a Trauma Informed Model.
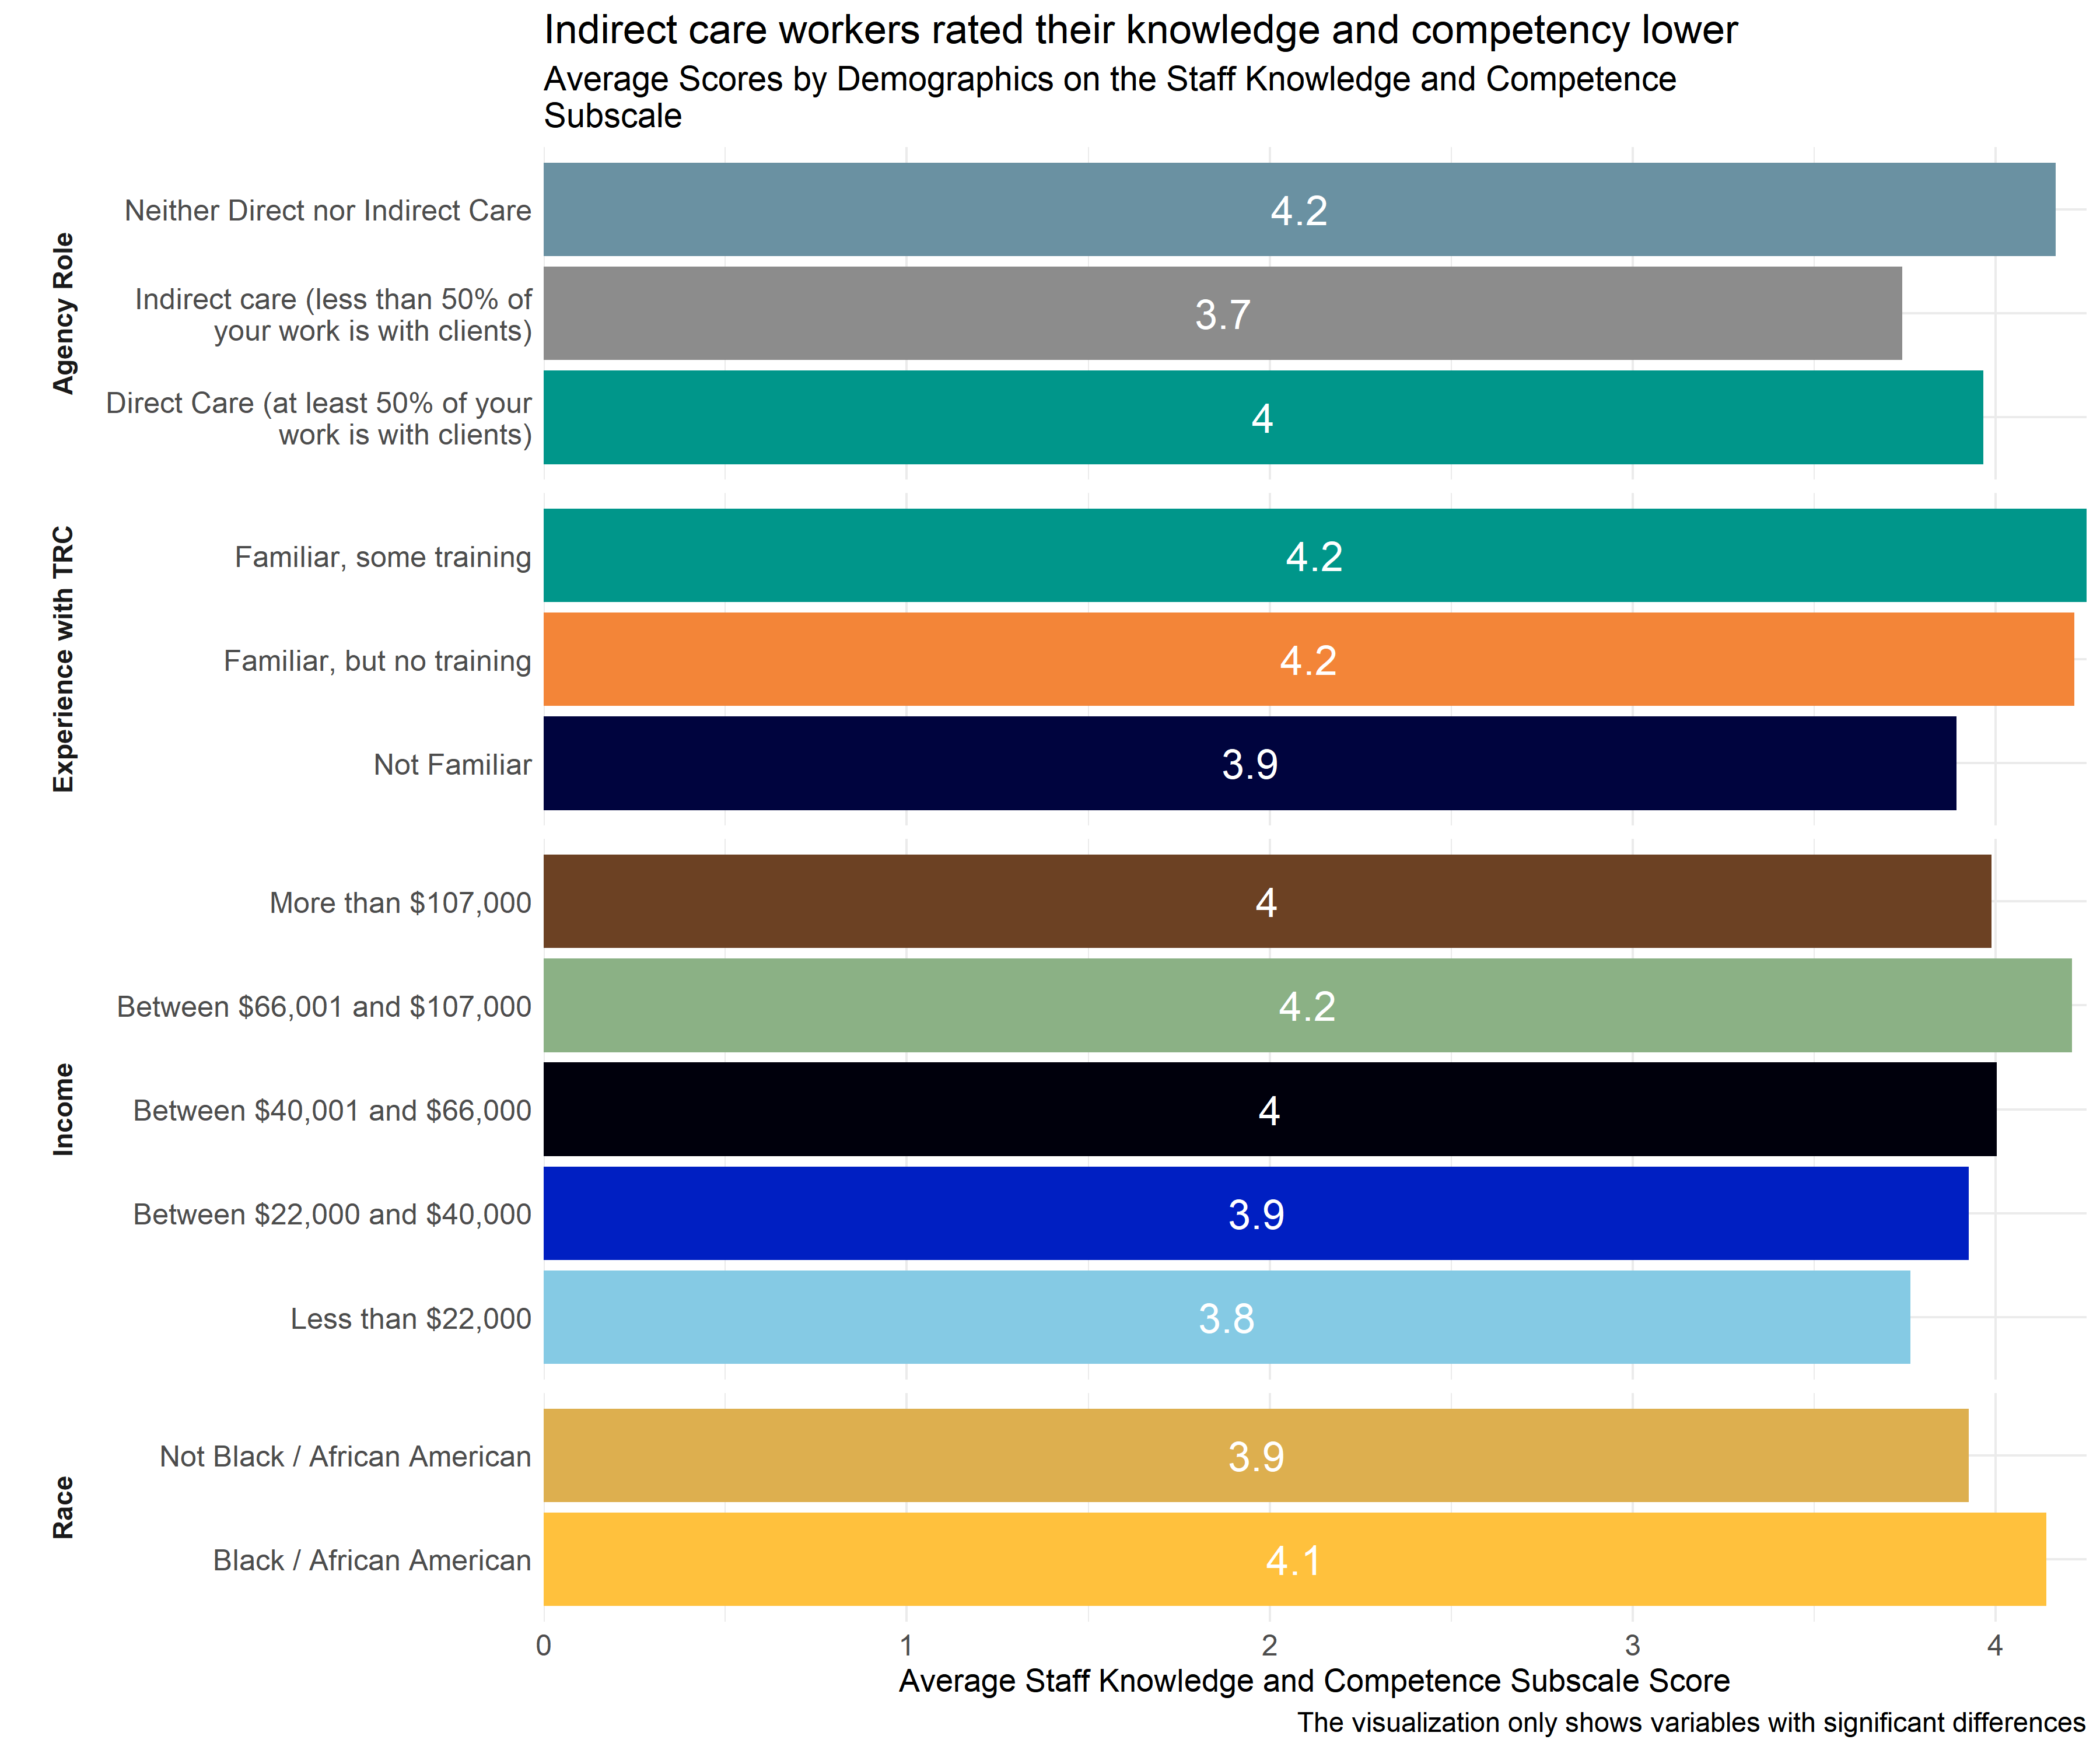
Figure 4.51: Average scores for Staff Knowledge and Competence Subscale across demographic groups
Analysts tested the average scores on the Staff Knowledge and Competence Subscale across demographic groups to identify differences in how respondents answered questions about their knowledge and competency. As Figure 4.51 shows, those working in indirect care roles scored lower on indicators of staff knowledge and competency practices than staff in other roles did. Staff who were not familiar with the TRC model had lower scores than those who were familiar with the TRC model, even if they had not attended any training. Staff earning less than $22,000 a year reported less knowledge and competency than those earning $66,001-$1,700. And, staff identifying as Black / African American scored higher than those not identifying as Black / African American.
Analysts also observed significant differences in ratings between respondents from specific agencies, but those scores are not shown in Figure 4.51 above to protect the privacy of those agencies.
4.5.5.6 Staff Attitudes
The Staff Attitudes Subscale measures staff attitudes in regard to trauma-informed practice such as perceptions about the likelihood of success for clients to succeed in treatment, the origins of problematic behaviors in clients, and how staff members perceive that co-workers view clients. Additionally, it looks at how they view their role in encouraging change in clients; identifying client’s strengths; and educating clients about the intersection between trauma, substance abuse, and mental illness. Respondents answered on a five point scale with options ranging from 1 “Strongly disagree” to 5 “Strongly agree” to statements like “I can identify the strengths in each of my clients.” and “I believe that many problematic behaviors were developed as strategies for coping with difficult experiences.” Individual responses to each of the questions in this scale can be found in Appendix B: Detailed Question Responses by Scale. Lower scores on this scale indicate staff members feel staff attitudes are an area of growth at their workplace, and higher scores indicate staff members feel staff attitudes are an area of strength.
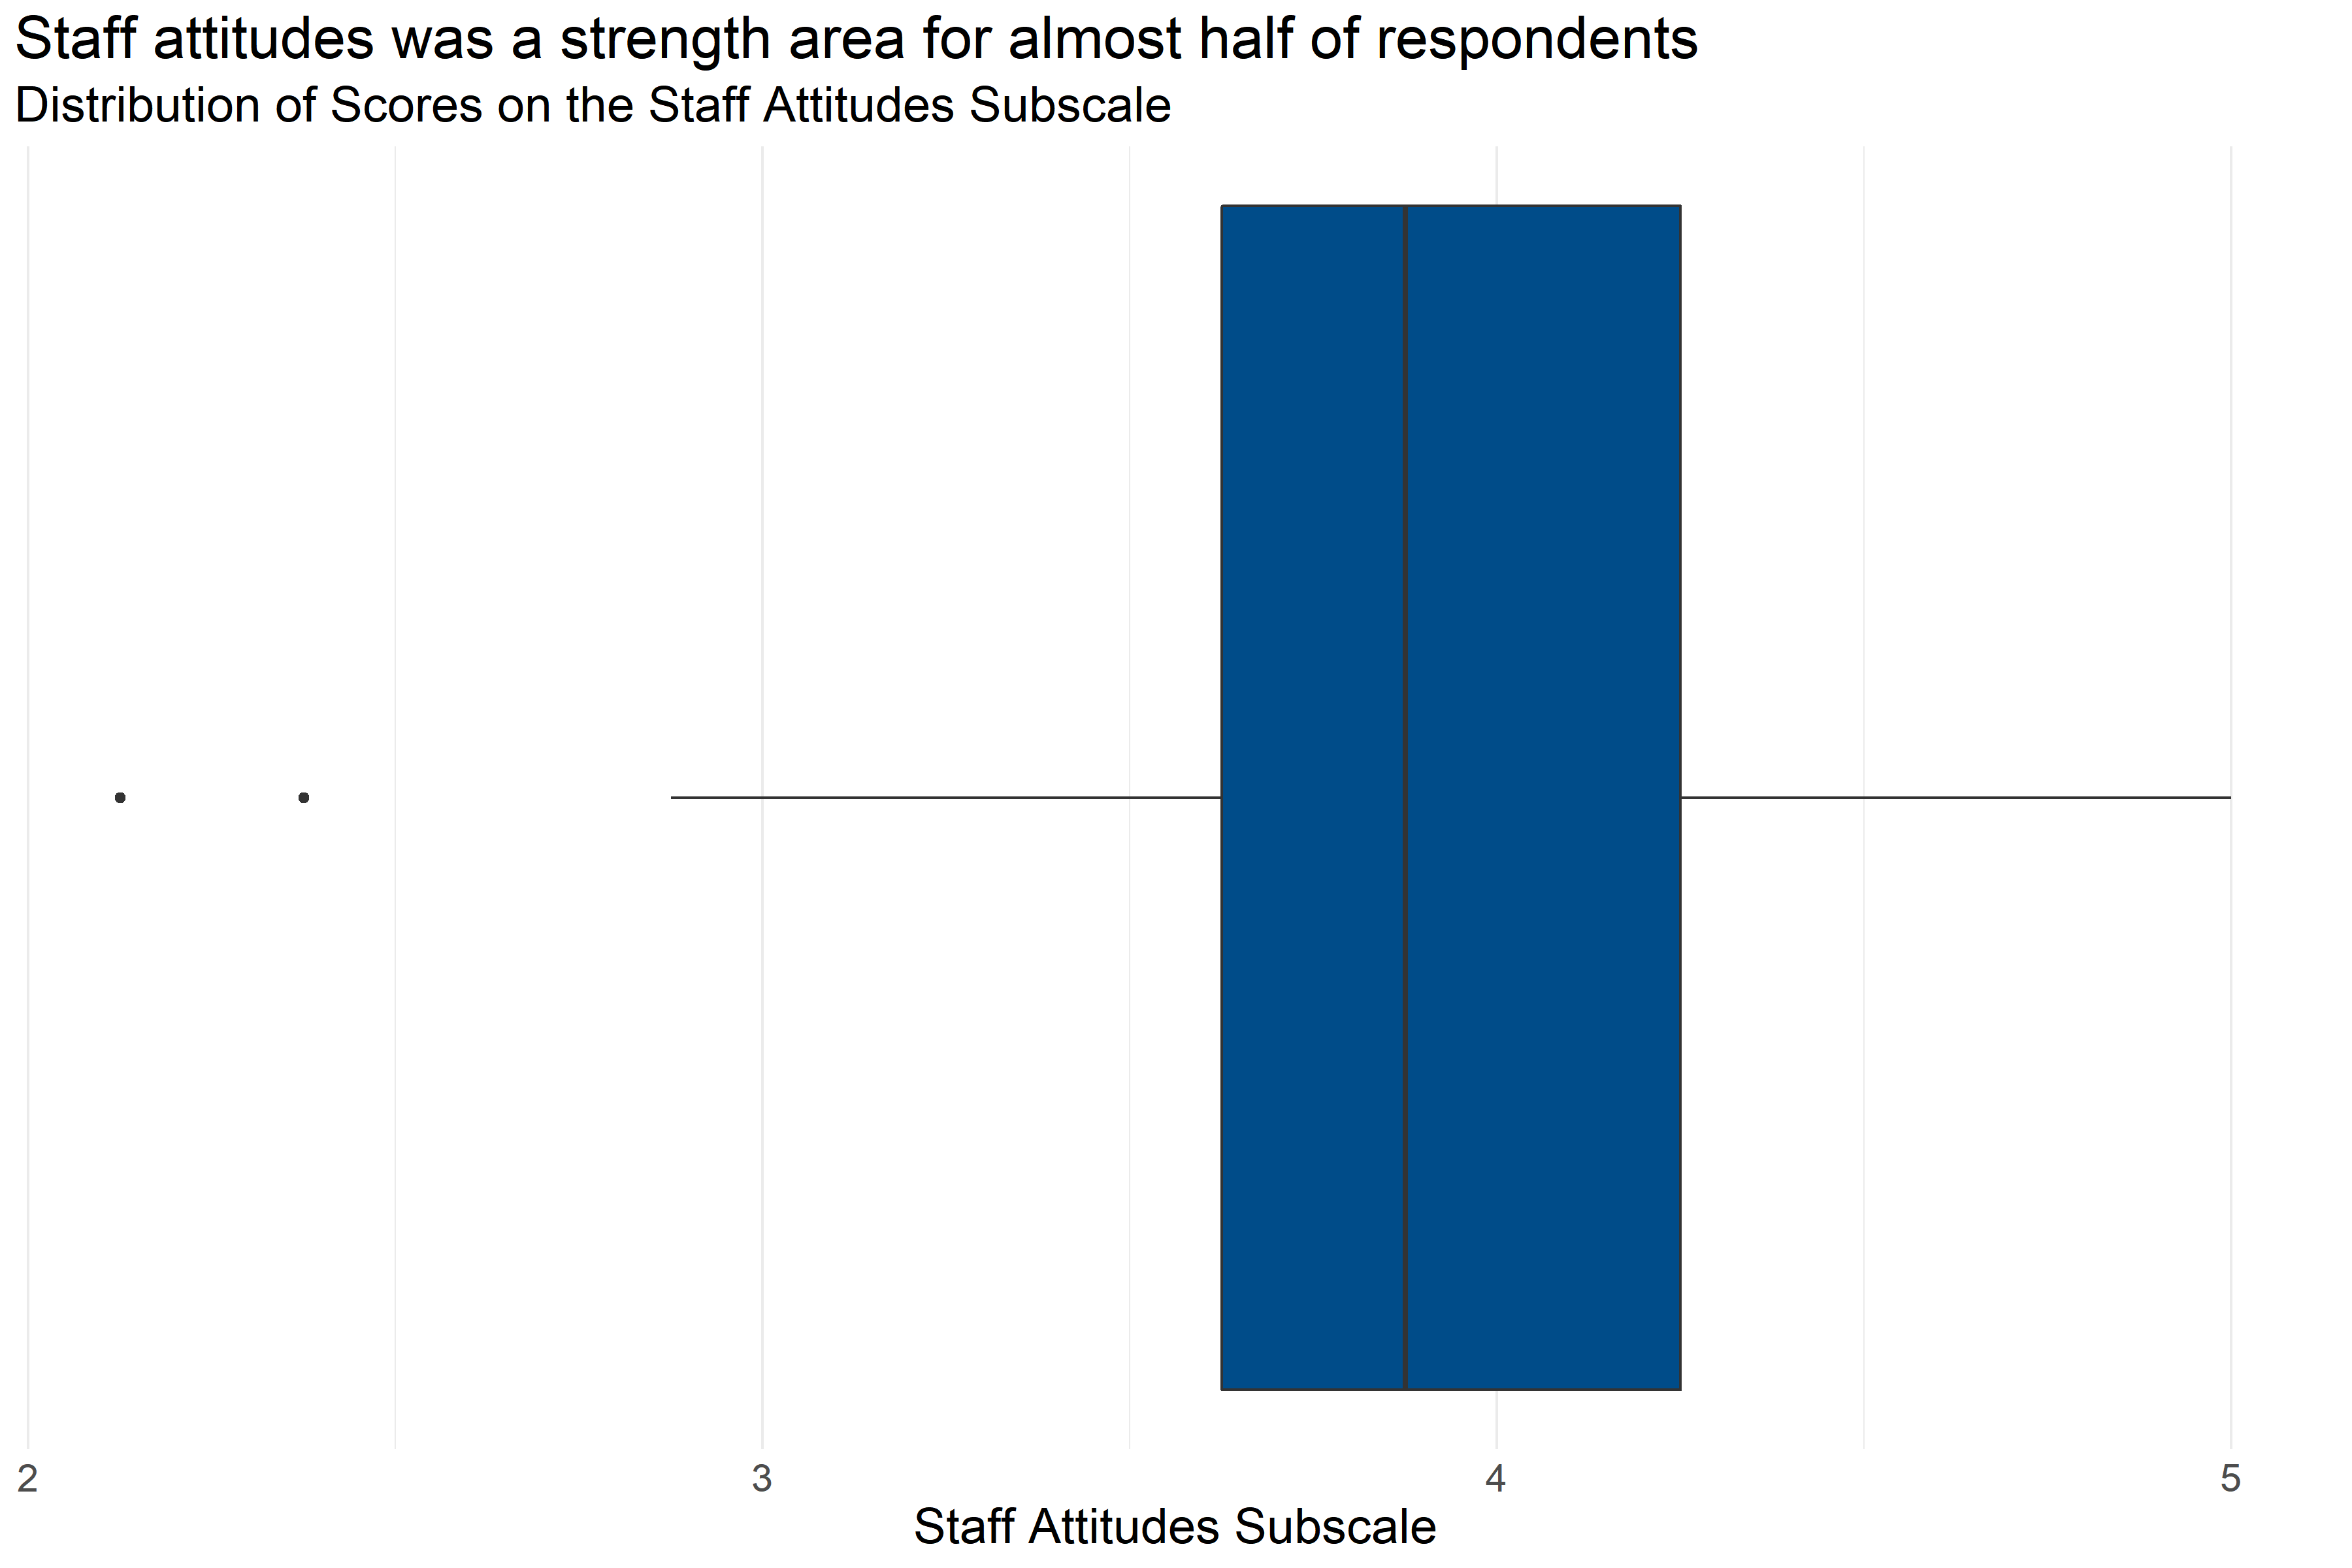
Figure 4.52: Boxplot of score distributions for Staff Attitudes Subscale
| Number of Answers | Average Score | Lowest Score | First Quartile | Median | Third Quartile | Highest Score |
|---|---|---|---|---|---|---|
| 174 | 3.91 | 2.12 | 3.62 | 3.88 | 4.25 | 5 |
Figure 4.52 and Table 4.39 provide information about how respondents scored on the Staff Attitudes Subscale. They provide the following information:
- Response: 174 respondents answered all questions in the scale.
- Average: The average score was 2.12.
- Range: Scores ranged from 3.91 to 5.
- Median: About half of respondents scored below 3.88 and half scored above 3.88.
- Interquartile Range: If the range of responses were cut into quarters, the middle half of respondents (between the first and third quartiles) scored between 3.62 and 4.25.
This means that slightly less than half of respondents generally answered that they agreed or strongly agreed with statements about their staff attitudes while on the job that were consistent with a Trauma Informed Model.
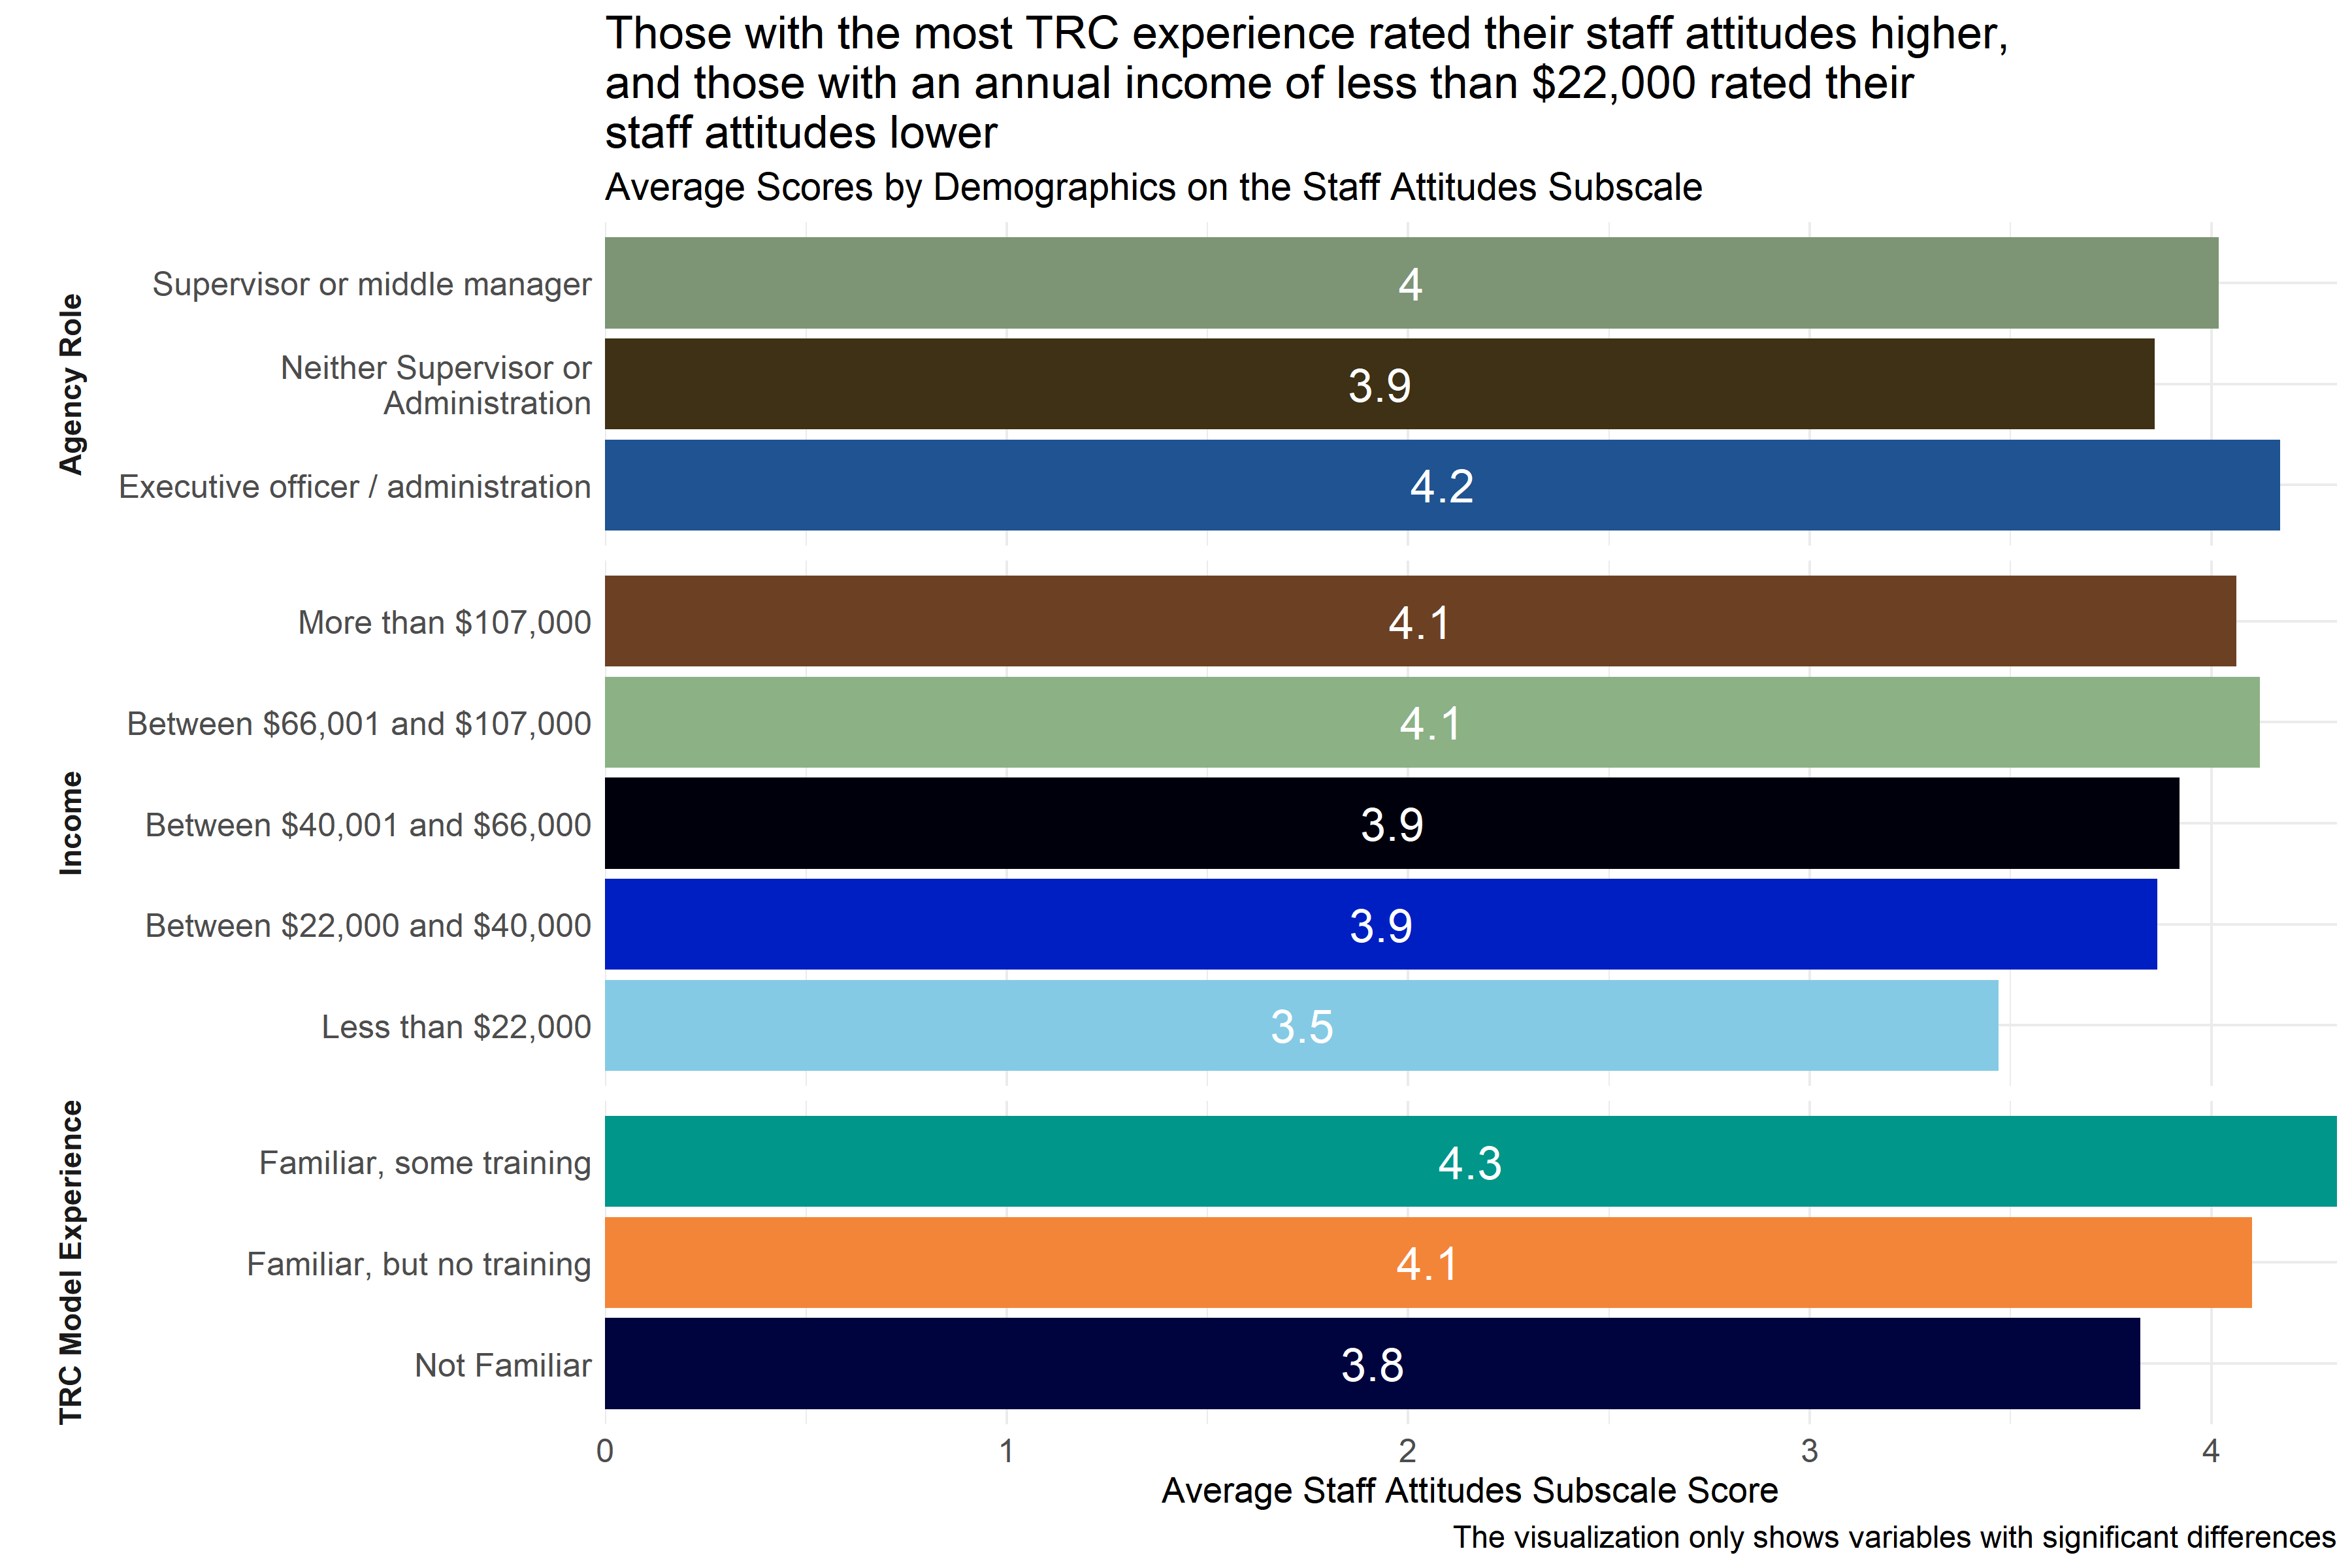
Figure 4.53: Average scores for Staff Attitudes Subscale across demographic groups
Analysts tested the average scores on the Staff Attitudes Subscale across demographic groups to identify differences in how respondents answered questions about staff attitudes. As Figure 4.53 shows, there were differences in responses from those with TRC experience, annual income, and agency role. Respondents who identified themselves as “I am familiar with the TRC Model and have not attended any presentations or participated in any training activities” scored their workplaces higher on indicators of staff attitudes than staff in other roles did. However, respondents whose annual income is less than $22,000 scored lower on indicators of staff attitudes than staff in other roles did. Similarly, respondents who identified as executive officers, administrators, supervisors, or middle managers scored higher than those who did not.
Analysts also observed significant differences in ratings between respondents from specific agencies, but those scores are not shown in Figure 4.53 above to protect the privacy of those agencies.
4.5.5.7 Trauma-Informed Practice with Clients
The Trauma-Informed Practice Subscale measures aspects of staff trauma-informed practice with clients such as whether staff engage in practices including: helping clients develop calming strategies, evaluate the safety of their choices, identify triggers, understand the connection between behaviors, etc. The scale also measures staff member perceptions of how they understand their own triggers and calming strategies, and other aspects of client practice such as whether staff members perceive that they lecture clients, tell them what to do, or whether they try to avoid arguing with clients. Respondents answered on a five point scale with options ranging from 1 “Strongly disagree” to 5 “Strongly agree” to statements like “I often point out or remind clients of their accomplishments and strengths.” and “I try to help clients evaluate the safety of different choices.” Individual responses to each of the questions in this scale can be found in Appendix B: Detailed Question Responses by Scale. Lower scores on this scale indicate staff members feel trauma-informed practices are an area of growth at their workplace, and higher scores indicate staff members feel trauma-informed practices are an area of strength.
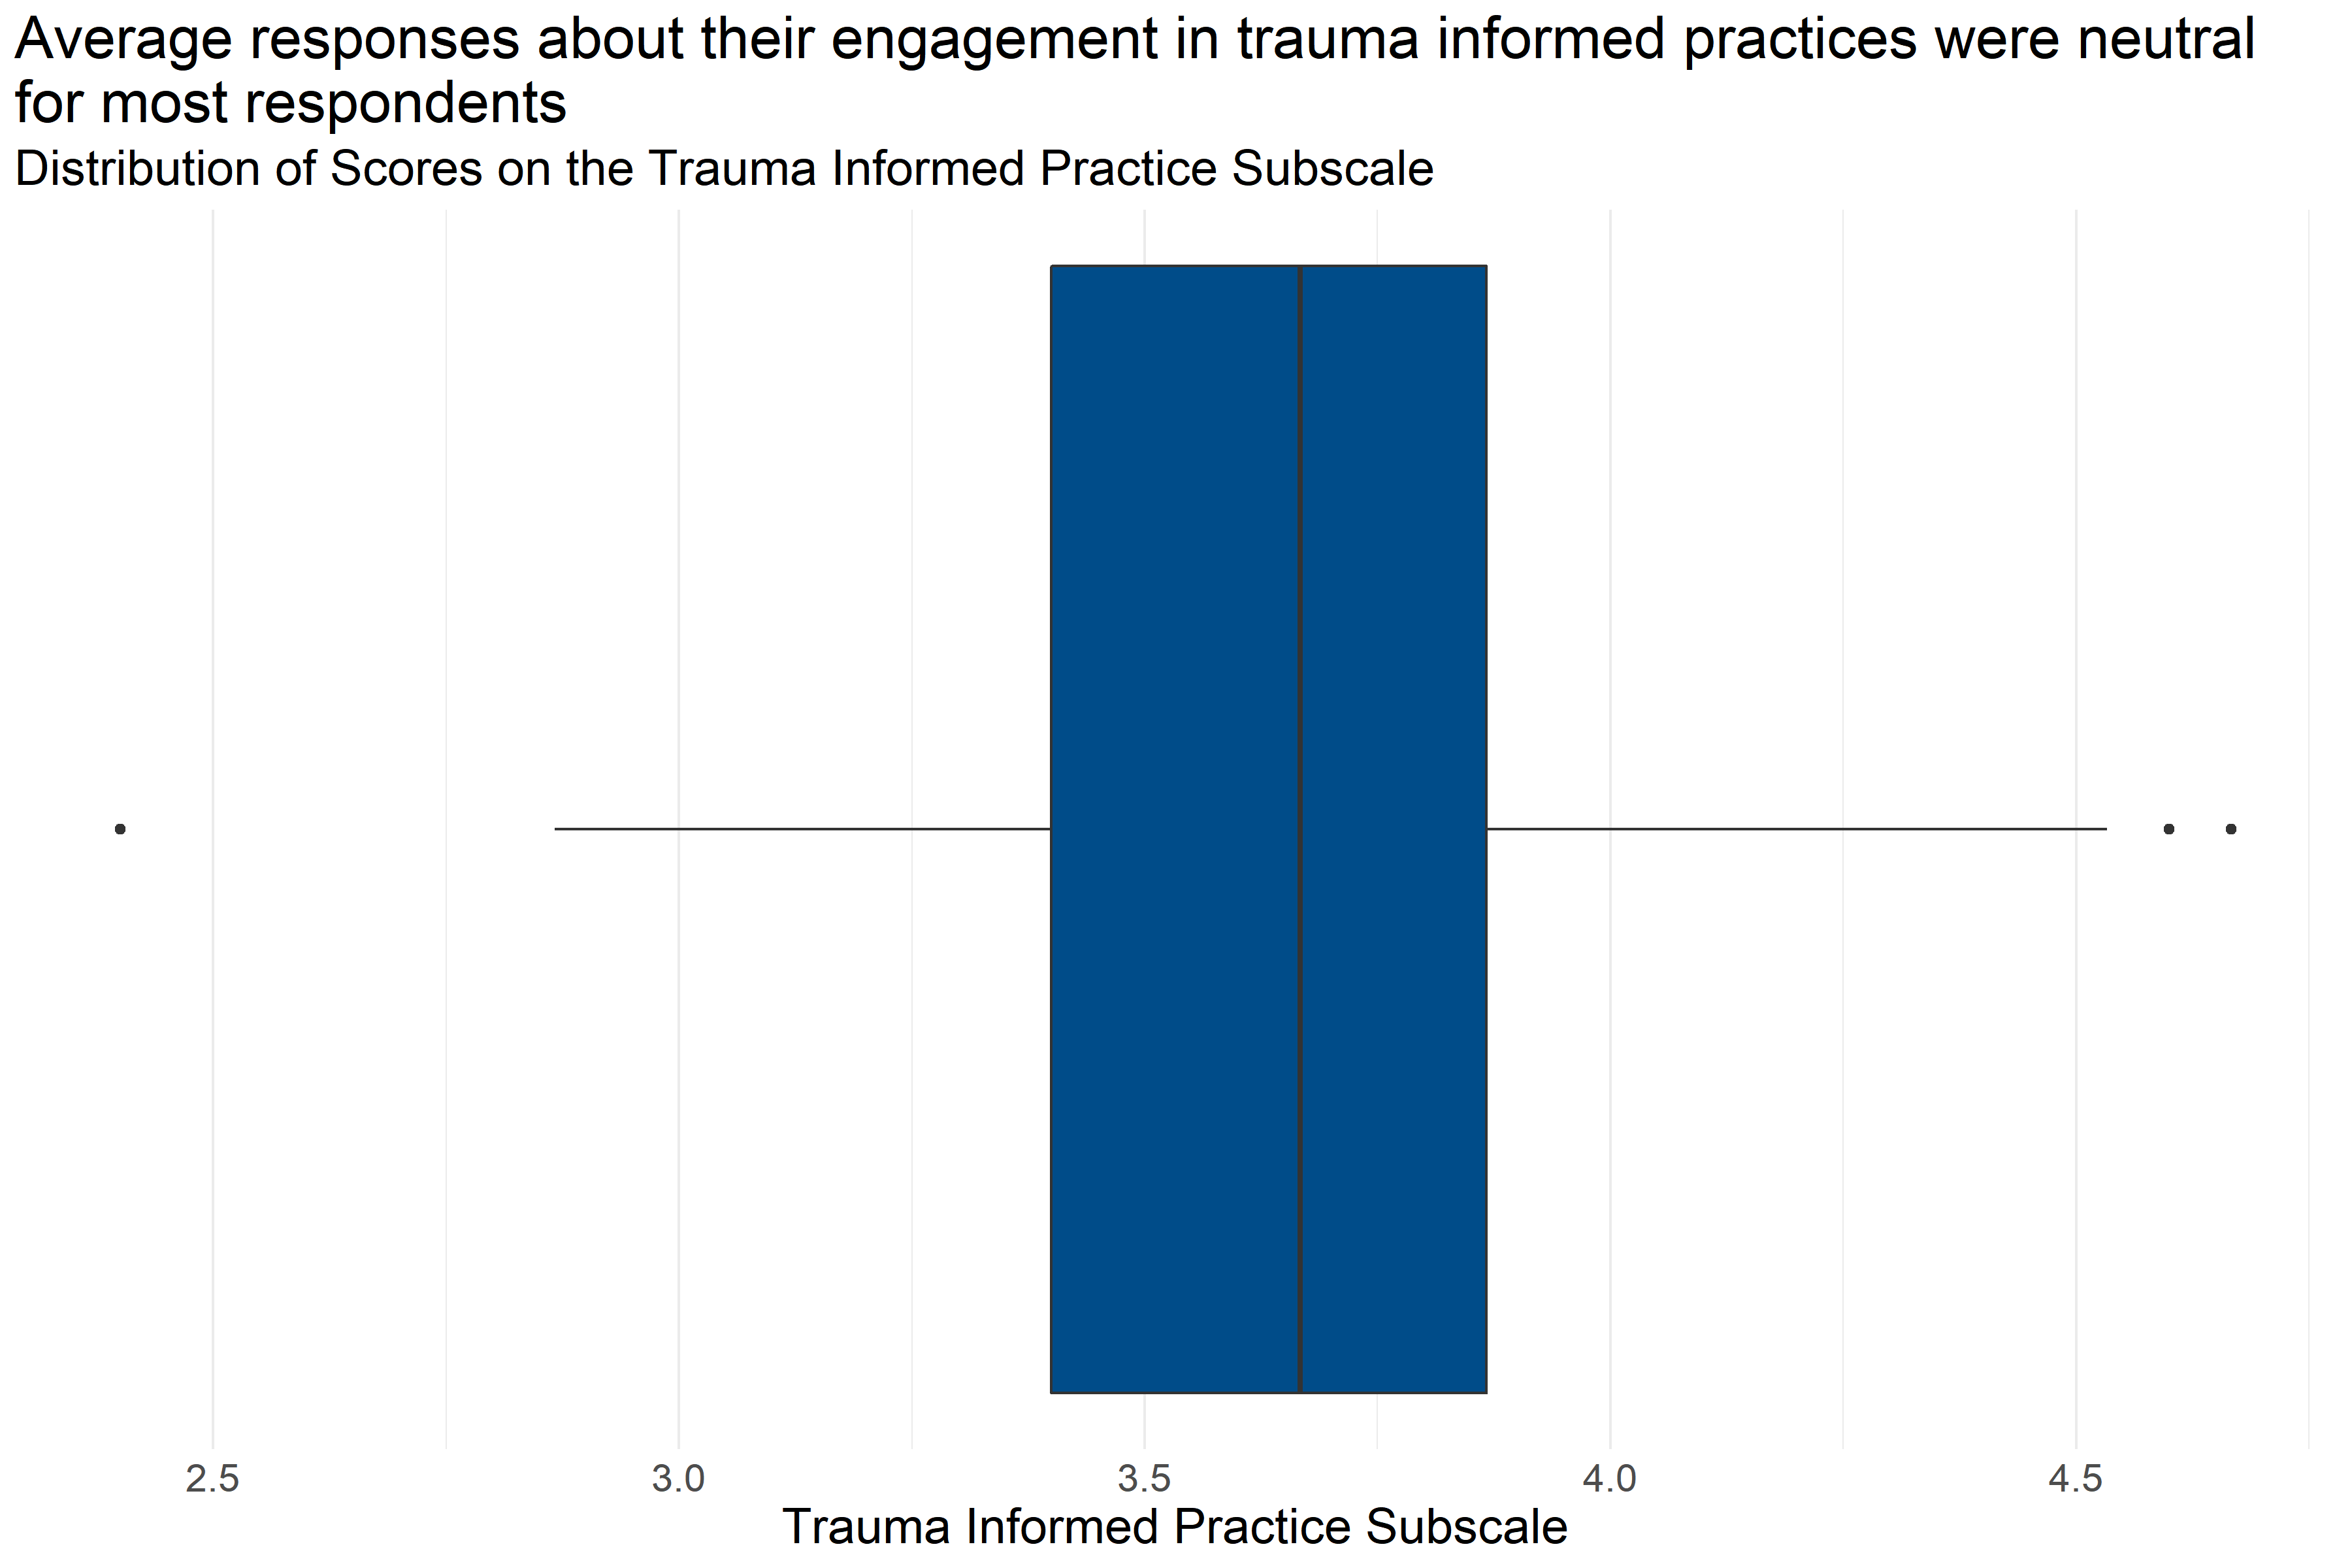
Figure 4.54: Boxplot of score distributions for Trauma Informed Practice Subscale
| Number of Answers | Average Score | Lowest Score | First Quartile | Median | Third Quartile | Highest Score |
|---|---|---|---|---|---|---|
| 175 | 3.67 | 2.4 | 3.4 | 3.67 | 3.87 | 4.67 |
Figure 4.54 and Table 4.40 provide information about how respondents scored on the Trauma Informed Practice Subscale. They provide the following information:
- Response: 175 respondents answered all questions in the scale.
- Average: The average score was 2.4.
- Range: Scores ranged from 3.67 to 4.67.
- Median: About half of respondents scored below 3.67 and half scored above 3.67.
- Interquartile Range: If the range of responses were cut into quarters, the middle half of respondents (between the first and third quartiles) scored between 3.4 and 3.87.
This means that slightly more than half of respondents generally answered that they neither disagreed nor agreed or agreed with statements about their trauma-informed practices while on the job that were consistent with a Trauma Informed Model.
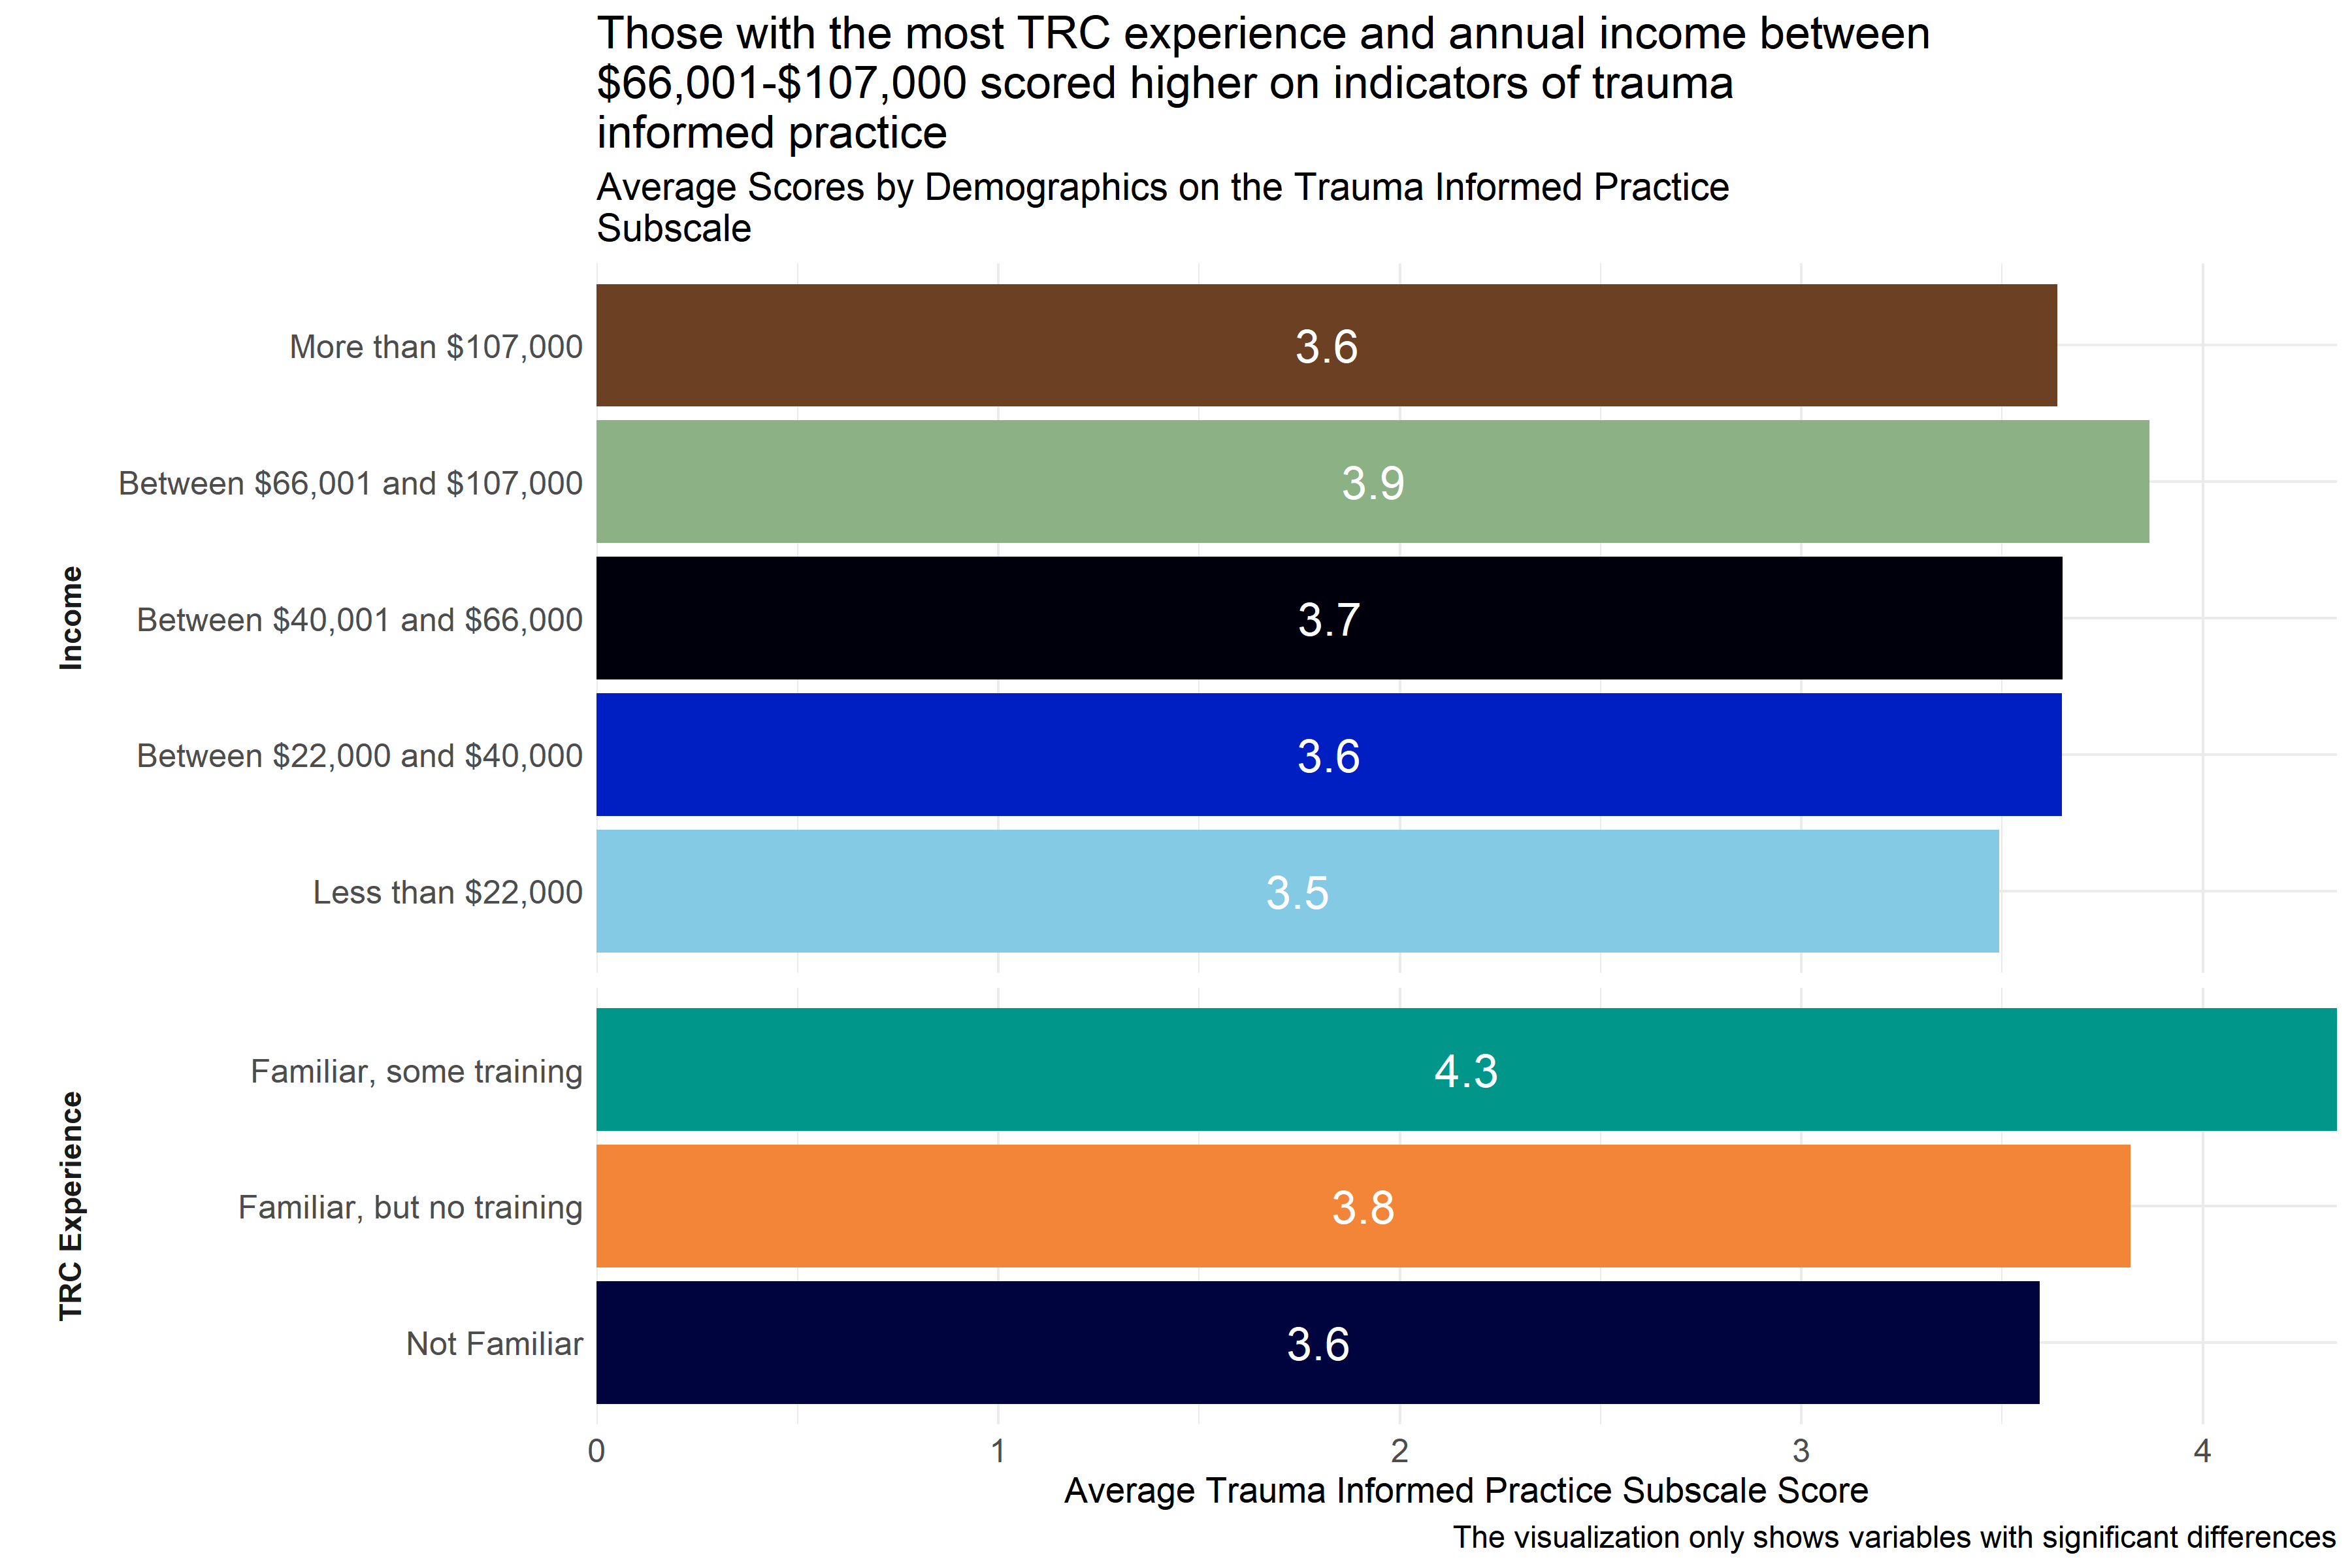
Figure 4.55: Average scores for Trauma-Informed Practice Subscale across demographic groups
Analysts tested the average scores on the Trauma-Informed Practice Subscale across demographic groups to identify differences in how respondents answered questions about trauma-informed practices. As Figure 4.55 shows, there were differences in responses from those with different TRC experience and annual income. Respondents who identified themselves as “I am in the process of participating in the TRC staff training modules” and those whose annual income is between $66,001-$107,000 scored higher on indicators of trauma-informed practices than staff with incomes below $22,000 and those with lower levels of exposure to the TRC model did.
Analysts also observed significant differences in ratings between respondents from specific agencies, but those scores are not shown in Figure 4.55 above to protect the privacy of those agencies.
4.5.5.8 Conclusion
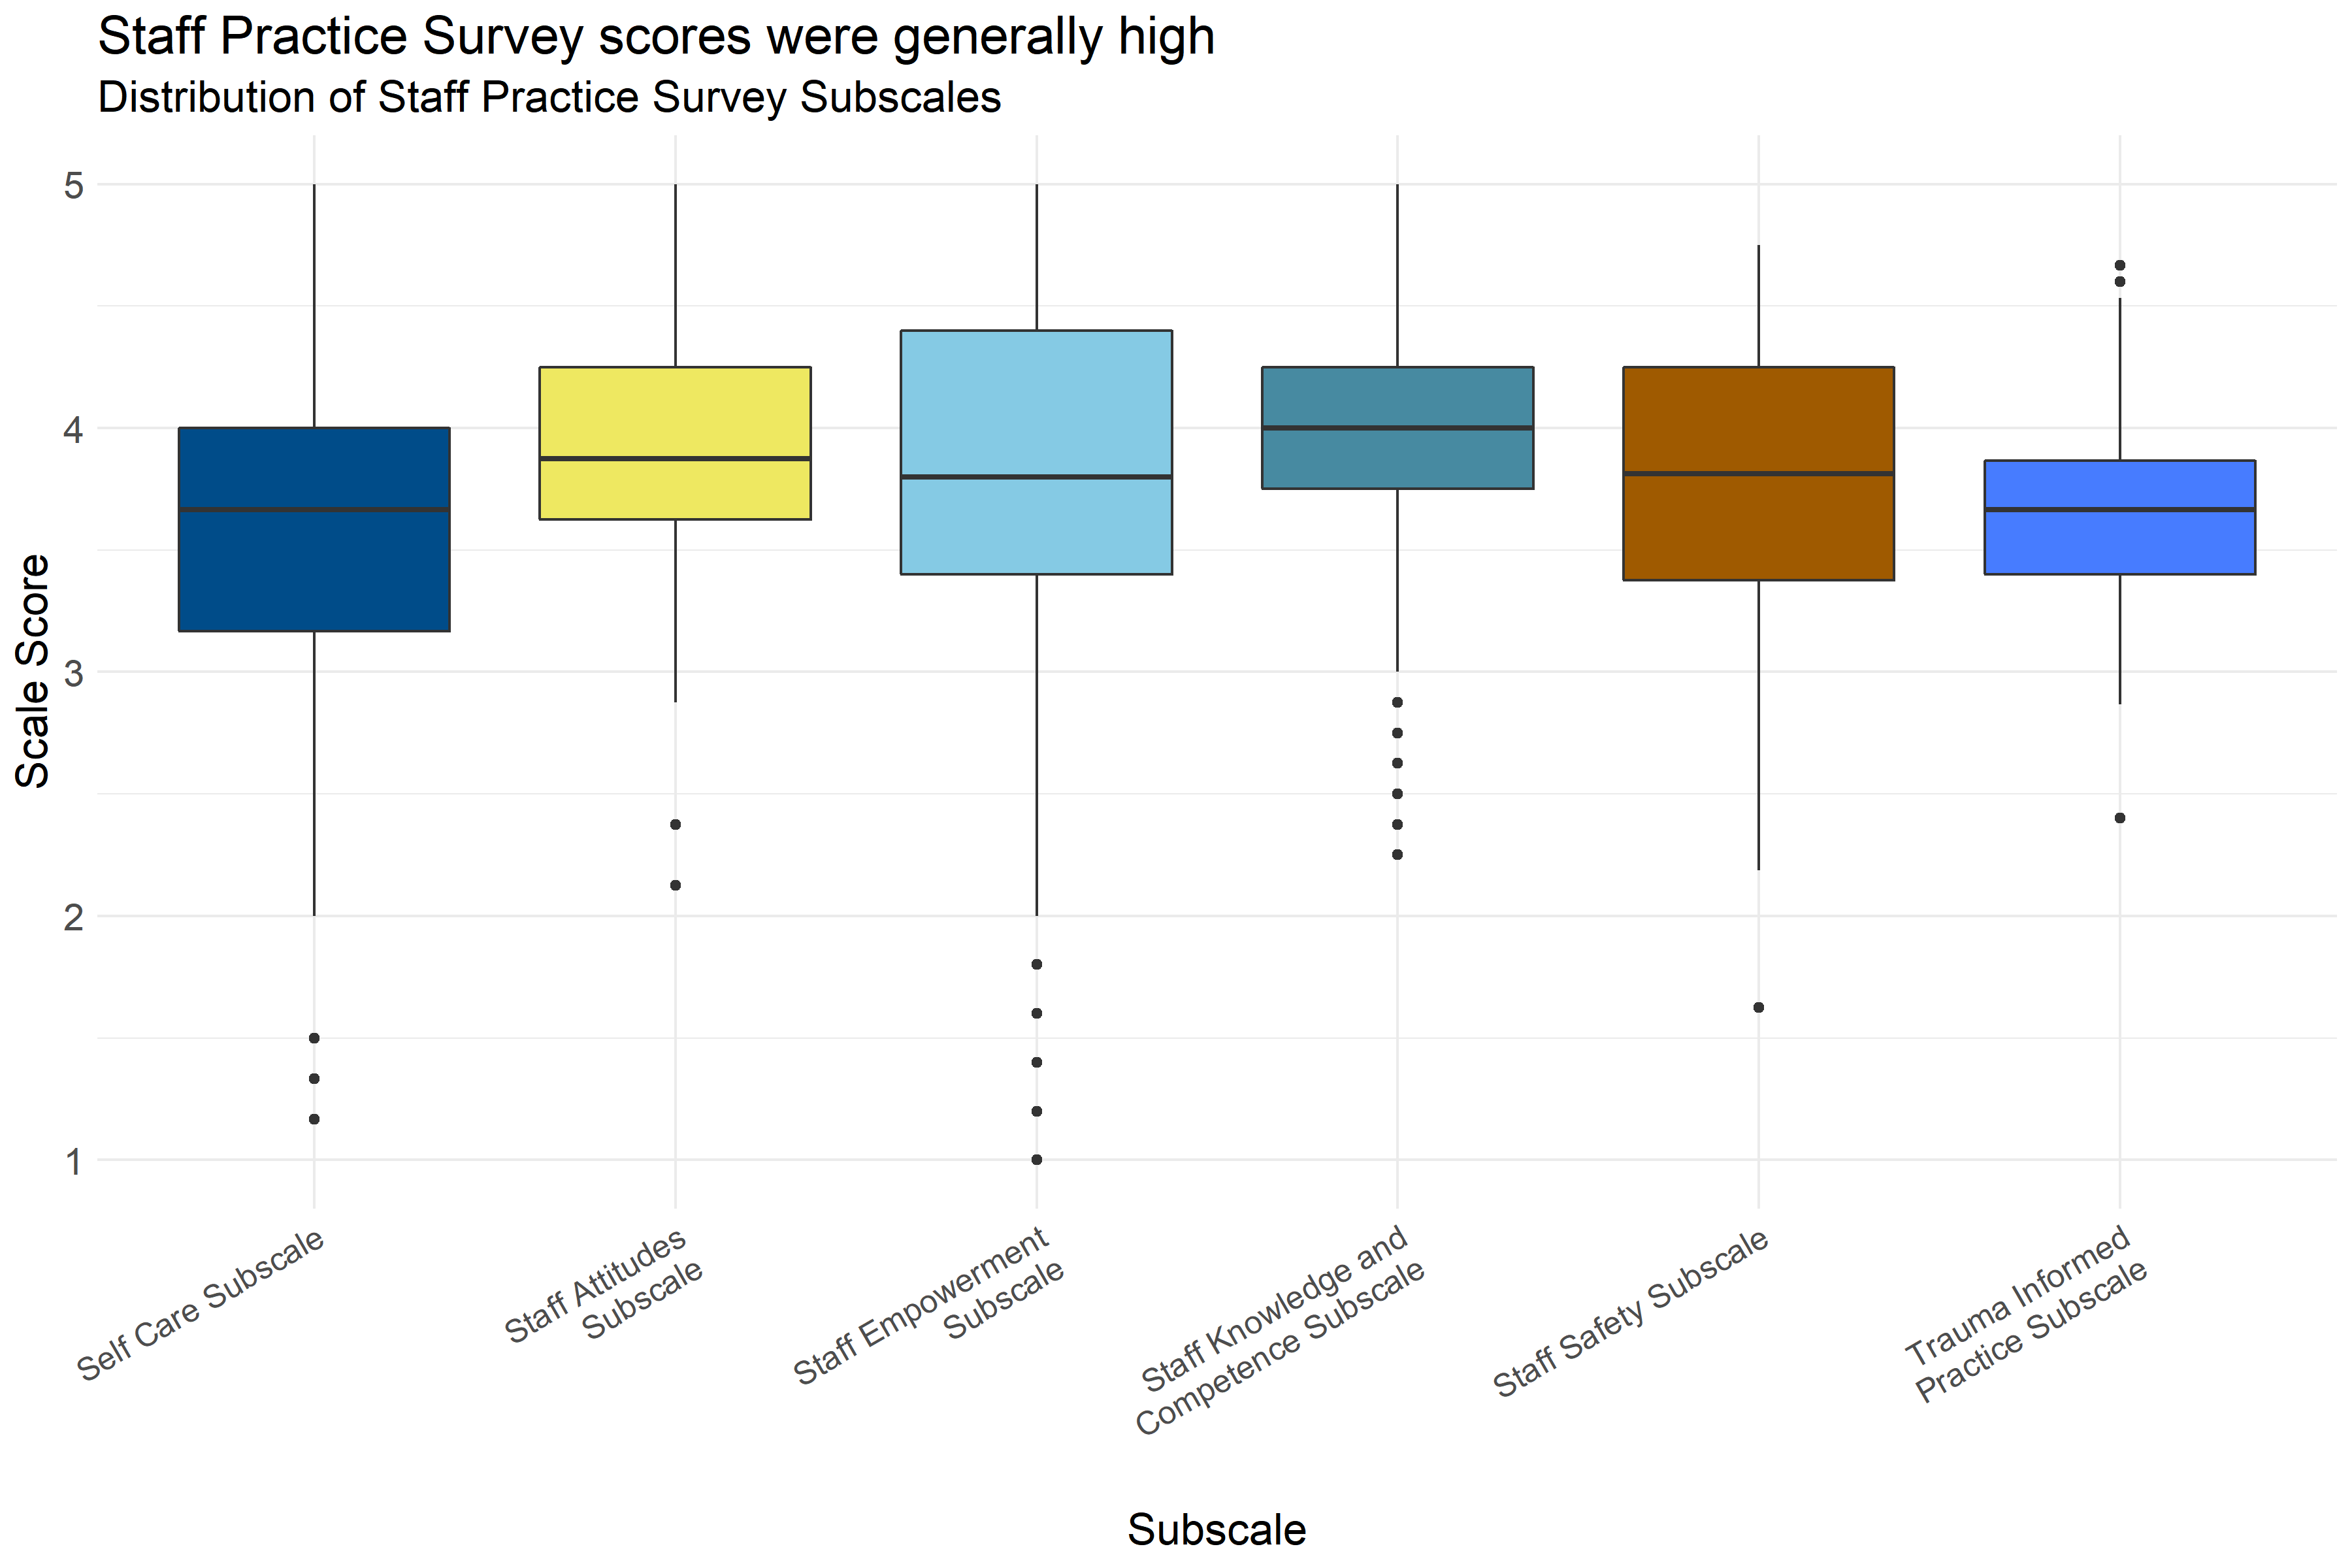
Figure 4.56: Boxplot of score distributions on the Staff Practice Survey Subscales
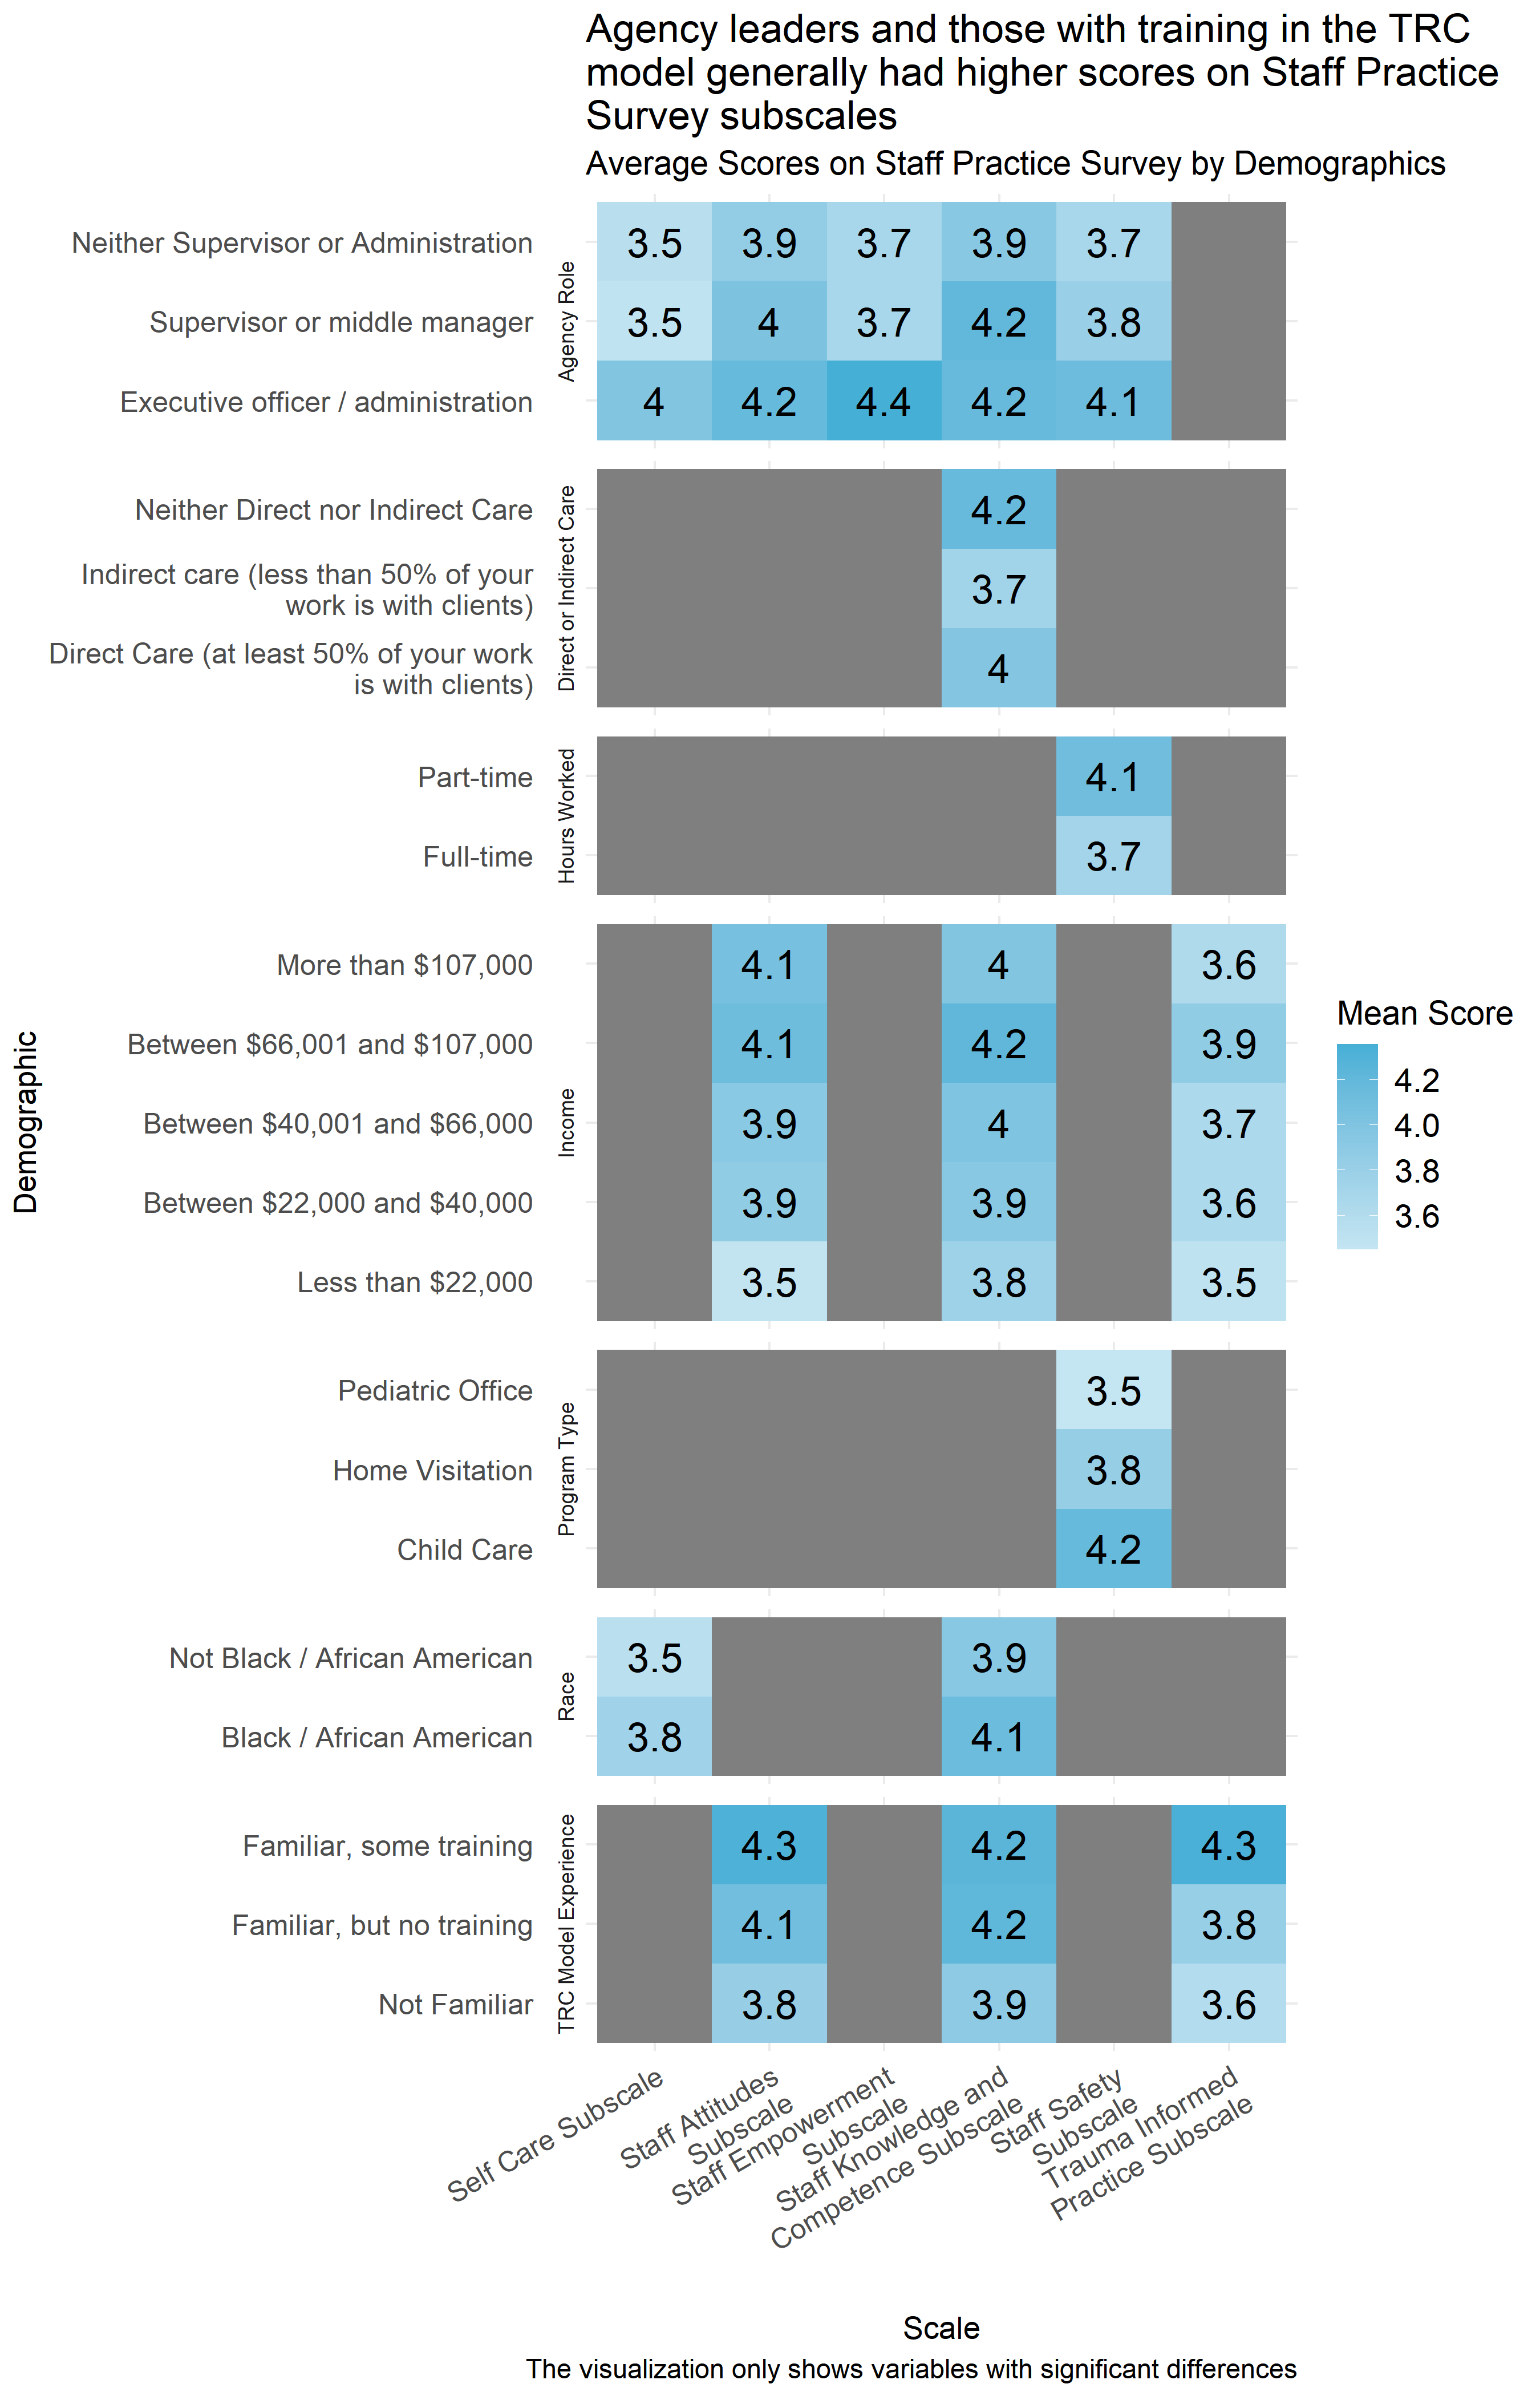
Figure 4.57: Mean score on Staff Practice Survey by demographic
Figure 4.56 shows the distribution of scores on the Staff Practice Survey subscales. The colored boxes represent the range that the scores of the middle half of respondents fell into. (If you were to cut all of the scores into quarters, this would be between the first and third quartiles.) The lines and dots represent the full distribution of scores on each scale. Scales with dots on either side indicate unusually high or low scores. Scores on the staff practice survey were generally between neutral and moderately high, with the Staff Knowledge and Competence Subscale being notably higher. Across most of the subscales, respondents’ answers were generally neutral or in agreement with statements that would indicate staff practice alignment with a Trauma Informed Model. However, on the Self Care, Staff Empowerment, and Staff Safety subscales especially there was more variation in responses, with a minority of respondents giving more disagreeing statements in general.
Figure 4.57 shows that scores on the Staff Practice Survey subscales were generally higher for those earning between $66,001 and $107,000 a year and those who were familiar with the TRC model. In addition, the agency role demographic was the most consistently associated with differences in responses, with significant differences in all of the subscales except for the Trauma Informed Practice Subscale. In many cases, analysts observed statistically significant differences across specific agencies, but those scores are not included in Figure 4.57 to protect the privacy of respondents and the agencies where they work.
It is also noteworthy that having spent more years in the field was associated with a slightly higher score on the Staff Safety, Staff Empowerment and Self Care subscales.
4.5.5.8.1 Important Considerations
These demographic breakdowns only compare scores by demographics considering one demographic at a time. In cases where these demographics may be interrelated, (e.g., executive officers and administrators also having more training than other staff) it is not possible to know from this analysis what those differences would look like if those relationships were controlled for (e.g., looking at agency role while controlling for training). It is possible that some of these differences in scores are actually the result of other demographic differences, even differences not measured in this analysis.
Additionally, this data is based on a survey that respondents volunteered to take across a variety of fields. There could be ways that the people who volunteered to take the survey are different from other people who work in child-serving agencies. Furthermore, because smaller differences between groups are easier to see with a higher number of survey responses, it is possible that there are other differences that exist across demographics that analysts would be able to measure with a larger group of respondents.
4.5.5.8.2 Implications
While scores were generally high, there was more variation on some scales than others, and it is possible that some of this variation comes from differences across agencies. Individual agency scores on Staff Safety, Staff Empowerment and Self Care subscales may be particularly helpful for implementing a Trauma Informed Model in Forsyth County. Higher scores from recipients who have received TRC training suggests that training may improve staff practice scale scores. It will also be important for planners to note that the experiences and perspectives of organizational leaders may differ from those of other staff members.
4.5.6 Racial Justice and Structural Violence
4.5.6.1 Key Findings
- Some organizations prioritize diversity of staff over diversity of leadership in order to match the populations they serve. In such cases, there is less diversity higher up in an organization’s hierarchy, which reflects a lack of an employee pipeline within the organization for people of color.
- Respondents indicated there is greater urgency for racial equity-based work within the last few years, suggesting that organizations and staff are responsive to the socio-political landscape (e.g., COVID-19, George Floyd protests, etc). Further, a plurality of respondents identified that engaging in more racial equity-based work is an area of growth in their organization. There were more instances reported of organizations lacking equity-based policies and practices than having such measures in place.
- Some organizations have sufficient resources to engage in racial equity-based practices and policies, while others face barriers such as leadership, funding, and/or staff buy-in.
- Respondents report that, in general, their organization’s culture is inclusive and supportive of people from diverse backgrounds, however several respondents indicated that there is an expectation for people of color to assimilate into a dominant white norm culture.
- Many organizations have internal goals and benchmarks, some related to racial equity and some not. In some cases these are related to meeting requirements for funding by state and/or other funders.
- The COVID-19 pandemic not only affected how community service providers served the community, but it also added extra personal and professional stressors and trauma.
- Many organizations serve members of the community who have experienced structural violence, which suggests there are many adverse experiences that the community encounters which can compound pre-existing trauma or lead to new forms of stress and trauma.
4.5.6.1.1 Diversity, POC Leadership, and Advancement
| Theme: Diversity, POC Leadership and Advancement | Respondents | Percent |
|---|---|---|
| Connection with diverse communities and/or community partners | 15 | 65% |
| Diverse Board of Directors (Board) | 10 | 44% |
| Diverse leadership in organization | 10 | 44% |
| Diverse staff | 15 | 65% |
| Diverse staff representation helps organization | 11 | 48% |
| Employment pipeline in organization | 5 | 22% |
| Intentionality around diversity in hiring practices | 14 | 61% |
| Lack of connection with diverse communities and/or community partners | 5 | 22% |
| Little to no diversity in Board | 2 | 9% |
| Little to no diversity in leadership | 5 | 22% |
| Little to no diversity in staff | 5 | 22% |
This section highlights themes related to diverse representation within organizations, connections with diverse communities, and leadership and advancement opportunities within human service organizations. There were consistently more respondents that indicated there was staff, leadership, and board diversity versus indicating a lack of diversity among these groups. A little less than half of respondents (44%) indicated there was leadership and board diversity in the organization, compared to 22% of respondents indicating there was little leadership diversity and 9% of respondents indicating there was little Board diversity.
Regarding staff diversity, about 65% of respondents indicated there was diverse staff and only about 22% of respondents indicated there was little staff diversity. Furthermore, about 48% of respondents felt that staff diversity benefited the organization particularly with outreach and servicing members of the community. For example, one respondent discussed harassment that a young woman experienced at their organization and said their sense was it happened before,
“but [they] didn’t trust us enough to start telling us, but we had an African-American female supervisor, and they came to her and told her.”
The participant reflected that this instance led the organization to be more alert to gender and racial discrimination in their organization. Participants also talked about how positive it is to have diverse staff representation in order to match the population they serve.
For instances in which respondents mentioned that there was little diversity there were some respondents who specifically said the mismatch was primarily with the Hispanic/Latino(a) population. Additionally, another challenge with diversity on boards that was noted was having more socio-economic status diversity. Some participants also reported difficulty in finding diverse candidates for jobs.
Regarding hiring and advancement, the majority of respondents indicated that there was intentionality around hiring practices to promote diversity, indicated by about 61% of respondents. However, only about 22% indicated that there was an employment pipeline within the organization to help people of color advance in the organization into leadership positions.
Finally, when asked about connections between their organization and diverse communities, a majority of respondents, about 65%, indicated that they had connections with diverse communities and/or community partners. In comparison, only about 22% commented on having a lack of connectivity with diverse communities and/or community organizations.
4.5.6.1.2 Equity Resources, Supports, and Position
| Theme: Equity Resources, Supports, and Position | Respondents | Percent |
|---|---|---|
| Adequate resources for equity-based work | 10 | 44% |
| Agnostic/neutral towards equity-based work | 14 | 61% |
| Applied or received grant support for equity-based work | 15 | 65% |
| Commitment to equity at surface level | 3 | 13% |
| Concern that racial equity work would jeopardize funding or relations | 3 | 13% |
| Lack of intentionality with equity-based work | 10 | 44% |
| Lack of resources for equity-based work | 9 | 39% |
| Leadership barriers within the organization | 7 | 30% |
| Organization or staff responsive to socio-political landscape | 14 | 61% |
| Recent emphasis on equity | 15 | 65% |
Interviewees discussed the various supports their organizations provide for racial equity-based work as well as some of the barriers with and concerns of racial-equity work within their organization. About 43% of respondents reported that their organization provides adequate resources for racial equity-based work. These resources include training and education for staff, programs or other client-related services, and employment resources. Around 17% of respondents specifically identified applying for or receiving a grant to help support racial equity-based work in their organization. Additionally, about 48% of respondents discussed how their organization provides space and time for staff to discuss and respond to various issues around racial equity within or outside of their organization. Many of these discussions occurred because organizations and/or staff were responsive to the sociopolitical landscape of the last year and, particularly, last summer. For example, one respondent said the following of these discussions:
“We do that regularly with training. I will also say since COVID started, we’ve been doing a weekly wellness meeting where sometimes it’s a fun topic and sometimes it’s a deep topic. Sometimes, we are also using that space to discuss some of those issues, particularly involving some of the more recent racial trauma that’s occurred.”
Some respondents specifically identified the George Floyd protests in the summer of 2020 as a reason conversations started or deepened and over half (65%) of respondents talked about how their organization has had a relatively recent emphasis on racial equity-based work or at least the formal and informal conversations at work.
While some of respondents indicated that their Board or leadership was engaged in racial equity-based work, a few more discussed how their organization has leadership barriers to racial equity-based work and a less engaged or unengaged board and/or leadership within their organization. One interviewee in particular discussed that while there are good suggestions that the “the red tape” of bureaucracy
“tie[s] our hands, and we’re not able to really do what we want or need to do efficiently, and effectively, and timely. It’s takes a long time…It takes way too long.”
A few participants noted the constraints of working for a government agency or organization with ties to the state and thus, operating under the apparatus of their guidelines and policies may hinder some of the racial equity-based work at their organization.
Lastly, around 60% of respondents also at some point during the interview expressed a notion that their organization or themselves were agnostic or indifferent towards equity-based work which was sometimes described as positive. For example, some people emphasized that the services provided by the organization to the people they serve are provided equally regardless of people’s race and ethnicity or other identities. Others discussed training or other staff support within the organization not targeted to any one racial or ethnic group, but equally available and supported to all employees.
Some other participants described this equity indifference with a negative connotation. One participant talked about how their organization has a training program specific to trauma-informed care that omits any discussion, as they said,
“[of] historical racial trauma as an important part of being trauma-informed.”
This signifies an indifference to a specific kind of trauma that people of color have historically experienced and, potentially, problems with identifying the trauma that people of color may still experience within the organization or the work that is carried out. It also points to another small but important theme found in some of the interviews — a concern that the commitment to racial equity is at a surface level. This includes the introduction of policies, benchmarks, or expectations of staff without accountability to ensure effective implementation and/or success in meeting the goals of the organization, including equity goals and expectations.
4.5.6.1.3 Equity-Based Practices, Policies, and Services
| Theme: Equity-based Practices, Policies, and Services | Respondents | Percent |
|---|---|---|
| Actively conduct services with equity lens | 14 | 61% |
| Area of growth/organization not at level it should be | 19 | 83% |
| Does not actively conduct services with equity lens | 15 | 65% |
| Formal equity-based policies and practices | 17 | 74% |
| Formal equity-based policies and practices required by the state or other partners | 9 | 39% |
| Lack of formal equity-based policies and practices | 19 | 83% |
| Minimal communication on equity-based work | 7 | 30% |
| Proactive communication on equity-based work | 5 | 22% |
| Unsure or unaware of equity pracitces and/or policies in organization | 17 | 74% |
When respondents were asked about their organization’s equity-based policies, practices, and services, many respondents indicated instances in which equity-based policies and practices had been implemented, however, more respondents made comments about instances in which there was a lack of formal policies and practices (83%), this was an area of growth and that the organization was not at the level it should be (83%), that they were unsure or unaware of equity practices and/or policies in the organization (74%), and the organization does not actively conduct services with an equity lens (65%). These findings are consistent with the previous section that highlights the large number of respondents who indicated that equity-based work has been a recent emphasis and that organizations have been responsive to recent socio-political events and trends.
Conversely, a majority of respondents did comment on instances in which their organization actively conducts services with an equity lens (61%), and/or have implemented formal equity-based policies and practices (74%). But, again these comments were fewer than instances of citing not having equity-based policies or practices or indicating that they were unsure or that this was an area for growth for their organization. When respondents did indicate having formal policies and practices, they were primarily around anti-discrimination policies, equity-based trainings/workshops that staff participate in, and using data to identify disparities in outcomes. Additionally, about 39% of respondents indicated that certain equity-based policies and practices were actually required by the state or other groups such as funders.
Lastly, when respondents were asked about the extent to which their organization proactively communicates externally about their equity-based work, more respondents indicated minimal communication (30%) than proactive communication (22%) about the work. It is important to note that a minority of respondents, in both cases, commented on external communication of equity-based work and priorities.
4.5.6.1.4 Goals, Benchmarks, and Data
| Theme: Goals, Benchmarks, and Data | Respondents | Percent |
|---|---|---|
| Goals and benchmarks | 19 | 83% |
| No data collected or analyzed through equity-lens | 5 | 22% |
| No goals and benchmarks | 11 | 48% |
Participants were asked to what extent their organization set goals for racial justice across program areas and to what extent they had benchmarks, metrics, and indicators for measuring their organization’s success in implementing such goals. Most respondents reported having implemented some goals and benchmarks in at least one area of their organization. Some respondents reported having racial equity goals in particular, noting specific task forces or data collection processes that look at disparities by race and ethnicity of their clients or students. Sometimes this data collection is necessitated through funding the organization receives or for state-level data reporting purposes. For example, one respondent said the following:
“Our division director, [omitted name], who works, well, along with other folks in the agency, they have a whole litany of data and things that they collect… They are a certain list of achievements that they want, it’s across the state, all [organizations like ours] do in the different program areas.”
In the quote above, the data collection around race and ethnicity is specific to and operationalized at the state level. However, other funders outside of the state may have additional metrics and goals — some related to racial equity and others not. Some respondents identified general goals or benchmarks measured by their organizations, but they were not always specified as racial equity-based goals or benchmarks, which is why they were also tagged as having no goals or benchmarks. For example, one respondent discussed benchmarks around racial-equity in leadership and employees’ annual evaluations, reporting that there were not thus far.
Lastly, five participants identified either specific areas where the data collected is not analyzed through the lens of racial-equity or no data is collected. For example, one participant said their organization does collect data on services utilized by clients but that information,
“was pulled out not, per se, by racial demographics, but more so by departments, and whom of those folks went to receive child welfare services versus adult services versus food stamps services, et cetera.”
It is important to note that some of the interview participants worked for organizations in more rural parts of the county where the population skews more White so the demand for collecting and analyzing racial equity metrics may be lacking in comparison to other organizations.
4.5.6.1.5 Level of Culture Inclusivity
| Theme: Level of Culture Inclusivity | Respondents | Percent |
|---|---|---|
| Culture of inclusion and support | 21 | 91% |
| Expectation for POC to assimilate to White norm | 11 | 48% |
| Family definition varies little or not at all from nuclear definition | 5 | 22% |
| Inclusive definition of family | 15 | 65% |
Interviewees were asked a few different questions gauging their organization’s culture and inclusiveness. Almost all interviewees at one point or another in the interview discussed some level of cultural inclusivity at their organization. What that culture of inclusion and support looked like at each organization varied across interviews. Some participants discussed a culture of inclusion and support from an employee point of view. They cited professional development trainings (usually related to racial equity), staff discussions, and the existing diversity of staff not only in terms of race, gender and other identities, but also a diversity in points of view to argue a level of support and inclusion in the organization. Other participants discussed a culture of inclusion and support for the clients or students they serve. For example, some people identified issues with public transportation and child care as barriers to service so their level of inclusiveness and support included eliminating or reducing those barriers during outreach. Further, some respondents noted that their organizational culture and discussions around racial equity have only recently begun to focus on that work in an intentional way and that it is an area of continued growth and support for organizations.
While most respondents indicated some level of support and inclusivity of employees, some respondents implicitly or explicitly discussed the ways in which people of color are expected to assimilate to a set of White social norms in organizations. Social norms are the written and unwritten rules for how one is to behave in society and they vary across time and context. A few respondents discussed a White social norm at a societal level. For example, one respondent stated that
“…the White norm is the standard for operating in our society. The rules have been written around a White norm. All of the standards and structures that we consider ‘normal’ are written to the straight, White, male norm.”
Another noted that while at their organization they do their best to signify that everyone will be treated equally but
“in society, there is some expectation that you’re going to try to [be] mainstream anyway.”
‘Mainstreaming’ in this context signifies assimilating to the social norms at large. Another respondent acknowledged the “code-switching” that non-White employees have to engage in, while another participant mentioned being asked about hair policies in their organization by a non-White employee because of the social norms of language and physical appearance. These social norms can also affect the people participants serve. For example, one person discussed the importance of helping other staff recognize the existence of those social norms because she thinks
“…that also has a lot to do with why our Black students are disproportionately disciplined and written up, because we don’t recognize all the time that our norms are not everybody’s norms.”
In this statement, the participant made an explicit connection between implicit biases and racial disparities in their organization.
Another component of how inclusive an organization is has to do with how families are defined and supported by the organization. A majority of respondents reported their organizations have a very flexible definition of what a family is that is not necessarily in accordance with a traditional or nuclear family where there are two parents and one or more children. Some respondents noted that their organizations will define a client’s family as “anybody [they] consider family.” This sentiment was echoed throughout several interviews indicating that it does not matter if a household is a two-parent household, if the grandparents are the guardians, or if the family is part of a LGBTQ+ family. Some respondents did note that depending on specific circumstances, families must be defined from a legal perspective. That is, whoever is legally the next of kin or legal guardians are the family, which may reflect a more traditional or nuclear family definition.
4.5.6.1.6 COVID-19 Impact
| Theme: COVID Impact | Respondents | Percent |
|---|---|---|
| COVID-19 affecting job and/or organization functions | 14 | 61% |
About 61% of respondents mentioned at some point during their interviews the impact of the COVID-19 pandemic on their jobs or organizations. COVID-19 affected people in a myriad of ways across different community provider sectors. Many employees’ day-to-day activities were affected as organizations shifted from face-to-face-oriented services to virtual services for their clients or students. Some initiatives that were in the implementation process (related to equity or not) were necessarily suspended. Student data related to testing and readiness to advance was halted due to the shift to virtual learning. If there were organizational activities for staff (potlucks, training, discussions), they were shifted to a virtual format or canceled altogether.
Additionally, interview participants were asked (when responding specifically to demographic questions) what the greatest impacts the COVID-19 pandemic had been on them, their families, or their agencies. Of the 22 respondents who provided this information, all but one described the personal and/or professional toll the pandemic had on them. These effects included mental health concerns and impacts such as isolation, fear of the unknown, and high stress. Respondents with children in the home reported increased time demands and stress due to the transition of students from in-person to virtual learning. Some respondents also reported health effects and losing loved ones from COVID-19. Professional effects reflected much of what was said during interviews, which included the transition to online/virtual services to keep community members and employees safe, staff morale and stress, lower utilization of services, and staffing issues. But, as the interviews demonstrate, and as one respondent reported succinctly, there is a level of resilience among community service providers with the will to still serve clients and the community as best as they can.
4.5.6.1.7 Structural Violence
| Theme: Structural Violence | Respondents | Percent |
|---|---|---|
| Structural violence | 18 | 78% |
While there was not a specific question that asked respondents if they experienced structural violence or not, 78% of participants described in their interviews at various points experiences with structural violence. A few respondents discussed stress from the nature of their jobs, possible burnout from their workloads, and that the COVID-19 pandemic had added an extra burden and, at times,new traumas. Most structural violence, however, was described when participants were talking directly about the people they serve. These client or student experiences ranged from issues such as lack of child care or health care, food or housing insecurity, and language barriers, to racial trauma, and physical abuse or neglect. Out of all the adverse community experiences described during interviews, participants cited transportation issues as the most frequent barrier to services. Additionally, school safety and school policies (e.g., discipline and suspension, dress code) that create non-equitable practices were specifically cited by a couple of participants. COVID-19 forced schools into virtual or remote learning and not every student logged in to the virtual academy, potentially creating downstream effects on readiness to advance.
4.5.6.2 Conclusions
Overall, interview participants described a wide range of experiences within and across human service provider organizations. Some participants were able to easily identify specific racial equity-based practices and policies, while some knew of their general existence and others did not have direct knowledge. It is abundantly clear from these interviews that the COVID-19 pandemic and the socio-political landscape of the last year or two have affected mindsets and/or organizational priorities. The COVID-19 pandemic shifted how providers serve the community and affected employees’ mental health outside of work. The George Floyd protests of last summer sparked or furthered difficult conversations within organizations. Yet despite these external stressors, these interviews reflect a general sense of resilience among these human service provider organizations as they have demonstrated the ability to adapt to a ‘new normal’ while continuing to serve their communities and pushing to achieve greater levels of equity in service. These conversations also signify that racial equity-based work is an area of growth for organizations and many participants were hopeful that their organizations will continue to grow to ensure a more equitable future for all.
4.5.6.2.1 Conclusions on Trauma Informed Practices
In sum, roughly 72% of respondents in child-serving agencies were not familiar with the TRC model, and an additional 26% of respondents reported familiarity with the model but no training. Scores on the Environmental Assessment Scale and Staff Practices Survey generally showed neutral to moderate alignment with trauma informed practices. Respondents with higher levels of training generally scored higher on the Staff Practices Survey, and organizational leaders often had higher scores than other employees on both the Environmental Assessment Scale and Staff Practices Survey, indicating higher levels of alignment with trauma informed care practice at their agencies. However, some respondents reported lower scores, particularly on the Environmental Assessment Survey and on some subscales of the Staff Practices Survey, suggesting that there may be variation across agencies or staff.
Interview participants indicated that there is a greater sense of urgency for racial equity-based work within the past few years with some respondents reporting additional organizational activities around racial equity as a response to broader socio-political events (e.g., the George Floyd protests). This has led to many organizations to prioritize diversity of staff over diversity of leadership in order to match the populations they serve. In these cases, there can be less diversity in leadership, reflecting the lack of an employee pipeline within the organization for people of color. Several organizations have sufficient resources to engage in racial equity-based practices and policies, while others face barriers such as leadership, funding, and/or staff buy-in. Yet, respondents reported that, in general, their organization’s culture is inclusive and supportive of people from diverse backgrounds although some respondents reported an expectation of people of color to assimilate to White organizational social norms. This also reflects a main finding among a plurality of interview participants which is that racial-equity based work is an area of growth or at least not at the level it should be at their organization.
Multiple organizations serve members of the community who have experienced structural violence, which suggests there are many adverse experiences that the community encounters which can compound pre-existing trauma or lead to new forms of stress and trauma. In addition, the COVID-19 pandemic not only affected how community service providers served the community, but it also added extra personal and professional stressors and trauma.
4.6 Transformational Leadership
This section includes survey results of the transformational leadership measure. Transformational leadership is defined as leadership that enhances motivation, morale and performance of the staff and includes four components:
- Individualized consideration: the degree to which leaders attend to each staff’s needs.
- Intellectual stimulation: the degree to which leaders challenge assumptions, take risks and elicit follower’s ideas.
- Inspirational motivation: the degree to which leaders create a vision that inspires followers.
- Idealized influence - leaders who serve as role models for high ethical behavior, instilling pride, and gaining respect and trust.
Below are a few example questions from this measure:
- The leader of my organization communicates a clear and positive vision of the future.
- The leader of my organization encourages thinking about problems in new ways and questions assumptions.
All of the questions included in this measure are listed in Appendix B: Detailed Question Responses by Scale.
Transformational leadership is important in social service agencies because it is associated with the ability for leaders to facilitate organizational change, especially the type of change required to align with a trauma-informed model.
4.6.1 Key Findings
- Scores on the Global Transformational Leadership Scale were generally high.
- Analysts found no measurable differences in the average scores of global transformational leadership among any demographic group.
4.6.2 Analysis
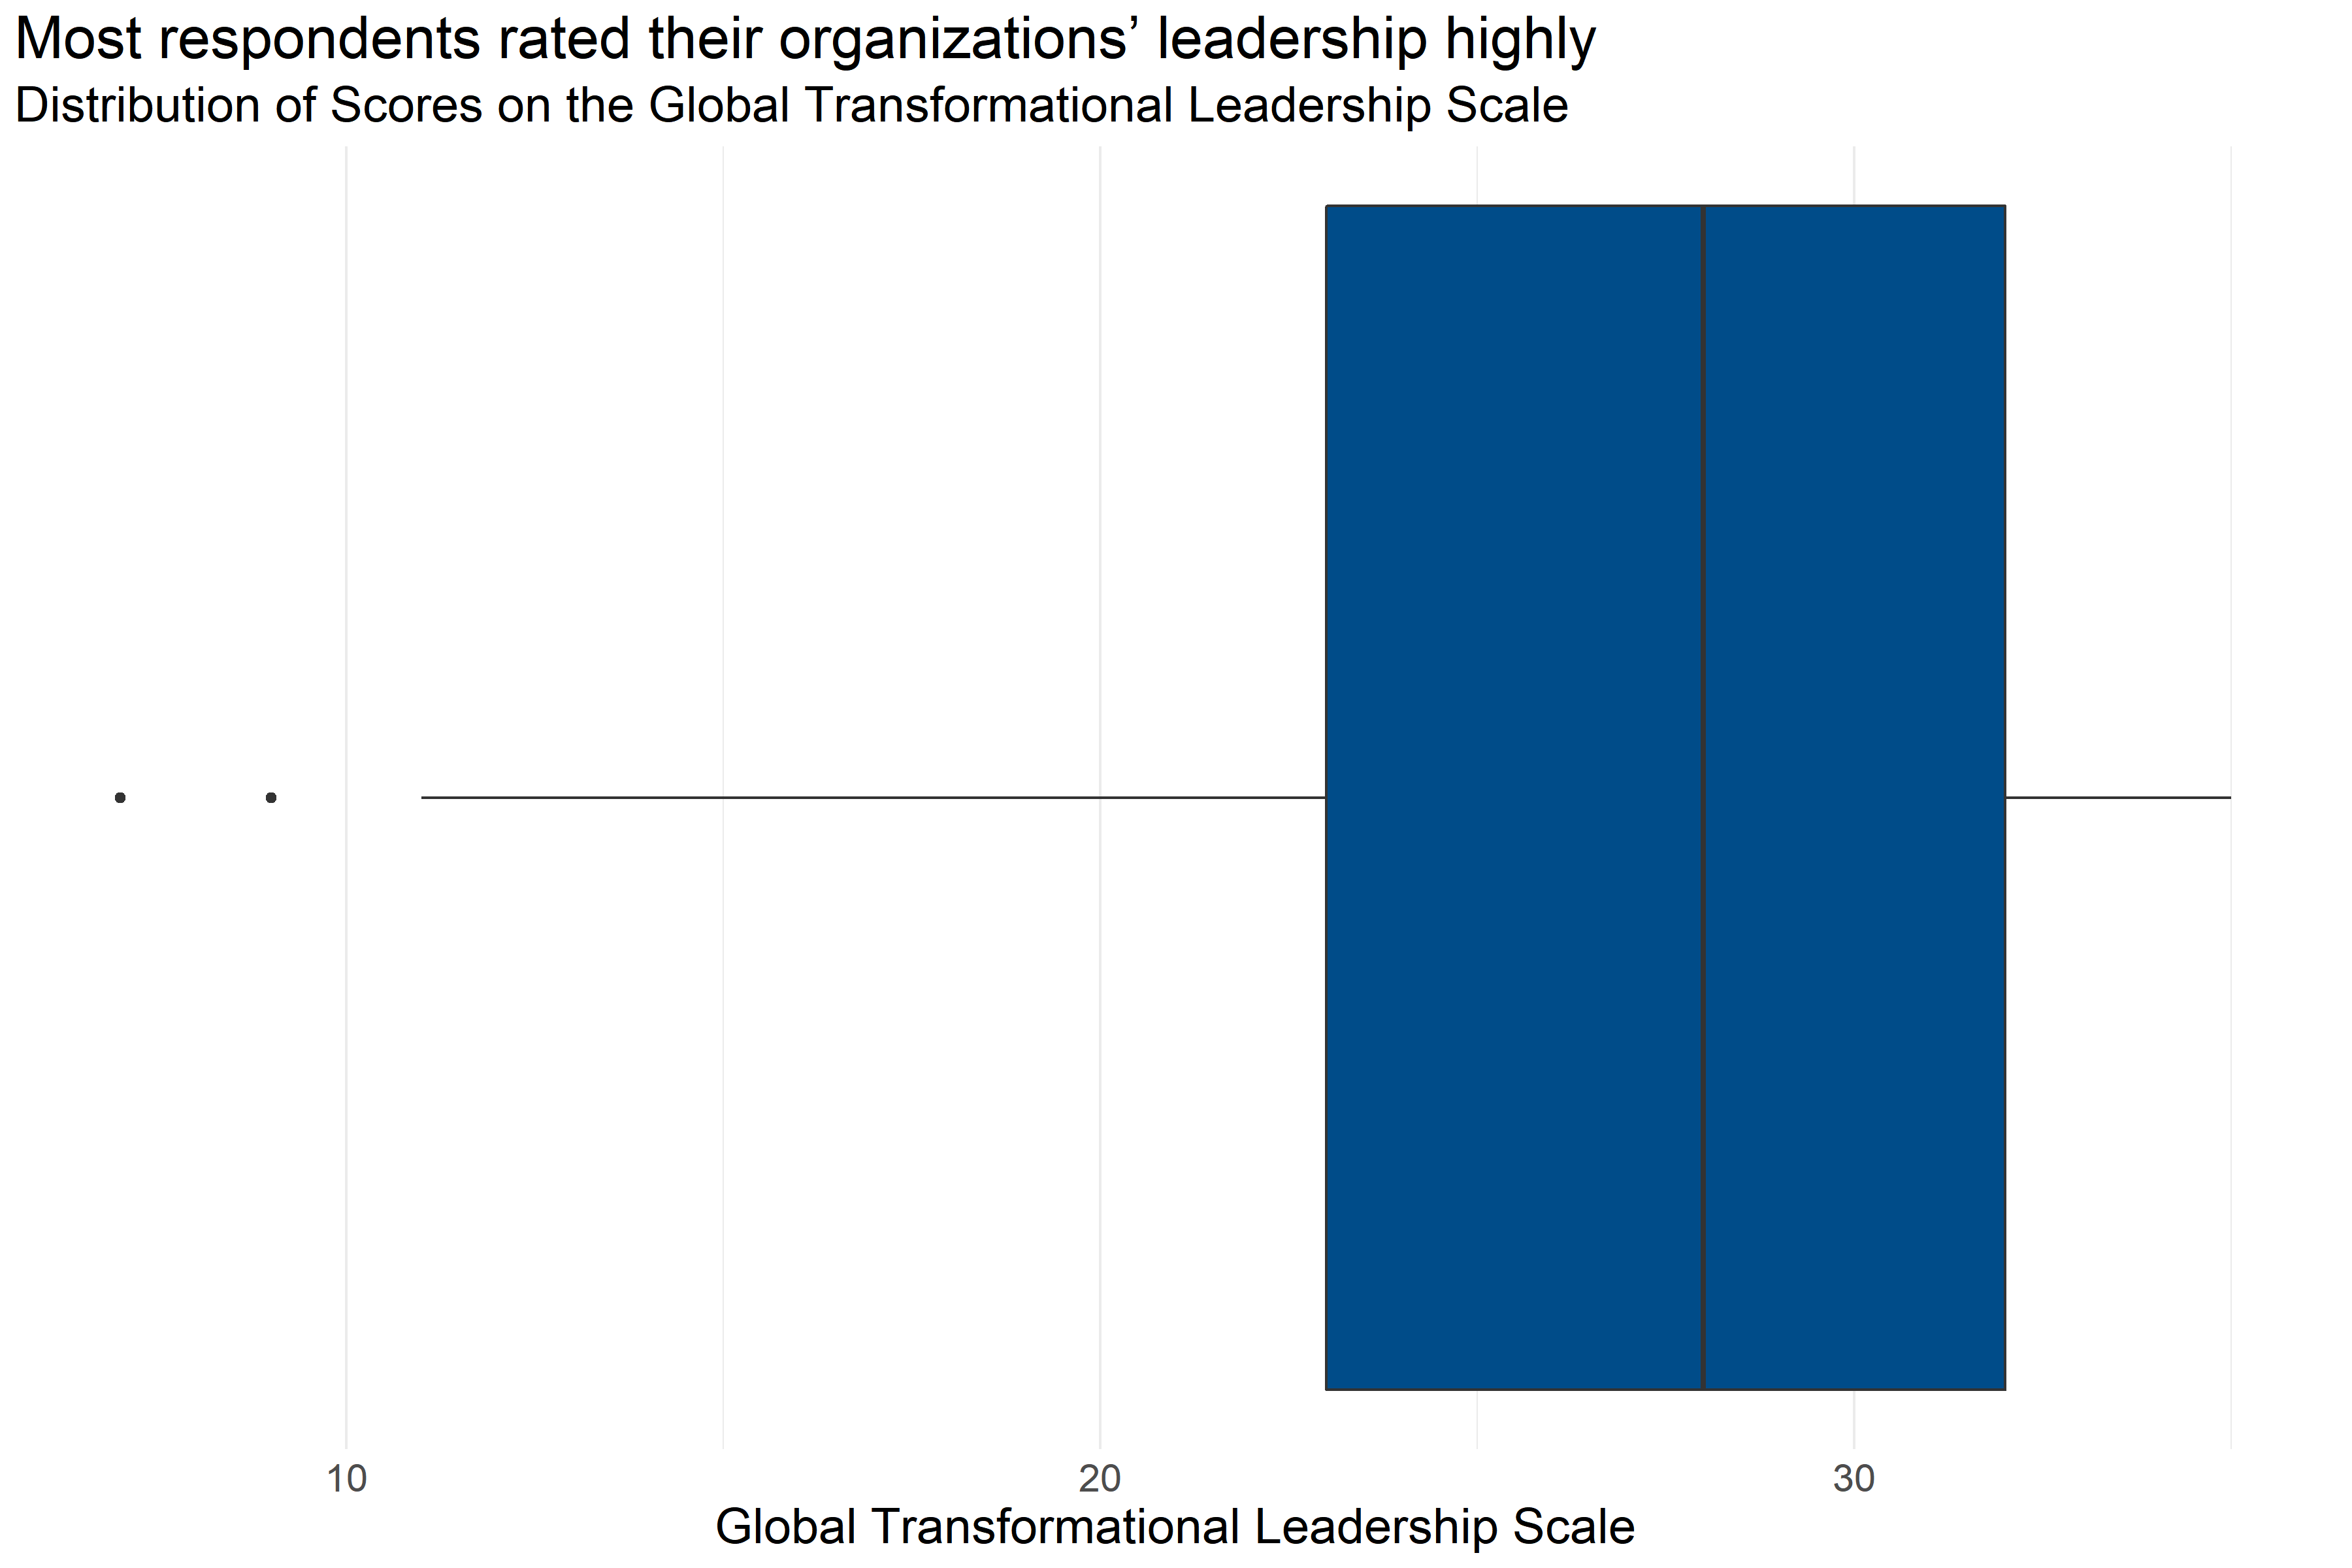
Figure 4.58: Boxplot of score distributions for Global Transformational Leadership Scale
| Number of Answers | Average Score | Lowest Score | First Quartile | Median | Third Quartile | Highest Score |
|---|---|---|---|---|---|---|
| 186 | 26.22 | 7 | 23 | 28 | 32 | 35 |
Figure 4.58 and Table 4.48 provide information about how respondents scored on the Global Transformational Leadership Scale. They provide the following information:
- Response: 186 respondents answered all questions in the scale.
- Average: The average score was 7.
- Range: Scores ranged from 26.22 to 35.
- Median: About half of respondents scored below 28 and half scored above 28.
- Interquartile Range: If the range of responses were cut into quarters, the middle half of respondents (between the first and third quartiles) scored between 23 and 32.
This means that more than half of respondents generally answered that they agreed or strongly agreed, that their leaders’ practices were consistent with characteristics of transformational leadership.
Analysts tested the average scores on the Global Transformational Leadership Scale across demographic groups to identify differences in how respondents answered questions about their organization’s leaders. However, there were no noticeable differences in average scores on the Global Transformational Leadership Scale among any demographic group.
4.6.3 Conclusion
75% of respondents rated their leadership as highly aligned with a transformational model, on average; however, a few respondents rated their leadership negatively or neutrally. Analysts tested the average scores on the Global Transformational Leadership Subscale across demographic groups to identify differences in how respondents answered questions about potential indications of secondary traumatic stress, but there were no noticeable differences in the average scores of global transformational leadership among any demographic group.
4.6.3.1 Important Considerations
This data is based on a survey that respondents volunteered to take across a variety of fields. There could be ways that the people who volunteered to take the survey are different than other people who work in child-serving agencies. Furthermore, because smaller differences between groups are easier to see with a higher number of survey responses, it is possible that there are other differences that exist across demographics that analysts would be able to measure with a larger group of respondents.
4.6.3.2 Implications
Scores on the Global Transformational Leadership Scale generally indicate that most respondents’ survey answers were highly aligned with a trauma informed model. However, a few respondents gave answers which rated their global transformational leadership negatively or neutrally, and the range of scale scores could indicate that some agencies have less-aligned environments than others.
4.6.4 Conclusion
Most respondents in child-serving agencies have experienced at least one ACE, with almost half experiencing 1-3 ACEs. The most common ACEs experienced were emotional abuse, loss of a parent, household mental illness, substance abuse, and physical abuse, which mirror the adverse experiences of adults in Forsyth County in general.
In addition, 44% of respondents reported experiences of discrimination, with Black / African American respondents, respondents not identifying as White, and middle-income respondents being the most likely to report experiences of discrimination.
This suggests that ACEs and experiences of discrimination, both potentially traumatizing experiences, are relatively common among staff in child-serving agencies. Some of the specific ACEs experienced by staff are likely to be similar to the experiences of adults in their client’s households, which could result in staff experiencing triggers when interacting with some clients.
78% of respondents reported being at least somewhat impacted by COVID-19, and 20% reported being “very much impacted,” and interviews with staff found that COVID-19 both impacted how providers were serving the community, and added personal and professional stressors. Staff reporting that they were not impacted by COVID-19 reported fewer indications of arousal. Scores on the Secondary Traumatic Stress Scale subscales were generally low, but some respondents did report higher scores.
Roughly 72% of respondents in child-serving agencies were not familiar with the TRC model, and an additional 26% of respondents reported familiarity with the model but no training. Scores on the Environmental Assessment Scale and Staff Practices Survey generally showed neutral to moderate alignment with trauma informed practices. Respondents with higher levels of training generally scored higher on the Staff Practices Survey, and organizational leaders often had higher scores than other employees on both the Environmental Assessment Scale and Staff Practices Survey, indicating higher levels of alignment with trauma informed care practice at their agencies. However, some respondents reported lower scores, particularly on the Environmental Assessment Survey and on some subscales of the Staff Practices Survey, suggesting that there may be variation across agencies or staff.
Interview participants indicated that there is a greater sense of urgency for racial equity-based work within the past few years. This has led to many organizations to prioritize diversity of staff over diversity of leadership in order to match the populations they serve. In these cases, there can be less diversity in leadership, reflecting the lack of an employee pipeline within the organization for people of color. Several organizations have sufficient resources to engage in racial equity-based practices and policies, while others face barriers such as leadership, funding, and/or staff buy-in. Yet, respondents feel that, in general, their organization’s culture is inclusive and supportive of people from diverse backgrounds.