4 Figure
You can include R plots using your favorite graphics packages (graphics, lattice or ggplot2) and their extensions.
4.0.1 Graphics with R code
A simple graph with function plot (Figure 4.1)
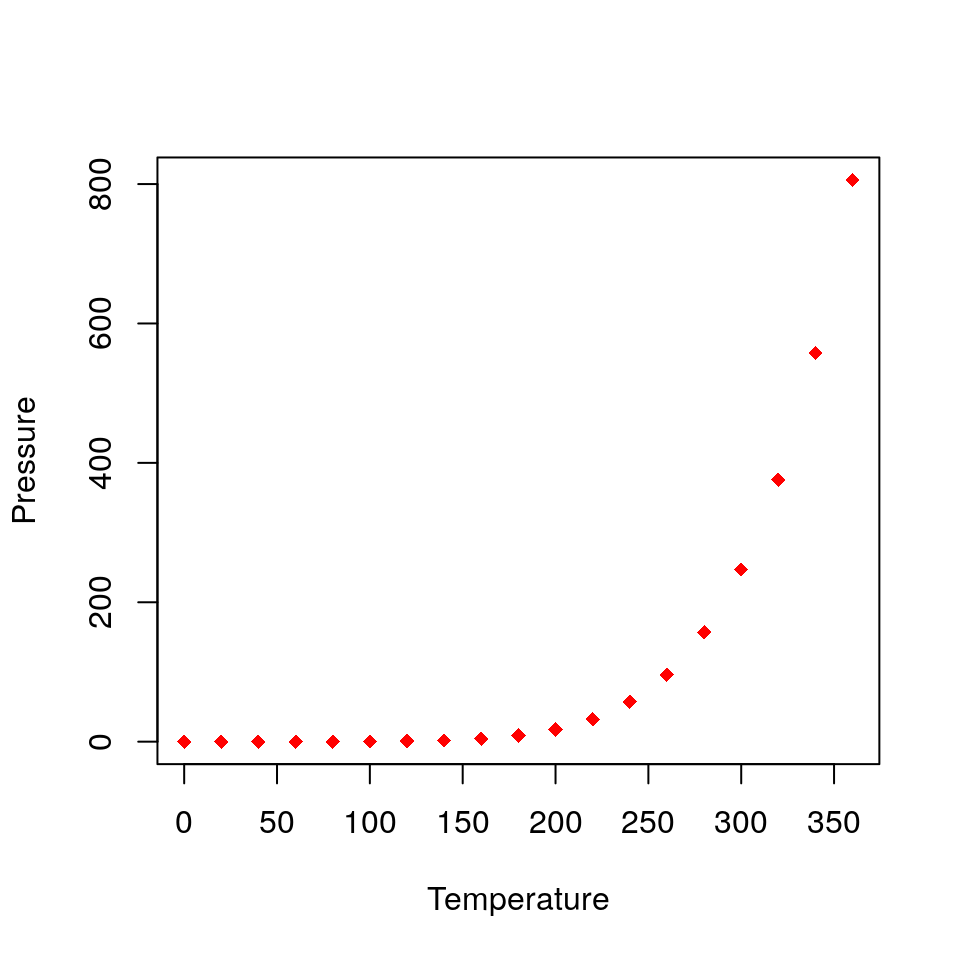
Figure 4.1: Plot example
Changes to the behavior of the graph in the final file can be made by changing the options in the chunk.
In the current example, the size of the graph is being changed with the commands
fig.width and fig.height.
See the references for more options.
A simple graph with function `plot` (Figure \@ref(fig:grafplot))


``{r grafplot, fig.cap="Plot example", fig.width=5, fig.height=5, fig.align='center'}
data(pressure)
plot(pressure, col="red", pch=18, xlab="Temperature", ylab="Pressure")
```
4.0.2 Inserting figures external to R
External figures must be included within an R chunk. As the figure below.
Rhodes symbol (4.2)

Figure 4.2: Rhodes symbol
Rhodes symbol (\@ref(fig:rhodes))

``{r rhodes, fig.cap="Rhodes symbol", fig.pos='H', fig.align='center'}
knitr::include_graphics("rhodes.png")
```